Technical Analysis Of The Markets


Current Position of the Market
SPX: Long-term trend – The bull market is continuing with a top expected in the low 3000s.
Intermediate trend – An intermediate correction from 2872 may be over.
Analysis of the short-term trend is done on a daily basis with the help of hourly charts. It is an important adjunct to the analysis of daily and weekly charts which discusses the course of longer market trends.
Is the Correction Over?
Market Overview
It looks like it! Until Friday, the correction pattern which started at 2754 could have been either accumulation or distribution. Because a logical retracement called for at least 2670, the latter was given the edge; but Friday’ action has shifted the odds to the former. We do not yet have a confirmation, although a minor buy signal was given, and SPX will have to surpass its former short-term high of 2754 by a decent margin before we have one.
At Friday’s close, the index has reached an area of resistance (caused by several factors) which could halt its progress, at least temporarily. It also faces a cluster of small cycles bottoming in the middle of next week, and something perhaps even more important later in March. Also, the market could respond negatively to Fed chair Powell’s testimony on Tuesday. So we need to assess if we have only reached the middle of the corrective pattern, or if we’re done with it, and we’ll need another week to do so.
Chart Analysis (These charts and subsequent ones courtesy of QCharts)
SPX Daily Chart
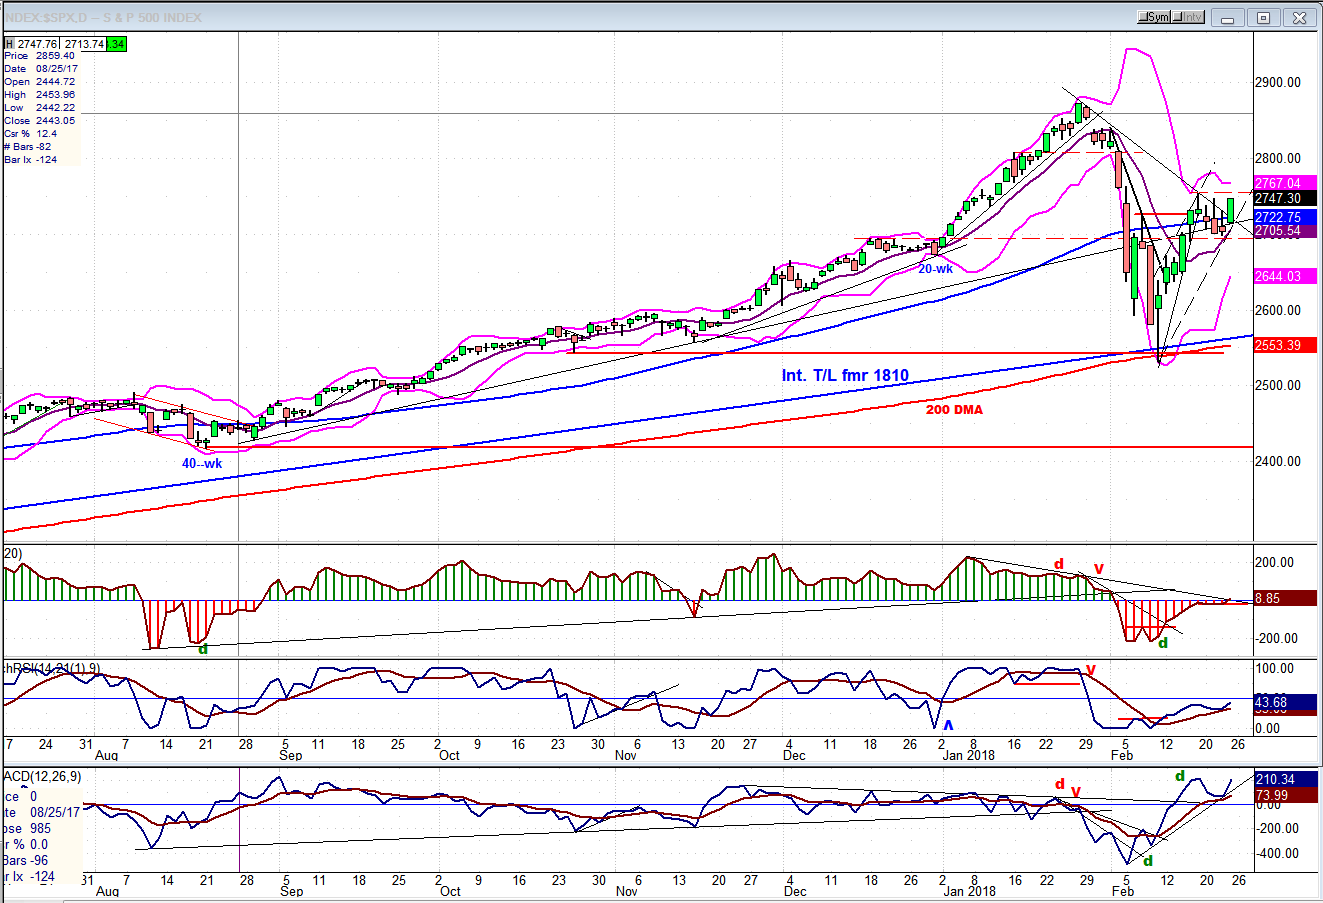
The overall daily SPX chart is beginning to look bullish. The correction never did turn the blue 55-DMA down (even though it was breached seriously), and the index promptly rallied above it on the rebound and stayed above the pink 9-DMA. The correction was so shallow that I expected it to continue lower; but instead, it found support on the 9-DMA and rallied sharply on Friday. Since the index never went below the top of the 2695 previous high (dashed line) which provided good support after it was decisively overcome in the rebound, it is possible that this is as deep a retracement as we will get, and that we are (almost) ready to move to a new high.
The immediate obstacle to moving higher immediately is the small cluster of minor cycles bottoming next week. One should expect some sort of retracement into mid-week which could start as early as Monday morning. There is also the possibility of this pull-back continuing for a while longer since another cycle is due mid-March. If the cycles cause enough weakness to take us below the 9-DMA again, it would delay the recovery.
Of the oscillators, only the A/Ds have given a buy signal. But the SRSI and the CCI will have to confirm their actions by also becoming positive. This would be the last piece to fall into place to confirm that we are extending the rally. Will the cycles that lie ahead prevent it from doing so, or simply delay the process? We’ll see! I do know that if SPX reverses and closes below 2700, the odds of extending the correction will be increased.
SPX Hourly Chart
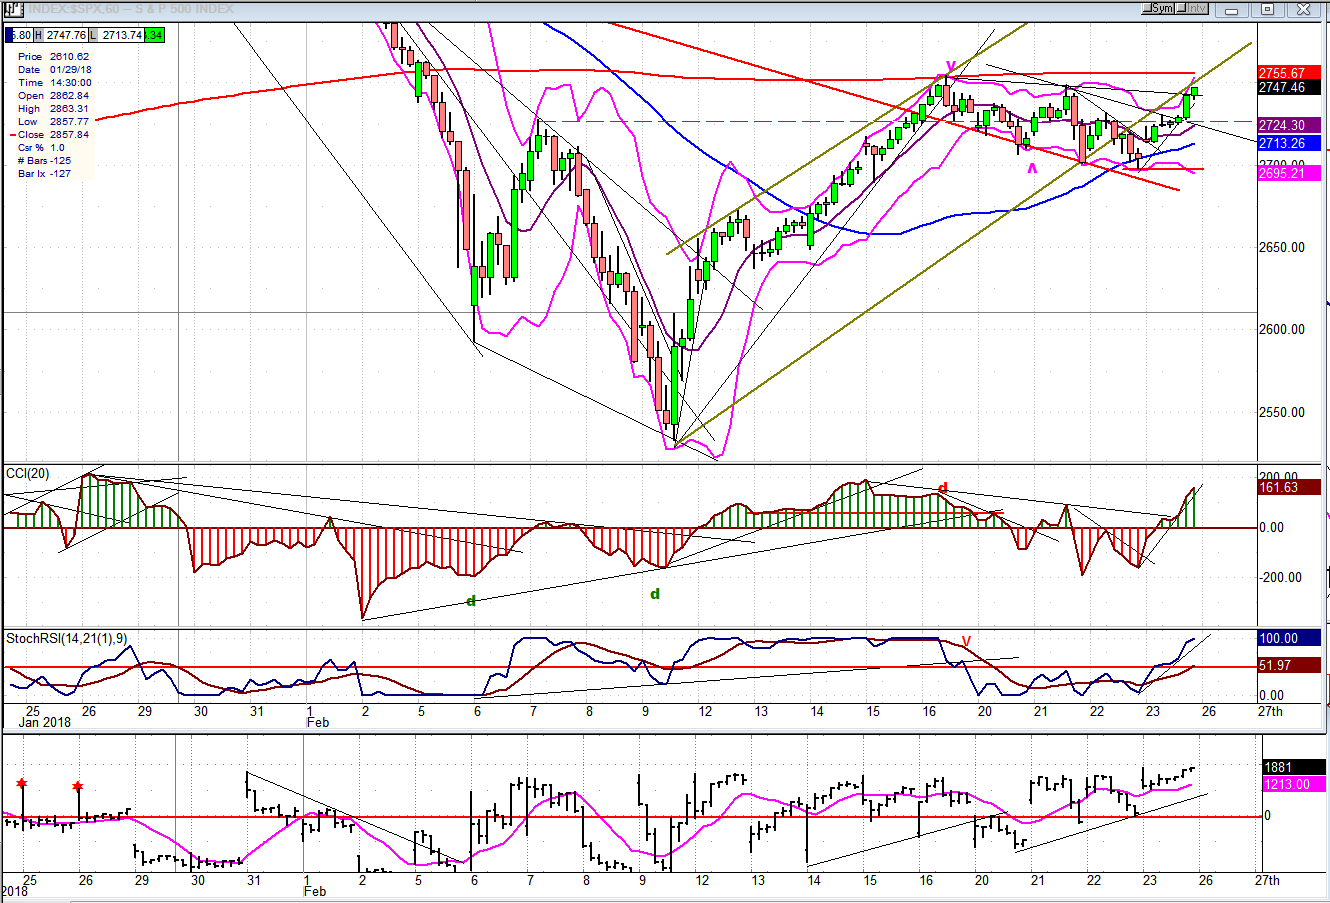
In both charts, the Bollinger band has been modified from a 20-ma to a 9-ma, which I feel generally does a better job of tracking prices. In both time frames, the price is above the center MA and this is therefore bullish.
The short-term oscillators are also bullish, since they have all given buy signals, but in spite of that, the price action is not quite as bullish as it is in the daily chart. I spoke of various factors causing overhead resistance at this level. One is the fact that so far, after trading below its lower channel line, the index has only back-tested it but has not yet risen above it. A little higher, at the level of the former high, the red (233-hr) MA which stopped the first push of the rebound, still has not been penetrated, which is a must for a confirmation that we have resumed our uptrend. The top band of Bollinger may also provide some resistance. Finally, in spite of the strong rally on Friday, there was some obvious deceleration in the price since the last hour candle is much shorter than the previous one. Actually, this may not a good criterion to use since the last hour showing is just a half-hour in duration.
Last week, I stated that in order to confirm the downtrend, the index would have to move again below its blue 55-hr MA. It did not, but found support on it, as did the daily on the 9-DMA. We also note that after moving above its red downtrend line, it consistently back-tested it and was not able to drop below it.
Everything considered, we have to conclude that the price action is predominantly bullish. But confirmation that the uptrend has resumed will only come after we have risen decisively above the former top and the red MA.
An overview of some important indexes (weekly charts)
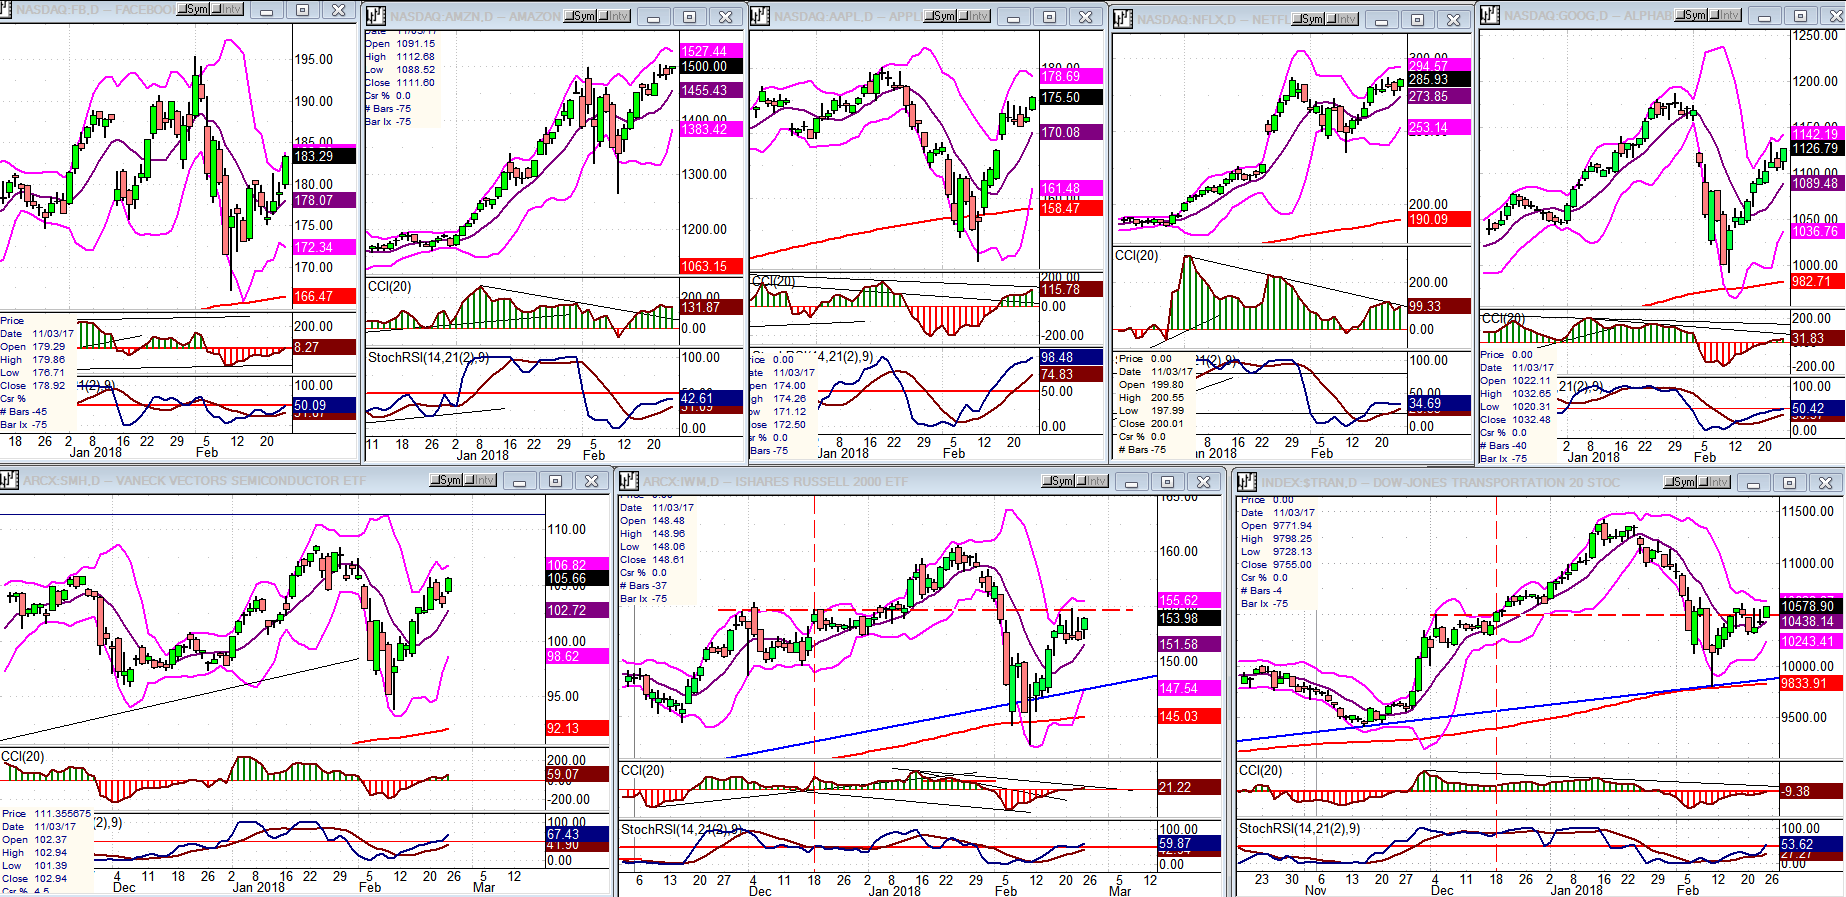
In the FAANGS (upper tier), Facebook and Google are laggards in the group, with the three center ones clearly outperforming the market.
In the bottom tier, our favorite leaders IWM and TRAN (on the right) are slightly underperforming the SPX which received much of its momentum from Nasdaq stocks on Friday.
Overall, it’s a mixed bag with most indexes still in consolidation patterns.
UUP (Dollar ETF)
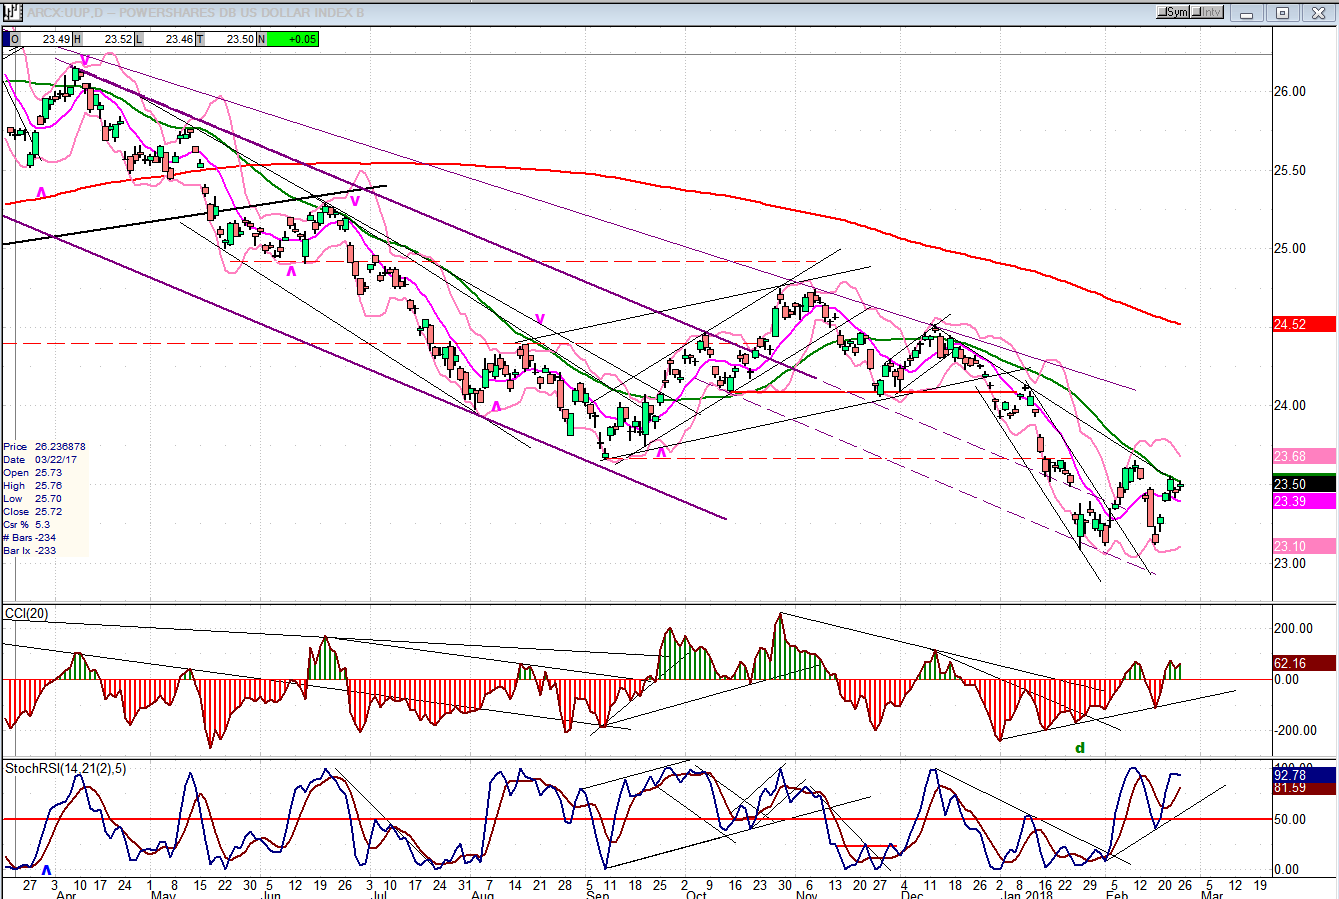
UUP has rallied from its low one more time, but that has put it just under the green 30-DMA which appears to best determine its trend. We’ll have to see if it can break above or be pushed back again -- should know by next week.
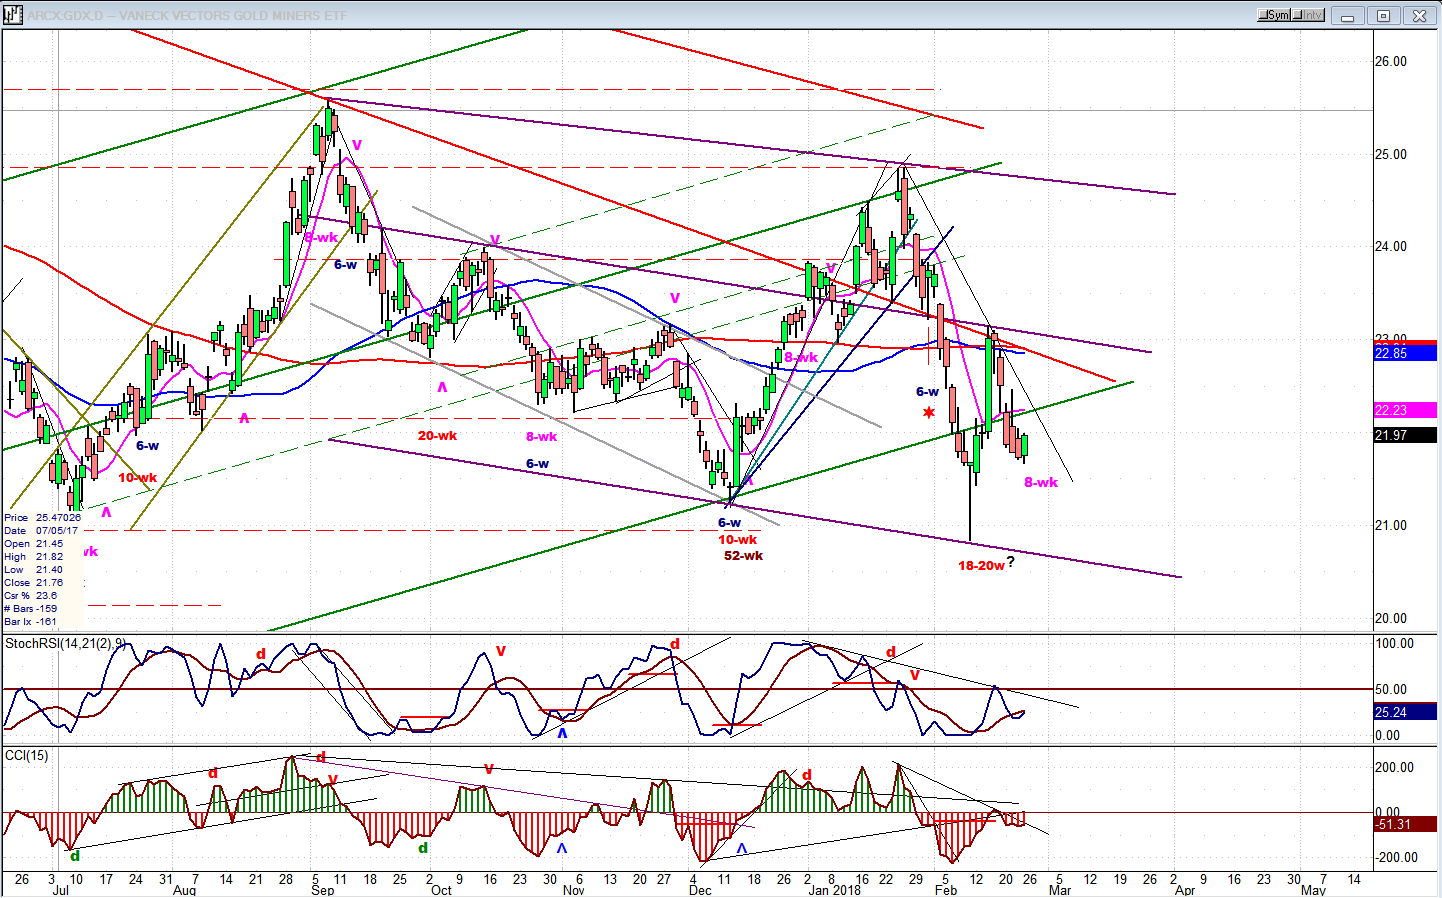
GDX (Gold Miners ETF)
GDX has a cycle which seems to vary between 18 and 20 weeks in length. This is the cycle which most likely caused the sharp decline back down to 21 when it made its low, and caused the subsequent rally. Next week should bring the low of an 8-wk cycle which is causing the next pull-back. If so, a rally should follow which must take GDX back to 24.00 if it is to turn its broad correction into a potentially bullish pattern. Eventually, only a move out of its corrective channel will decide if it can get back into a significant uptrend.
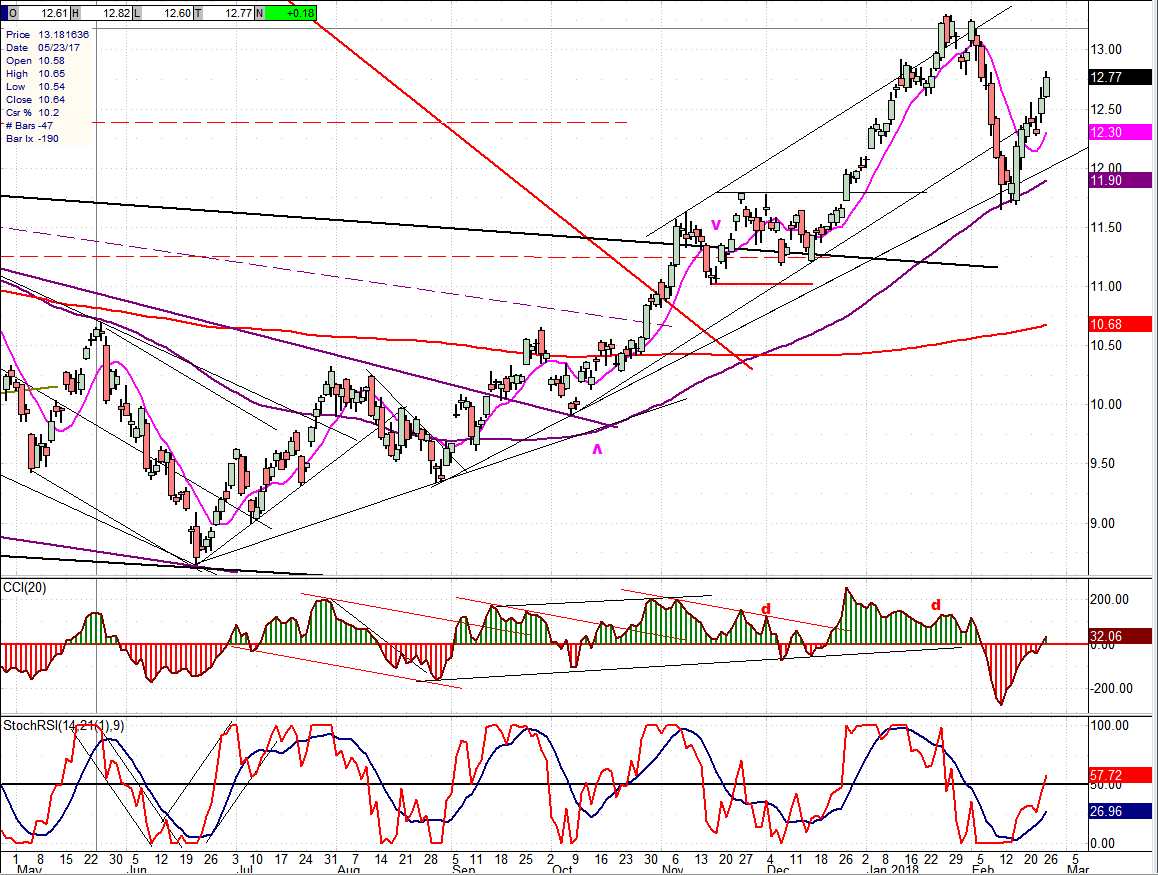
USO (United States Oil Fund)
USO appears to precisely follow the purple 89-DMA. It started its uptrend when it broke above it and recently found support on it, exacly! Of course, this was also predictable because this was the top of the last congestion level. Nevertheless, we should be alerted to a deeper correction if it breaks below its 89-DMA. As long as it remains above it, it remains in an uptrend.
Summary
SPX may be close to ending its correction and resuming its rally from the 2540 low. It will first need to face a hurdle caused by some minor cycles bottoming next week and in March. A move back below 2700 would most likely extend the correction.
FREE TRIAL SUBSCRIPTON
With a trial subscription, you will have access to the same information that is given to paid subscribers, but for a limited time period. I think you will find that knowing how far a move can carry is one of the most useful benefits of this service, whether you are a trader or an investor -- especially when this price target is confirmed by reliable indicators which give advance warning of a market top or bottom. Furthermore, cycle analysis adds the all- important time element to the above price projections.
For a FREE 4-week trial, further subscription options, payment plans, and for general information, I encourage you to visit my website at www.marketurningpoints.com.
The above comments about the financial markets are based purely on what I consider to be sound technical analysis principles. They represent my own opinion and are not meant to be construed as trading or investment advice, but are offered as an analytical point of view which might be of interest to those who follow stock market cycles and technical analysis.

When Andre Gratian was a stock broker years ago, a friend introduced him to technical analysis of the market. Consequently, it is not an exaggeration to say that Andre fell in love with this approach! Ever since then, it has become an increasingly important part of his professional life. Gratian has studied the works of Wyckoff, Edwards & Magee, Edward J. Dewey (cycles) and many others. However, one of my most profitable undertaking has probably been to study Point & Figure charting, which he finds invaluable in analyzing stocks and indices. If he were restricted to one methodology, this is the one that he would choose. This well-rounded background has given him what he feels to be a special insight into the stock market, facilitating the recognition of meaningful patterns and the ‘turning points’ in all trends, whether they be short or long term. Andre feels very comfortable discussing the stock market and passing on meaningful information to others. His subscribers include individuals and money managers throughout the world. Moreover, his Newsletters are currently published on several financial sites, here and abroad.
More from Gold-Eagle


