Technical Analysis Of The Markets
 share
share
 share
share
 share
share
 share
share
 share
share
Current Position of the Market
SPX: Long-term trend – The bull market is continuing with a top expected in the low 3000s.
Intermediate trend – The intermediate correction from 2872 has become more complex.
Analysis of the short-term trend is done on a daily basis with the help of hourly charts. It is an important adjunct to the analysis of daily and weekly charts which discusses the course of longer market trends.
A Complex Correction
Market Overview
After the abrupt and significant correction from 2872 took place, I questioned whether it could end before the 40-wk cycle had made its low in May. That does not mean that we could not have a retest of the high before dropping back into the cycle low. The market has been very volatile since the correction started, and it does not take long to create congestion patterns on the Point & Figure chart. These can give us a clue about how far the next move will carry. The short-term move to 2789 fell a little short of its 2800 (ca.) target, and the retracement to 2647 on Friday filled a near-term projection to this level, thereby creating a short-term low.
When the rally from the 2533 low overcame the previous short-term high of 2727, it suggested that the SPX recovery could reach as high as the previous top of 2872, or even a little higher, before reversing. Last week’s pull-back has not altered that possibility, and next week’s activity could confirm or nullify it. So let’s see what it brings. There has not yet been enough congestion created at the 2647 level to overcome the 2789 top, so it is likely that additional short-term consolidation will be needed before it can be tackled. A move to retest the highs before falling back into the 40-wk cycle low would be the most optimistic scenario. Additional weakness next week would favor the most pessimistic one, which is to first re-test the low, or even to go slightly lower.
Chart Analysis (These charts and subsequent ones courtesy of QCharts)
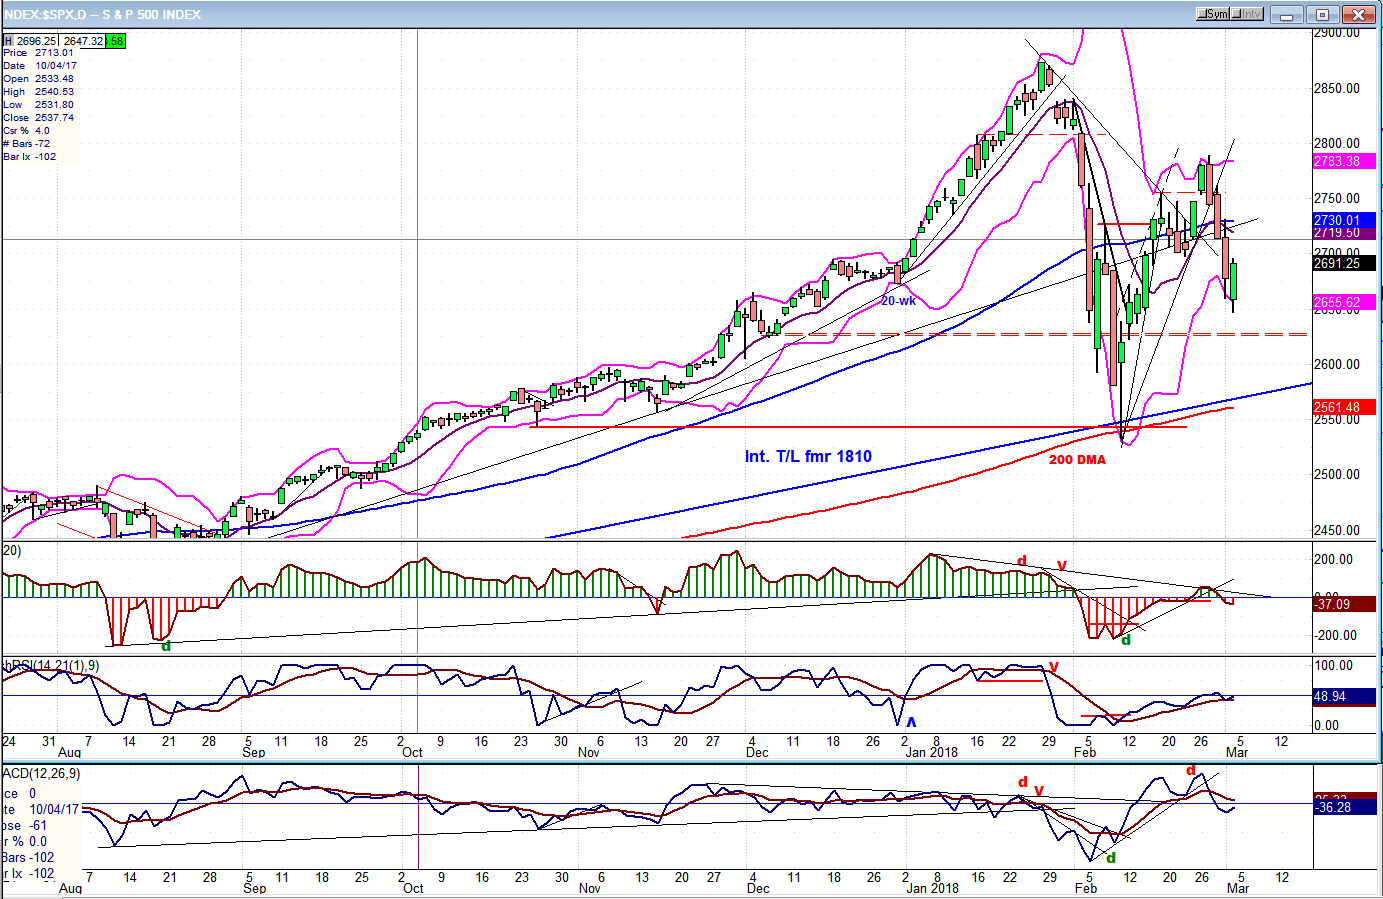
SPX Daily Chart
The daily chart shows the value of the 9-MA Bollinger band which creates a tighter envelope around the price pattern. The low of the correction found support on the combined 9MA-BB, the 200-DMA and the trend line from the 1810 low. Good enough to justify a strong rebound which took the index past the 2737 top all the way to 2789 in a 5-wave structure before correcting back down to 2647 on Friday. If we have started another rally in a 5-wave structure which takes us back to the former high of 2872 or even the 2900 level (which had been projected before a correction took place), and then reverse back down into the 40-wk cycle low, the intermediate correction may turn out to have been some type of flat. It’s something to watch for, but it’s much too soon to make that assumption.
The only thing of which we can be fairly certain is that we made a short-term low on Friday, but which is, as yet, still unconfirmed. In order to confirm it, we will need to extend Friday’s nearly 50-point reversal until the indicators have all given a buy signal. As of the close, we had not completely confirmed a reversal of the hourly chart indicators -- as we will see in the next analysis.
In order to give a buy signal on the daily chart, we will need to see a reverse of all three oscillators until they become positive; and the index will have to close at least above 2720, and preferably 2730. If we fail to do so, and depending on what comes next, it could mean that the outlined scenario of another bullish 5-wave pattern will not be realized.
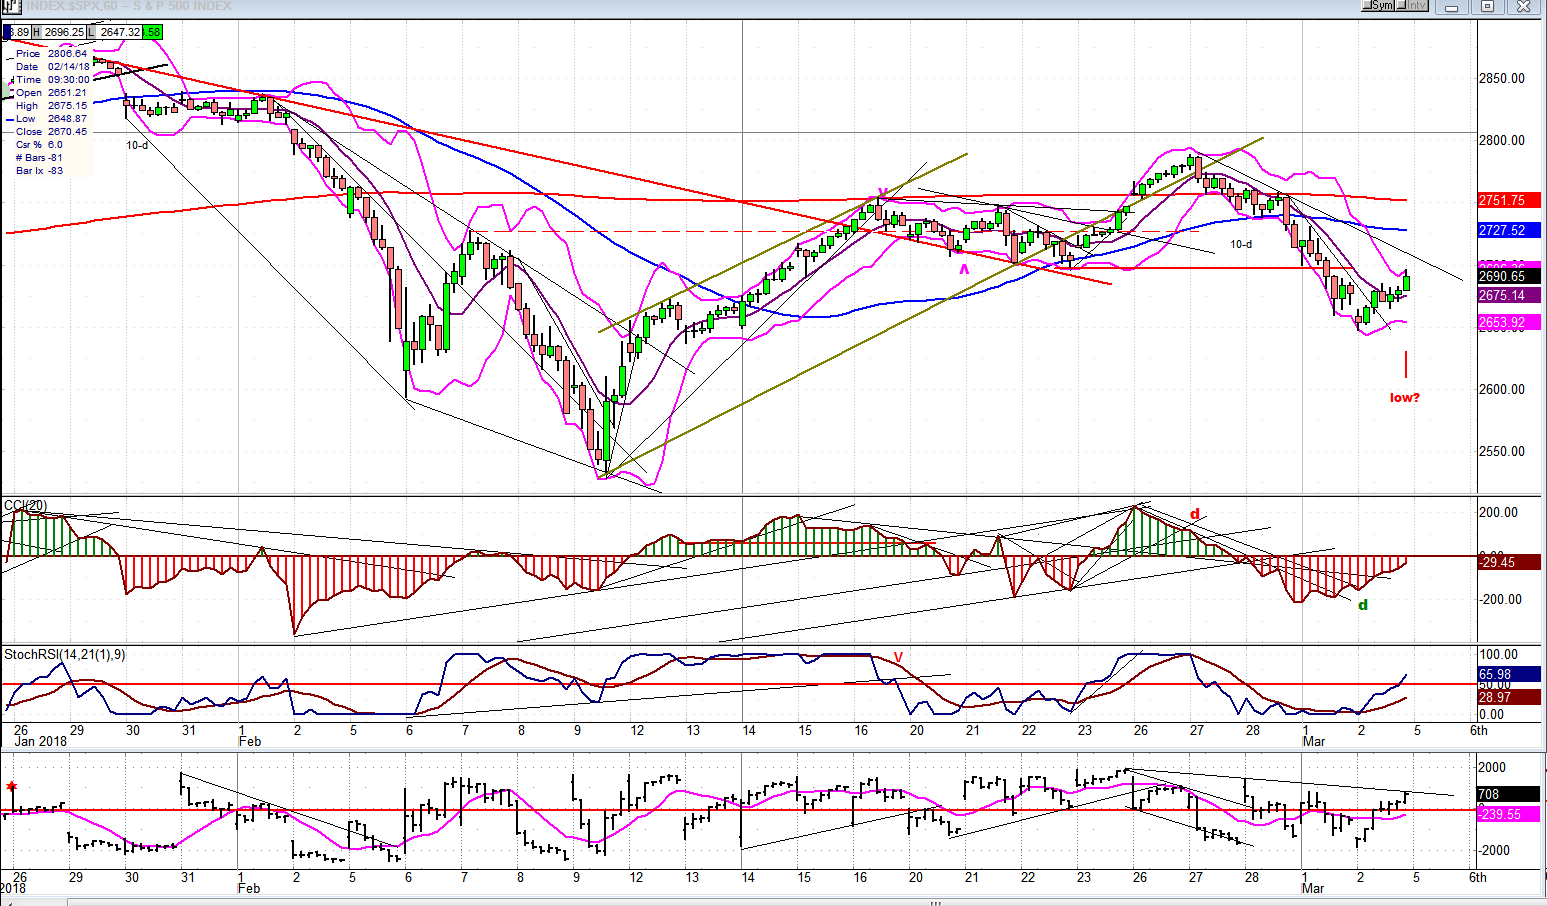
SPX Hourly Chart
It looks as if two small cycles contributed to the low which was formed on Friday: one which came during the first hour, when the index met its 2650** projection, and the other which came an hour or two earlier than expected. This looks like a c-wave, or a wave 2 from the low, depending on whether or not we can get a buy signal in the upper (CCI) oscillator by extending the rally. The other two have already given a buy signal and they are always earlier than the upper one. Actually, the lower one (A/D) will have to break above a trend line to confirm a buy signal. So there is still a little bit of uncertainty which will have to be resolved on Monday morning. Also, the index met the upper band on the BB and started to back off just before the close, but not enough to reverse the trend. And we did close above the middle of the band (the 9hr-MA) which is bullish. Also, we have only broken one price downtrend line and will have to break above the other to get a confirmed reversal; so it seems that there is a little more work to do.
** for my P&F chart, I use a 10X reversal. Therefore, all prices are rounded to 10-point moves.
From the first hour low to the last hour high, we rallied almost 50 points which should entitle us to a little consolidation before moving higher, but the market has been so volatile that large moves are more the norm than the exception, and they do not necessarily mean that we need to correct or consolidate immediately. However, in addition to the reasons for consolidating that were mentioned, we have also reached the level of the previous low (red horizontal line) which could offer some resistance. Again, we need to see what Monday’s opening brings before taking the analysis too far and suggesting that we are ready to extend the move right away.
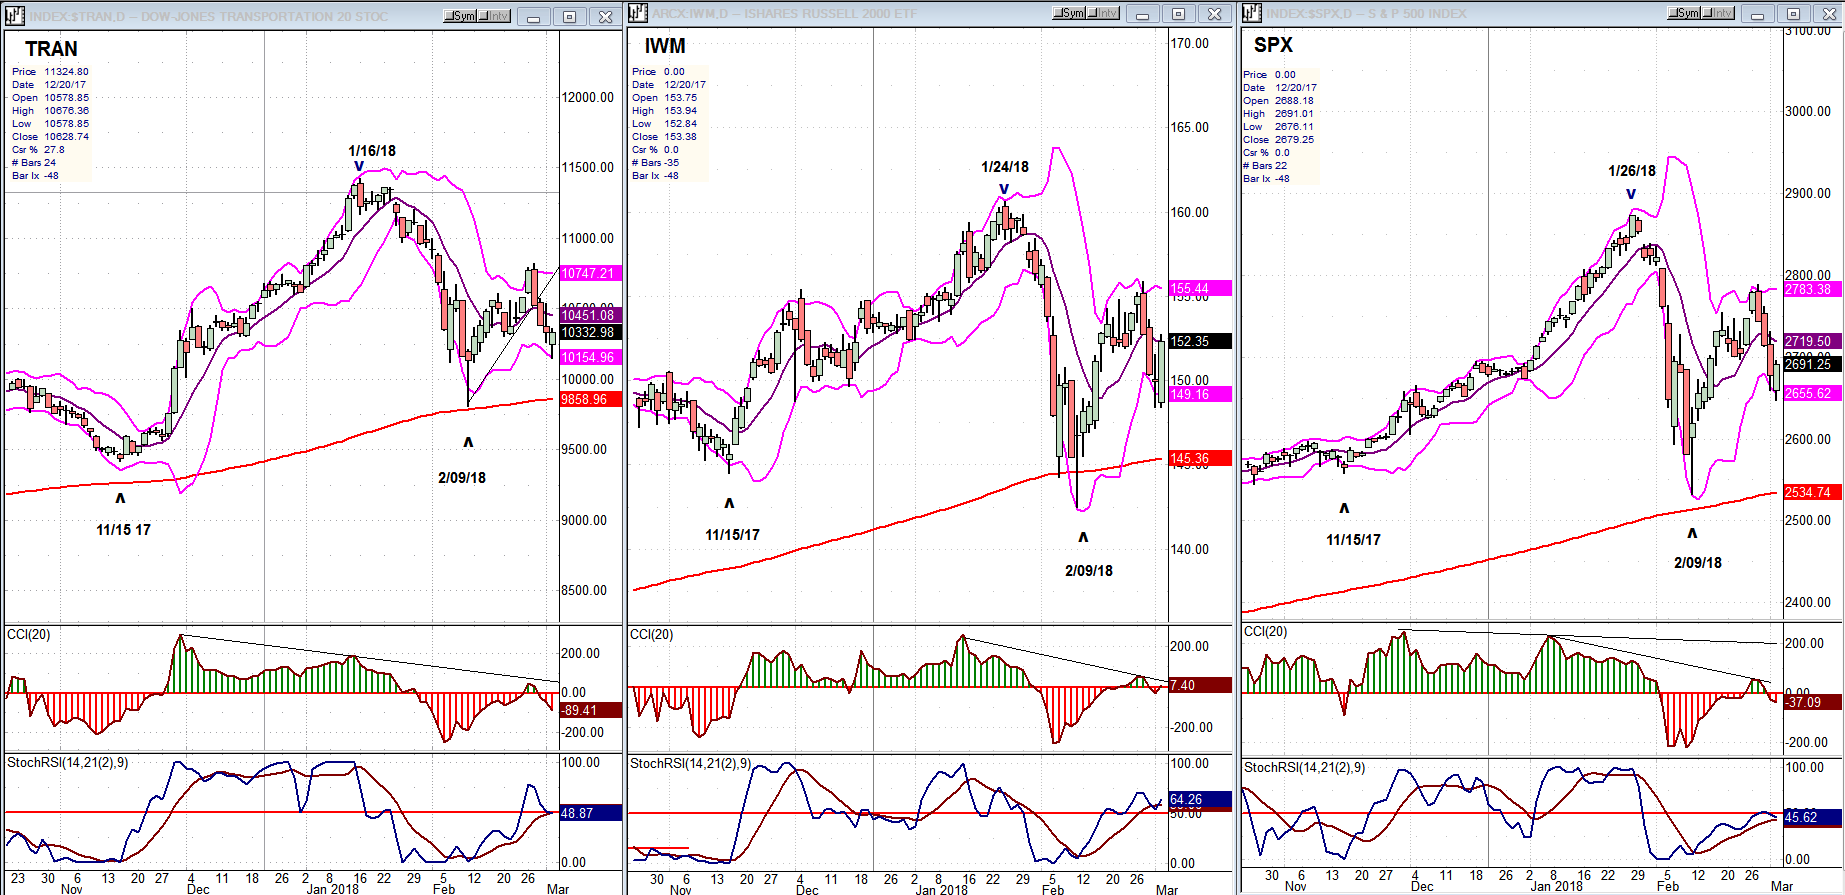
TRAN, IWM, SPX (Daily Charts)
This week, I am comparing the charts of the SPX to that of the TRAN and IWM to see if the last two give us advance notice when a reversal is about to occur. In 2007, TRAN topped several months ahead of the SPX. IWM also did, but by a shorter time span. This propensity to warn of a decline in the SPX has recently been replicated at the intermediate level. While SPX made its high on 1/26/18, IWM topped two days earlier, on 1/24, and TRAN a full week earlier, on 1/16. Since there appears to be some consistency on the part of these two indices to be canaries for an important SPX high, it behooves us to keep a close watch on their behavior in the future.
(Early warning does not apply to the lows; only the highs.)
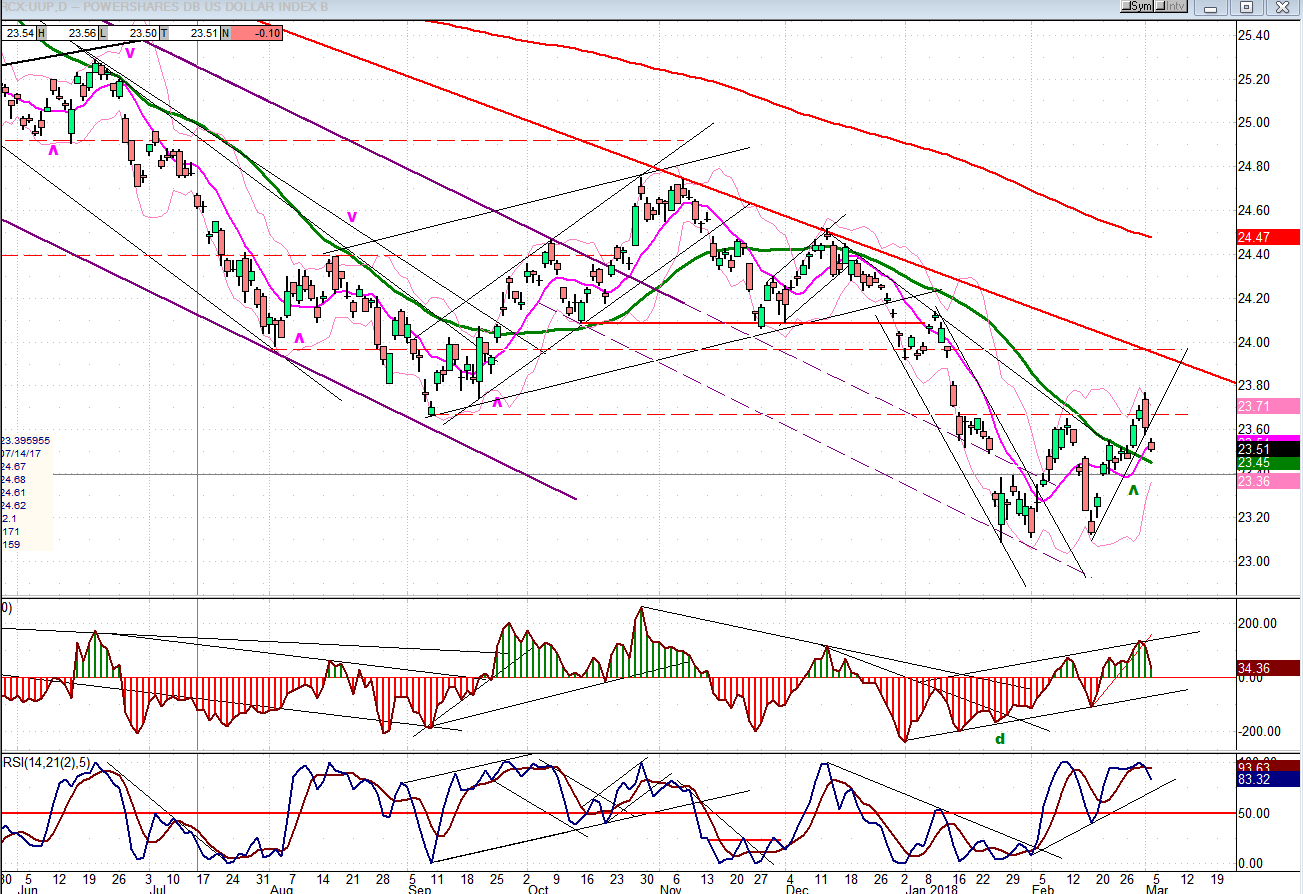
UUP (Dollar ETF)
In the last letter, I mentioned that UUP’s trend appears to be generally regulated by its 30-DMA. After a brief consolidation in its short-term uptrend, UUP broke above the 30-DMA and had a 3-day surge to extend its rebound after retesting its short-term low. It could not sustain it, and retraced immediately, but appears to be holding above the 30-DMA. Let’s see for how long! Especially since UUP’s behavior of late has had an influence on the action of GDX.
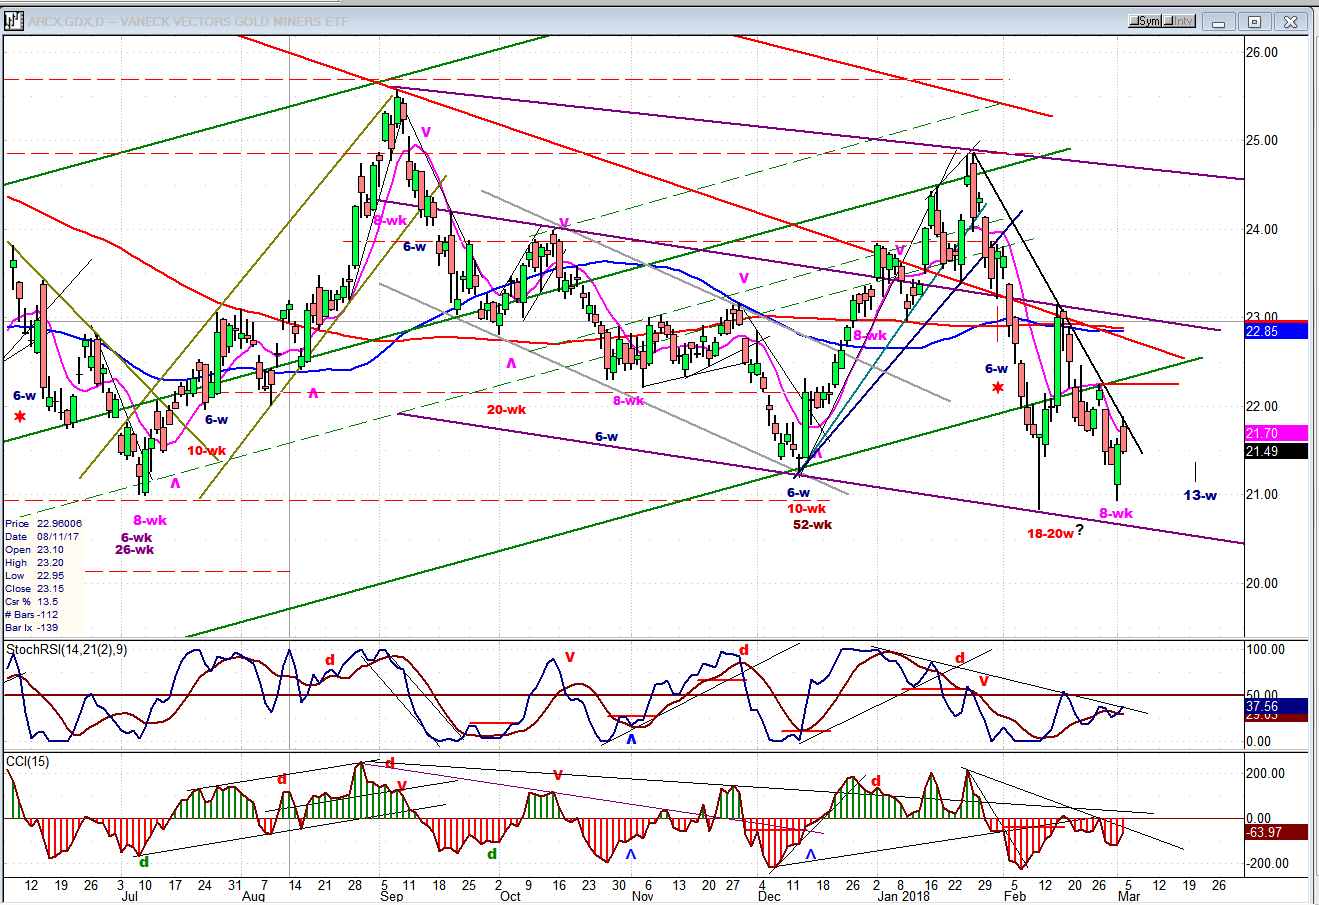
GDX (Gold Miners ETF)
GDX observed its 8-wk cycle low and rebounded, but was stopped by a steep downtrend line and pulled back. If it breaks through (depending on what happens with UUP) it will be stopped again by resistance at the former short-term high. It is likely that it will take advantage of the next 13-wk cycle low to consolidate and form a base which will serve as a launching pad for the next rally.
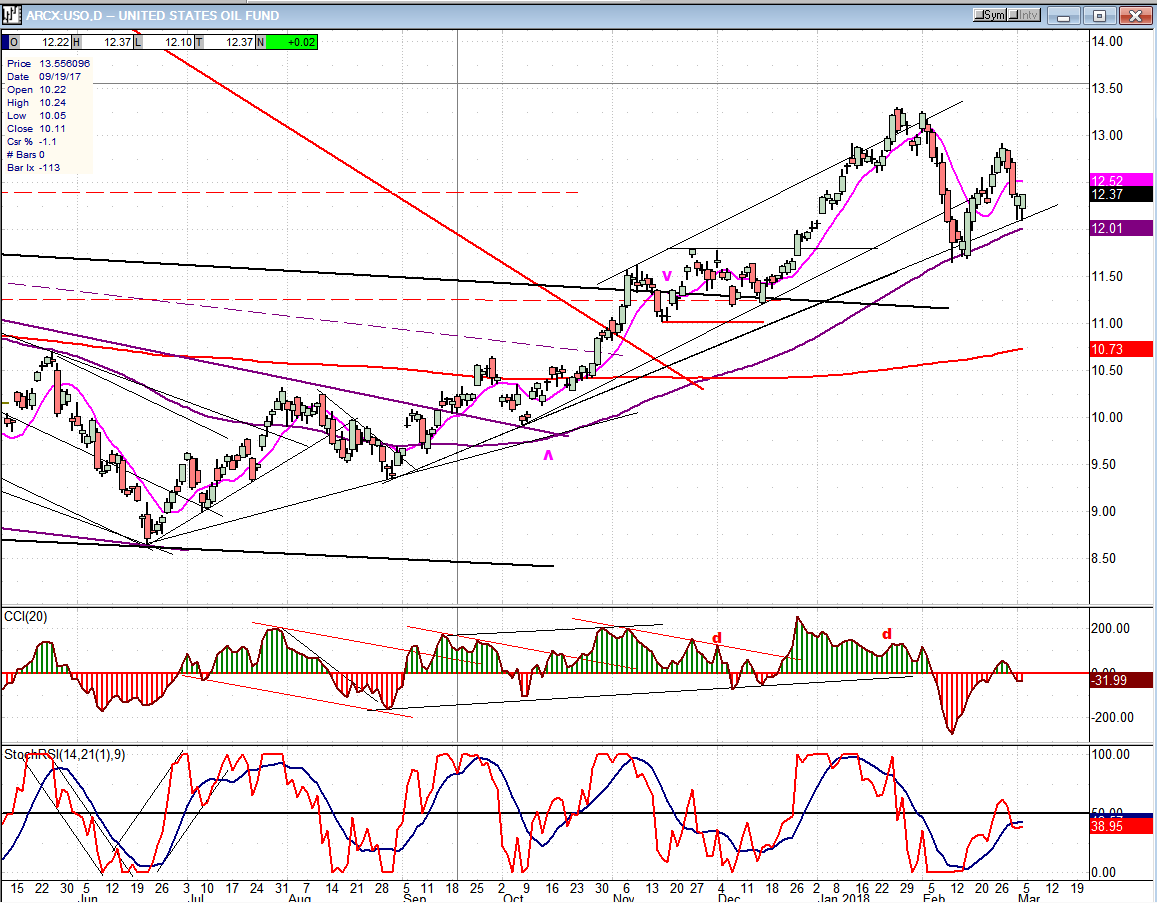
USO (United States Oil Fund)
USO is undergoing a well-deserved consolidation after a strong rally off its low. On the first pull-back, it found support on its trend line and the 89-DMA. A good bounce from that support has been followed by a retest of the trend line. The action is constructive and should lead to additional progress toward a good projection target of about 17.00. Even if USO were to continue pulling back and make a slightly lower low, this could be considered an a-b-c consolidation pattern before the uptrend resumes.
Summary
After extending its recovery to 2789 and pulling back, SPX is again at another crossroad where I must decide on its next path. The bullish choice could take it to a retest of its high of 2872, while additional weakness next week could resume the decline and lead to a retest of its low of 2532.
*********
FREE TRIAL SUBSCRIPTON
With a trial subscription, you will have access to the same information that is given to paid subscribers, but for a limited time period. I think you will find that knowing how far a move can carry is one of the most useful benefits of this service, whether you are a trader or an investor -- especially when this price target is confirmed by reliable indicators which give advance warning of a market top or bottom. Furthermore, cycle analysis adds the all- important time element to the above price projections.
For a FREE 4-week trial, further subscription options, payment plans, and for general information, I encourage you to visit my website at www.marketurningpoints.com.
The above comments about the financial markets are based purely on what I consider to be sound technical analysis principles. They
represent my own opinion and are not meant to be construed as trading or investment advice, but are offered as an analytical point of view which might be of interest to those who follow stock market cycles and technical analysis.
share
share
share
share
share

When Andre Gratian was a stock broker years ago, a friend introduced him to technical analysis of the market. Consequently, it is not an exaggeration to say that Andre fell in love with this approach! Ever since then, it has become an increasingly important part of his professional life. Gratian has studied the works of Wyckoff, Edwards & Magee, Edward J. Dewey (cycles) and many others. However, one of my most profitable undertaking has probably been to study Point & Figure charting, which he finds invaluable in analyzing stocks and indices. If he were restricted to one methodology, this is the one that he would choose. This well-rounded background has given him what he feels to be a special insight into the stock market, facilitating the recognition of meaningful patterns and the ‘turning points’ in all trends, whether they be short or long term. Andre feels very comfortable discussing the stock market and passing on meaningful information to others. His subscribers include individuals and money managers throughout the world. Moreover, his Newsletters are currently published on several financial sites, here and abroad.


