Technical Analysis Of The Markets


Current Position of the Market
SPX: Long-term trend – The bull market is continuing with a top expected in the low 3000s.
Intermediate trend – The intermediate correction from 2872 could continue until mid-May, but is mostly behind us.
Analysis of the short-term trend is done on a daily basis with the help of hourly charts. It is an important adjunct to the analysis of daily and weekly charts which discusses the course of longer market trends.
Uptrend Resuming?
Market Overview
Last week, I wrote the following:
“When the rally from the 2533 low overcame the previous short-term high of 2727, it suggested that the SPX recovery could reach as high as the previous top of 2872, or even a little higher, before reversing.”
(For those of you who might have missed it, last week’s letter is available on “the Market Oracle” under “Authors Archives”.)
So far, the market is cooperating. On Friday, spurred by a strong jobs report, SPX was up nearly 50 points, closing the week at 2786. So we appear to be on track for the above forecast; but it could be truncated by some cycles which suggest that a consolidation should take place over the next few weeks. Minor cycle lows are due next week, and larger ones around mid-April. And then, the all-important 40-wk cycle is due in mid-May. So the forecast made above could be altered by some corrective action before we get the all-clear signal for a new high.
In addition, the rally which started on at 2660, on 3/02, is likely to pause around the former high of 2789 (which is now only three points away) or a little higher; especially since we have either filled or are approaching the maximum projection for this rally phase, and negative divergence has appeared on the hourly chart.
On the positive side, the daily indicators have returned to a buy signal, so the bulls appear to be in control for the time being and may not be inclined to give back too much ground over the short-term.
Chart Analysis (These charts and subsequent ones courtesy of QCharts)
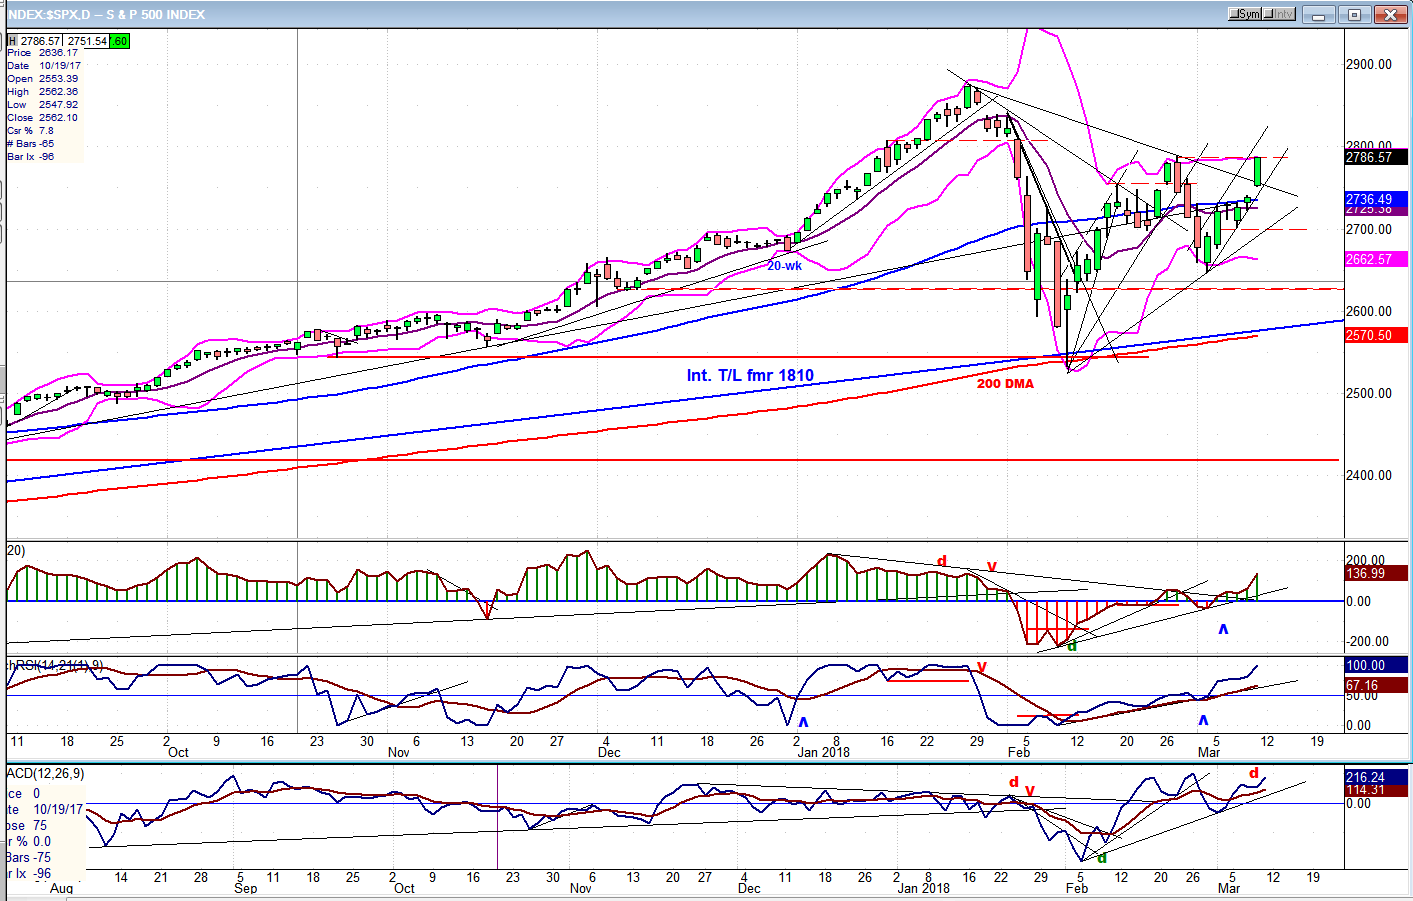
SPX Daily Chart
We have to admit that this is a pretty bullish-looking chart! So why should we not expect prices to continue their upside progress right away? For the reasons that have been stated above in the Market Overview!
The secondary low of 2660 (3/02) now appears to be a high-level retest of the initial low of 2533 (2/09). From a structural standpoint, it also appears to be the start of the next up-phase in the index. Friday’s strong upside momentum is unlikely to stop on a dime, but carry a little higher into early next week before minor cycles take hold. So there does not seem to be much in the way of further progress over the near term; at best, a brief consolidation before we complete the rally phase which started at 2660 -- unless the cycles bottoming (ca.) mid-April have enough pull to cause a deep enough retracement which would prevent the index from making a new high before the pressure from the bottoming 40-wk cycle become dominant.
There is enough uncertainty about what the effects of the cycles bottoming over the next few weeks will be to prevent me from making a longer-term forecast until the larger cycle is out of the way. We’ll just have to confine ourselves to a short-term analysis of the trend until mid-May.
At the end of Friday’s session, the daily momentum indicators gave a confirmed buy signal by rising higher instead of dropping back, which had been a possibility with the index still contained below important resistance at the 2730-35 level. However, the A/D indicator failed to make a new high and to give an all-clear signal. So we’ll just have to see what happens next week.
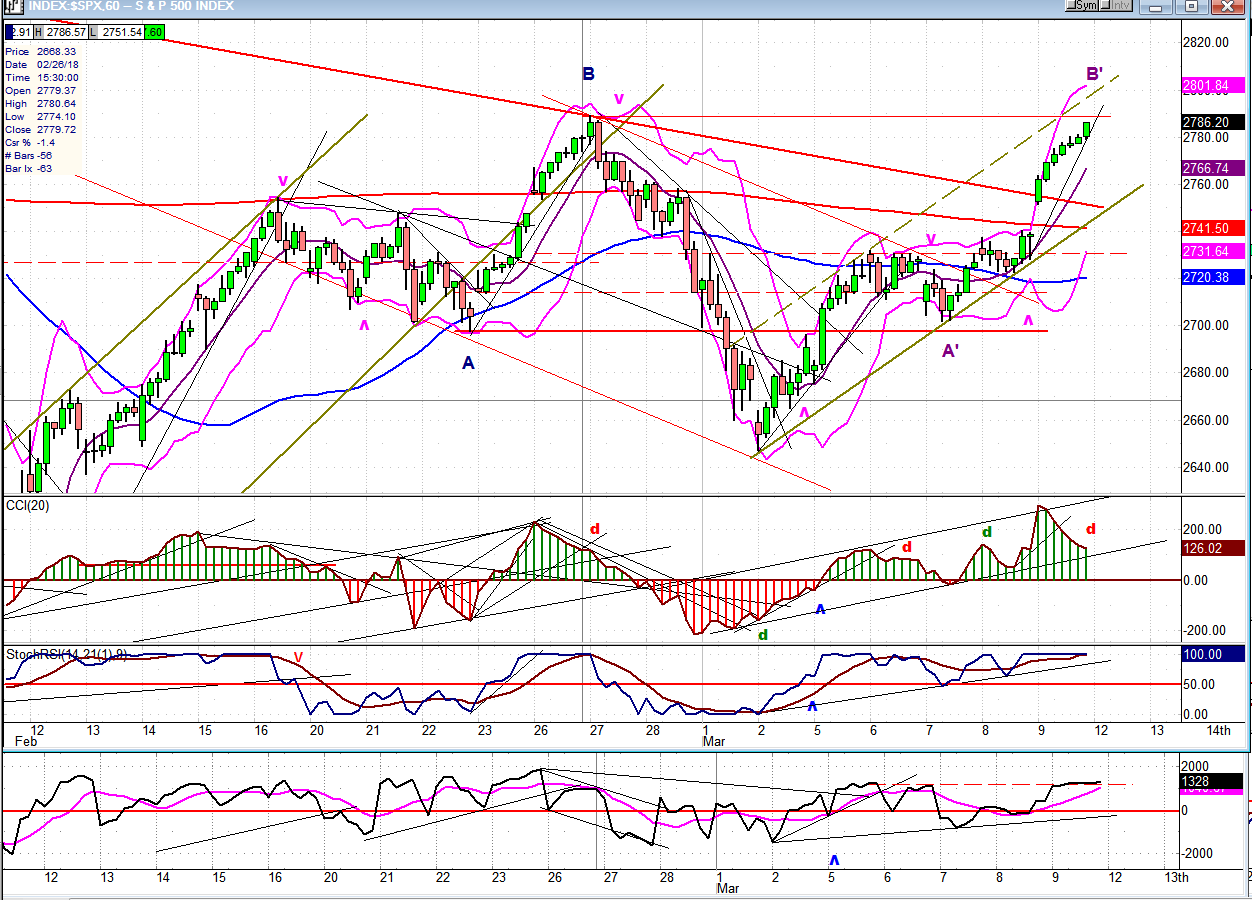
SPX Hourly Chart
Is the market strong, or is it just volatile? That’s a good question! It is very noticeable that segments A-B and A’-B’ are remarkably similar. They both start at about the same price level, find initial resistance at the same level, and then move straight up above that resistance to about the same level. Both denote a lot of strength (?) with an uninterrupted 85-point rally! Of course, the similarity may end on Monday if the current move keeps on going. For all that apparent strength, segment A-B came back down as fast as it went up, with an even larger decline! So, are we about to experience the same market action?
Probably not! An EWT analyst would point out that the A-B segment was most likely the 5th wave of a move that started at 2537, while A’-B’ is probably a 3rd wave from the 2647 low. Maybe! But what about the cycles that lie ahead, especially the 40-week cycle due only two months away? It could produce a severe retracement in the market and mess up whatever pattern we assign to the current market action. This is why I suggest that we confine ourselves to only trying to define the short term until it is out of the way. Longer term, it’s fairly certain that we have not seen the top of the bull market, so we could reasonably expect a new high to be made after the 40-wk cycle has bottomed and propels prices back up after it reverses.
Over the near-term it’s also very likely that whether we go up only three more points on Monday, or 14 more, the current move is now on a short leash. This is made fairly obvious by the negative divergence showing in the CCI along with a far less than super bullish performance in the A/Ds to support a 50-point move! The NASDAQ 100 components that are included in SPX are responsible for the volatility of the index -- not the NYSE components.
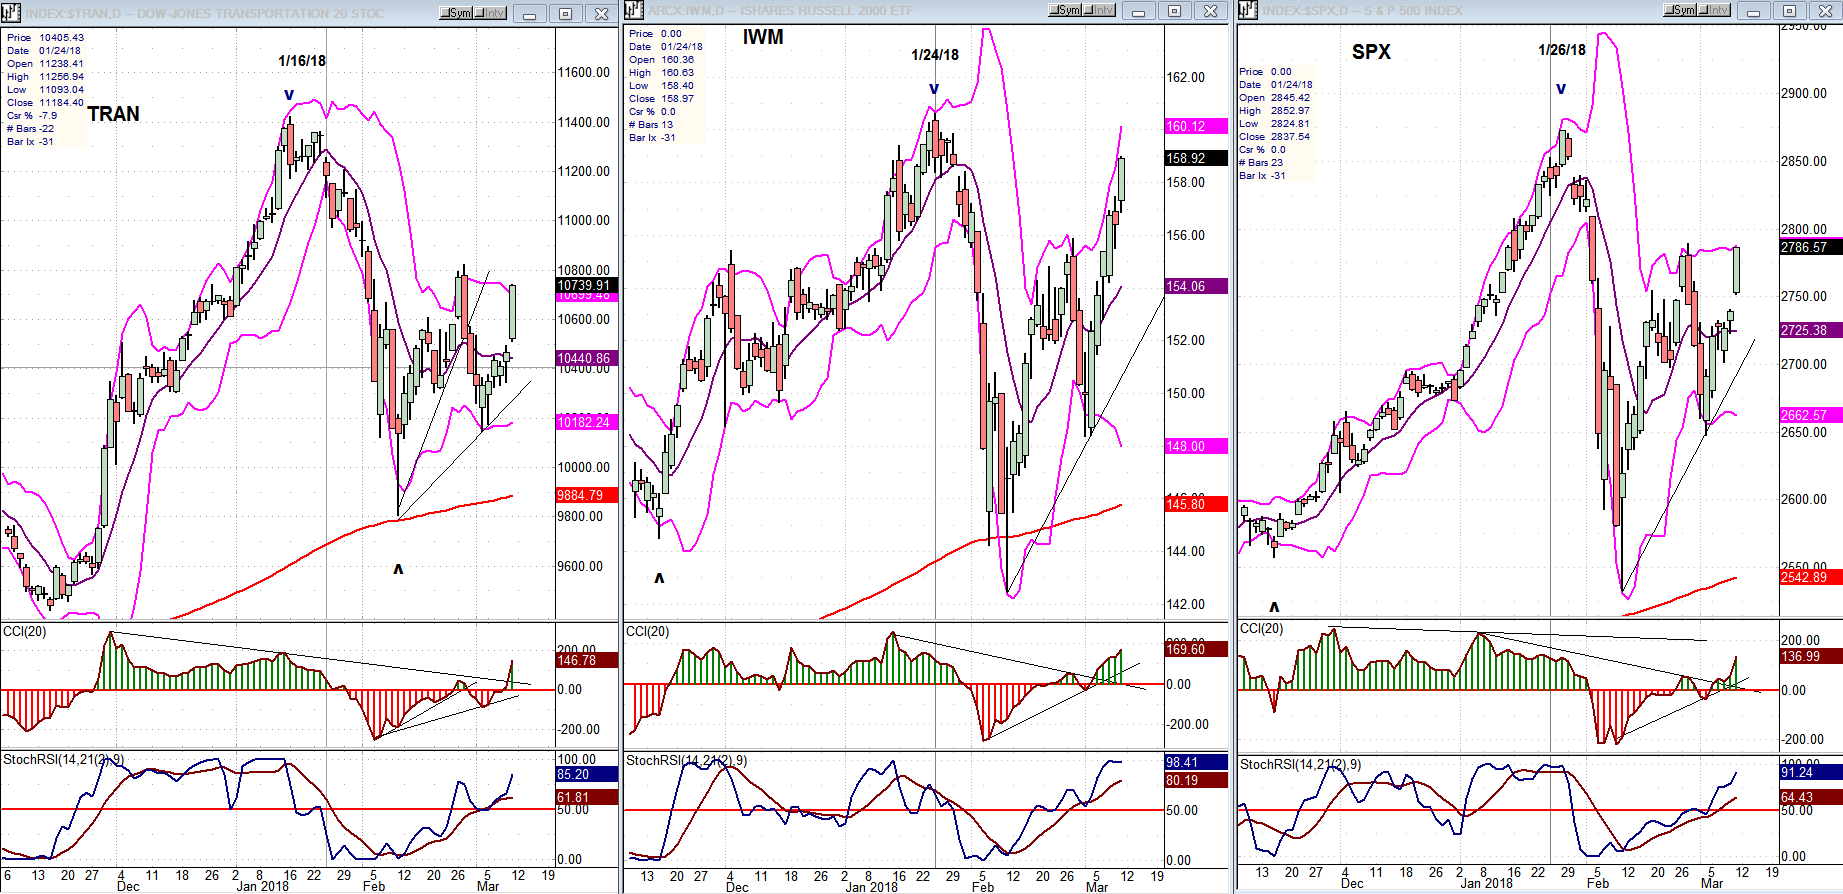
TRAN, IWM, SPX (daily charts)
The purpose of this section is not to analyze each index in great detail, but simply to compare the performance of the first two to the SPX’s to see if they support its current performance, or suggest that the latter is making an important top. I think that last week’s action in IWM says it all for now, and we don’t have to elaborate; although we may want to keep an eye on TRAN which was forced to reluctantly joined the party on Friday.
UUP (Dollar ETF)
UUP has pulled back to the support of the (green) 30-DMA and bounced. A break of that support would at least re-test the former lows and be a factor in causing GDX to start a rally.

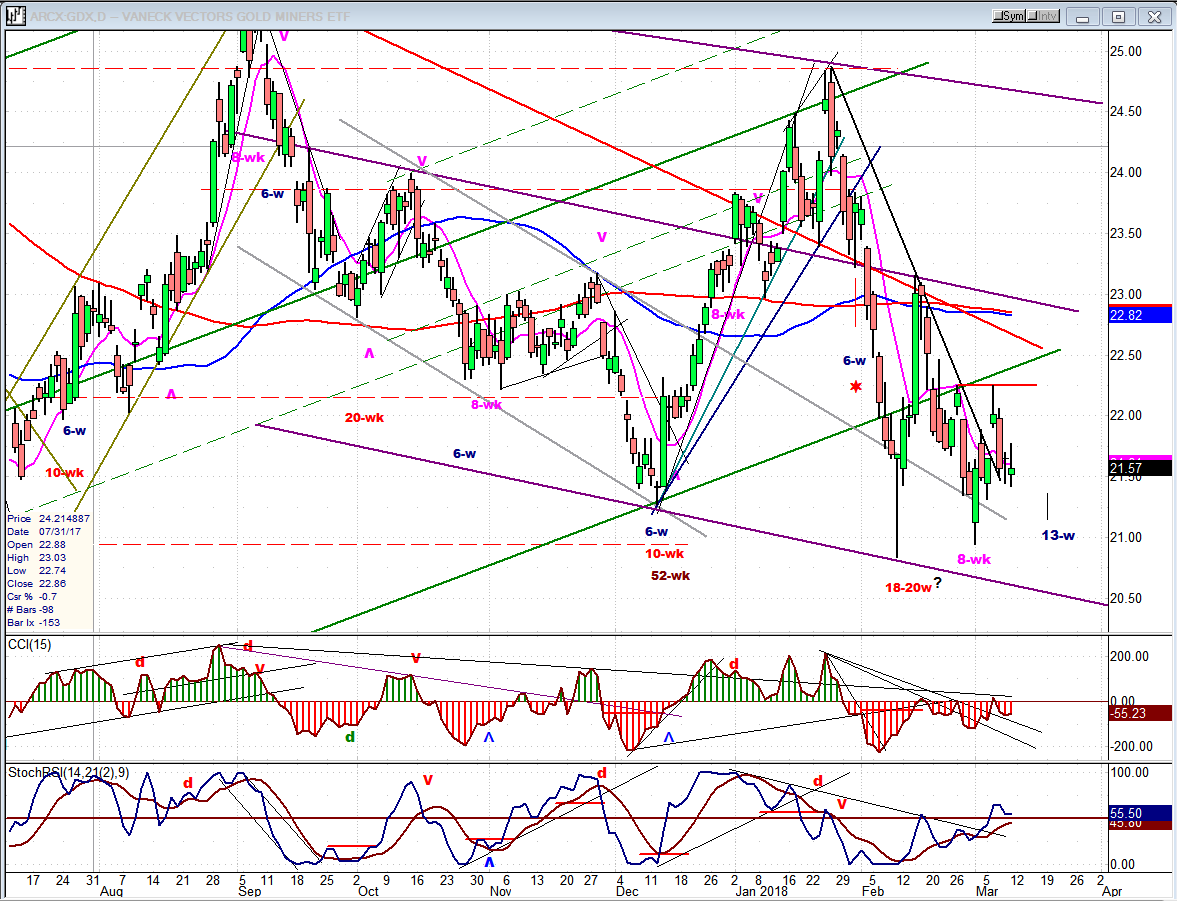
GDX (Gold Miners ETF)
Recently, the action of GDX has been closely tied to that of UUP, and GDX is closely watching for UUP to resume its downtrend. This could come any day, even though the GDX 13-wk cycle low is still (ideally) a few days away. Perhaps a start now, with acceleration a little later?
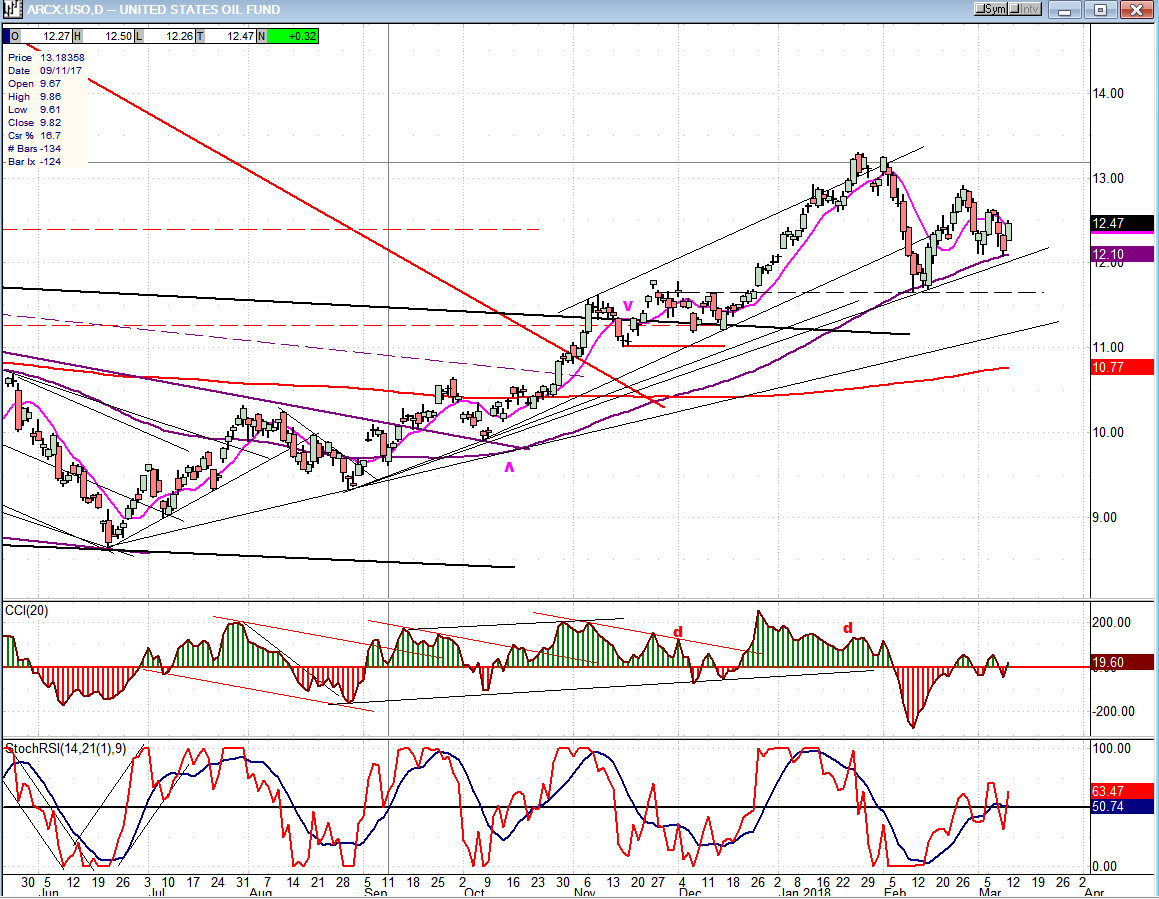
USO (United States Oil Fund)
USO is still correcting and may not be quite finished. Even if it is not, no major correction is expected at this time.
Summary
SPX could end Friday’s strong rally on Monday and start a minor correction. Cycles are, essentially, negatively biased until the middle of May, so the current structure is a little uncertain -- but will define itself over the next few days and weeks.
FREE TRIAL SUBSCRIPTON
With a trial subscription, you will have access to the same information that is given to paid subscribers, but for a limited time period. I think you will find that knowing how far a move can carry is one of the most useful benefits of this service, whether you are a trader or an investor -- especially when this price target is confirmed by reliable indicators which give advance warning of a market top or bottom. Furthermore, cycle analysis adds the all- important time element to the above price projections.
For a FREE 4-week trial, further subscription options, payment plans, and for general information, I encourage you to visit my website at www.marketurningpoints.com.
The above comments about the financial markets are based purely on what I consider to be sound technical analysis principles. They represent my own opinion and are not meant to be construed as trading or investment advice, but are offered as an analytical point of view which might be of interest to those who follow stock market cycles and technical analysis.

When Andre Gratian was a stock broker years ago, a friend introduced him to technical analysis of the market. Consequently, it is not an exaggeration to say that Andre fell in love with this approach! Ever since then, it has become an increasingly important part of his professional life. Gratian has studied the works of Wyckoff, Edwards & Magee, Edward J. Dewey (cycles) and many others. However, one of my most profitable undertaking has probably been to study Point & Figure charting, which he finds invaluable in analyzing stocks and indices. If he were restricted to one methodology, this is the one that he would choose. This well-rounded background has given him what he feels to be a special insight into the stock market, facilitating the recognition of meaningful patterns and the ‘turning points’ in all trends, whether they be short or long term. Andre feels very comfortable discussing the stock market and passing on meaningful information to others. His subscribers include individuals and money managers throughout the world. Moreover, his Newsletters are currently published on several financial sites, here and abroad.
More from Gold-Eagle


