Technical Analysis Of The Markets


Gold

Short-Term Update:
As we suggested might happen, it looks like we got our wave *c* of .b thrust in the overnight session, as gold reached a high of 1118.00, at the time that this Post was being written!
Our completed wave *b* triangle now looks like:
^a^ = 1046.80;
^b^ = 1113.10;
^c^ = 1071.10;
^d^ = 1109.90;
^e^ = 1092.60, to complete all of wave *b*.
We have also satisfied the minimum requirements for a completed wave *c* as we have traded above the 1113.10 high. With wave *b* being complete at the 1092.60 low, we can provide projections for the end of wave *c*, as follows:
*c* = 0.618*a* = 1119.10;
*c* = *a* = 1135.40;
*c* = 1.618*a* = 1061.90. We doubt this will happen as this type of rally would break the upper red trend line on the attached Daily Gold Chart, which would eliminate the current diagonal triangle formation. Only a major event like a war or other calamity is likely to do that in the short term!
We have already reached the first projected location area of 1119.10, with the current high of 1118.00, but we have no indication at the moment that wave *c* is complete at the current high of 1118.00, but we need to be on guard for the end of wave *c*.
Retracements for the end of wave .b. are:
50% = 1118.60;
61.8% = 1135.80.
With our high of 1118.00, we have reached the 50% retracement level for all of wave .b. We have satisfied all of the minimum conditions for a completed wave .b. at the current high of 1118.00.
The next big event will likely be a drop in wave .c. back to the 1045ish low, but we cannot rule out more burst higher to the 1135 area to complete all of wave *c* and .b..
Note the almost exact same projections for *c*= *a* and the 61.8% retracement of all of wave .b. which both end at about the 1135 area. We might see gold spike to that level, which is about at the location of our upper red trend line on the attached Daily Gold Chart.
A drop now back into the wave *b* triangle formation would suggest that wave *c* and all of wave .b. is complete at the current high of 1118.00
Our current count for wave .b. is:
*a* = 1088.30;
*b* triangle = 1092.60;
*c* thrust higher is next with projections shown above, for end of all of wave .b.
Longer-Term Update:
Watch for the completion of wave .b. and the start of wave .c. lower, which has minimum target of the wave .a. low which is 1045.60.
Active Trading Positions: Long 20 positions, with puts at 1085.00!
Crude Oil
Short-Term Update:
In the overnight session, crude dropped to 29.25, before recovering and reaching a high of 30.83, at the time that this Post was being written.
On the Intraday Chart we do not see an impulsive wave structure from the 27.37 low to the 32.74 low, which could suggest that we are now heading to new lows within the crude market.
The drop from 32.74 to 29.25 is about a 61.8% retracement, with that level being 29.54. At this point the short term direction of crude is clouded and could either make a new high above 32.74 or drop to new lows, as the next big event. Today’s trading should provide us the direction we need.
Long-Term Update:
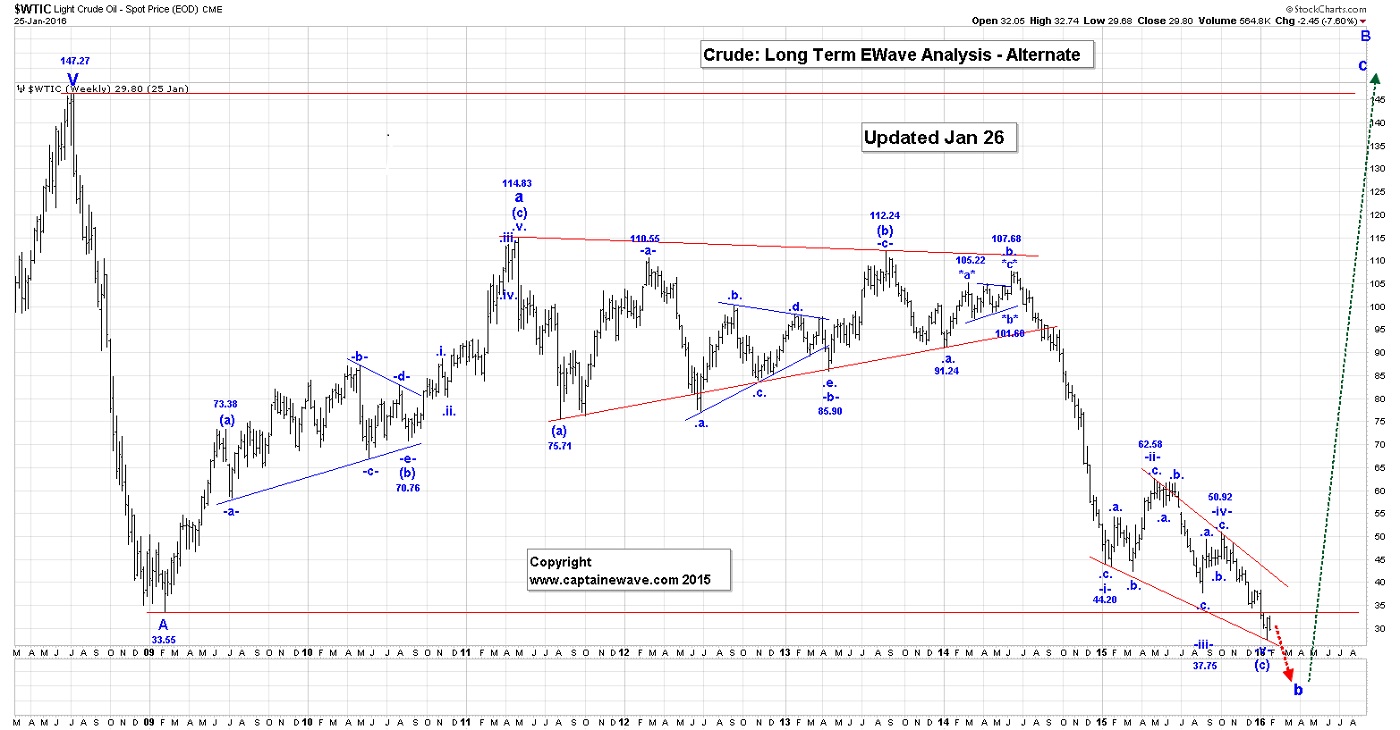
We now think that crude is still going lower, before wave b of B ends, with a drop below $20 as being likely.
Active Trading Positions: Long 15 positions, with 42.00 puts, as stops, plus long 5 positions with 37.00 puts, as stops. We’re going to go long Suncor at 13.05!
S&P500
Short-Term Update:
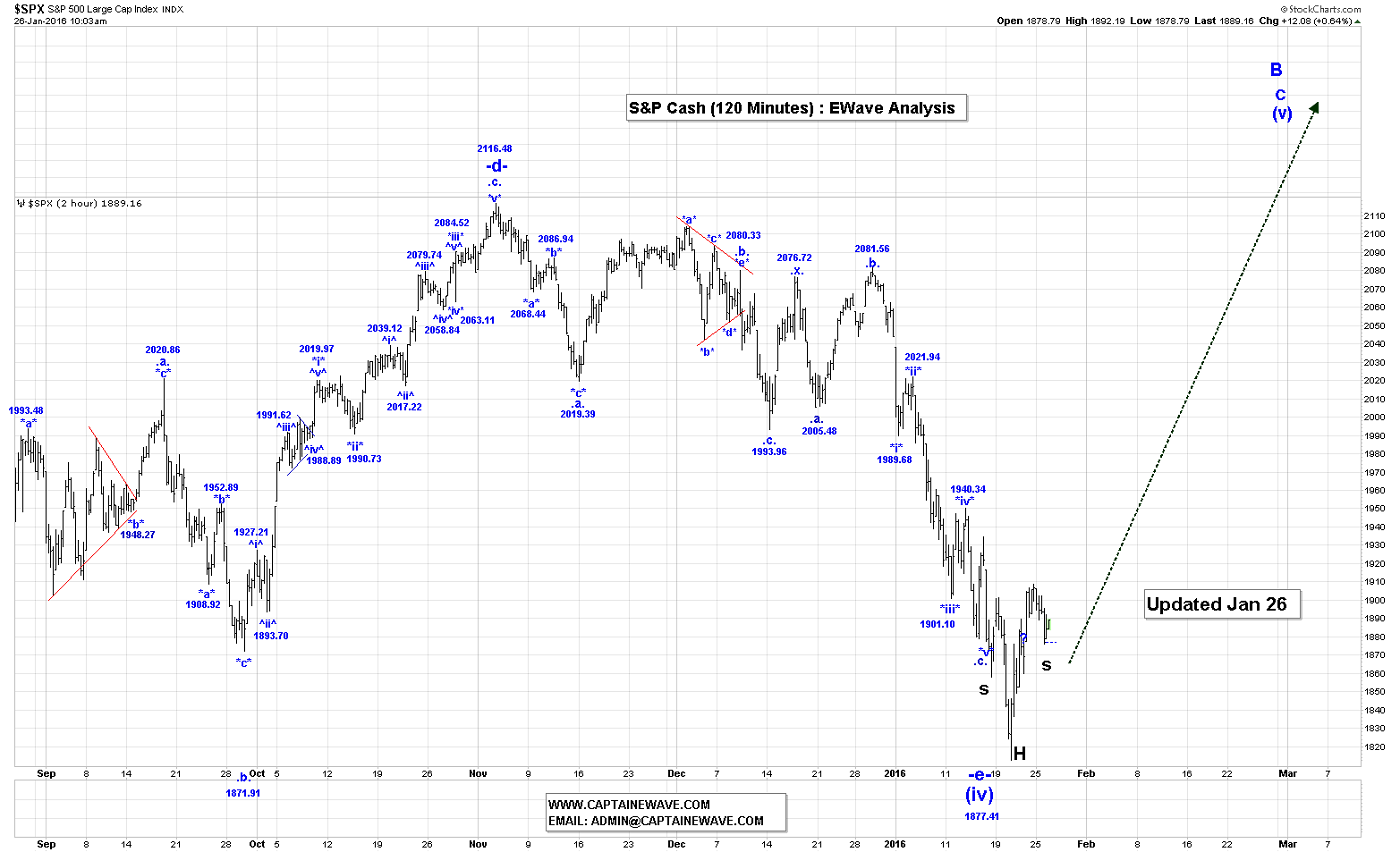
The S&P Futures were up about 3 points in the overnight session.
It is possible that wave .i. is now complete at the 1908.85 high. If that is the case then we should now be dropping in a wave .ii. setback. Retracement levels for wave .ii. are:
50% = 1860.57;
61.8% = 1849.18.
A break below 1812.29 would eliminate our wave (iv) pattern and suggest that the S&P has topped out and is heading substantially lower.
We will go long this market at 1850.00, risking to 1812.00.
Long-Term Update:
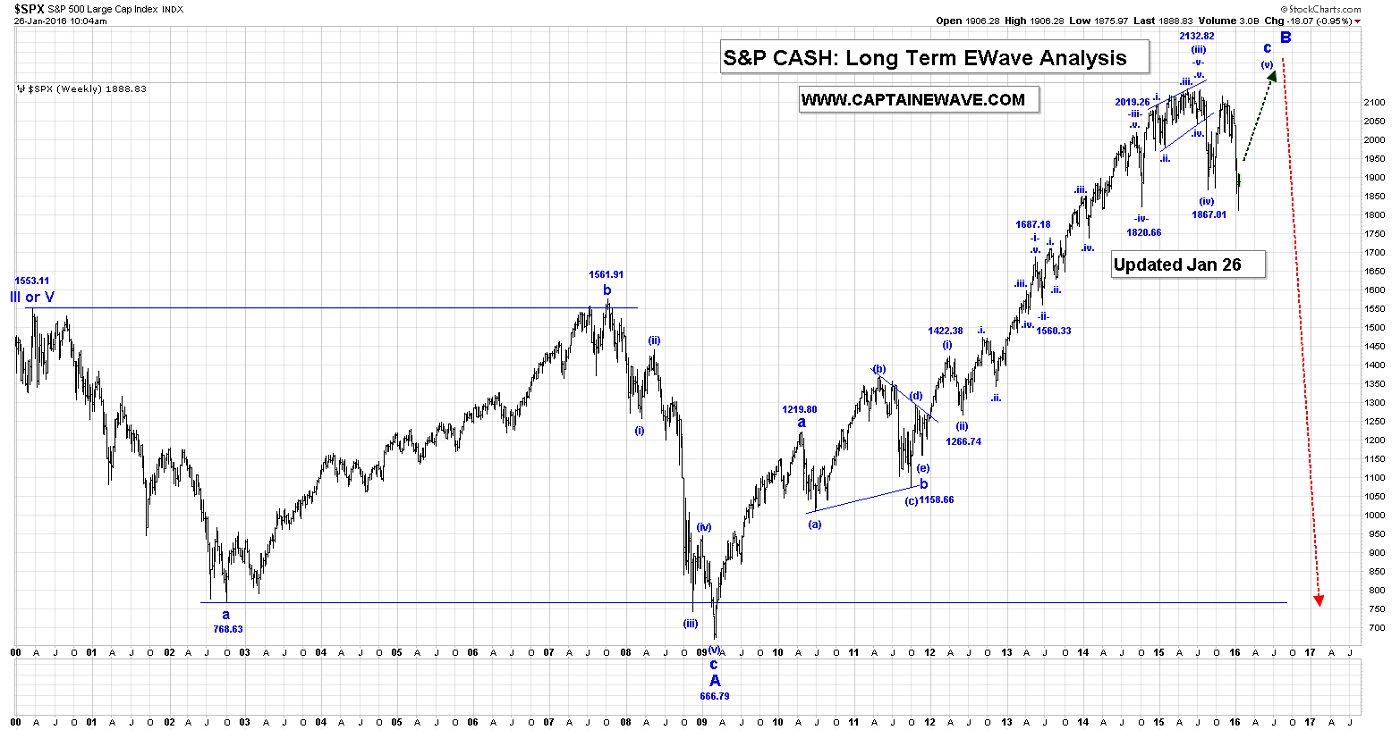
Wave (iv) took a different path then our triangle option, and it now looks like we are heading sharply higher in wave (v), to at least the all time high of 2134.72.
Active Trading Positions: Going long at 1850.00, risking to 1812.00!
USDX
Short-Term Update:
The USDX had gone dead over the last couple of trading sessions. The market continues to churn, but what is clear on the Intraday Chart is that the rally from 92.21 low is corrective.
Our wave .iv. triangle was eliminated this week as our thrust to 99.89, was reversed, but the market had not really moved lower. We are now thinking that our wave .iv. triangle could be extending and in that case we would have the following count:
*a* = 97.21;
*b* = 99.89, if complete;
*c* drop is next;
*d* and *e to go.
A move above 99.89, would indicate that wave *b* is still underway. If wave *c* has begun then we cannot drop below the 97.21 wave *a*, for this current triangle count to remain valid.
We are short this market but will raise our stop to 100.59, just in case wave *b* is not complete the 99.89 high.
Long-Term Trading Update:
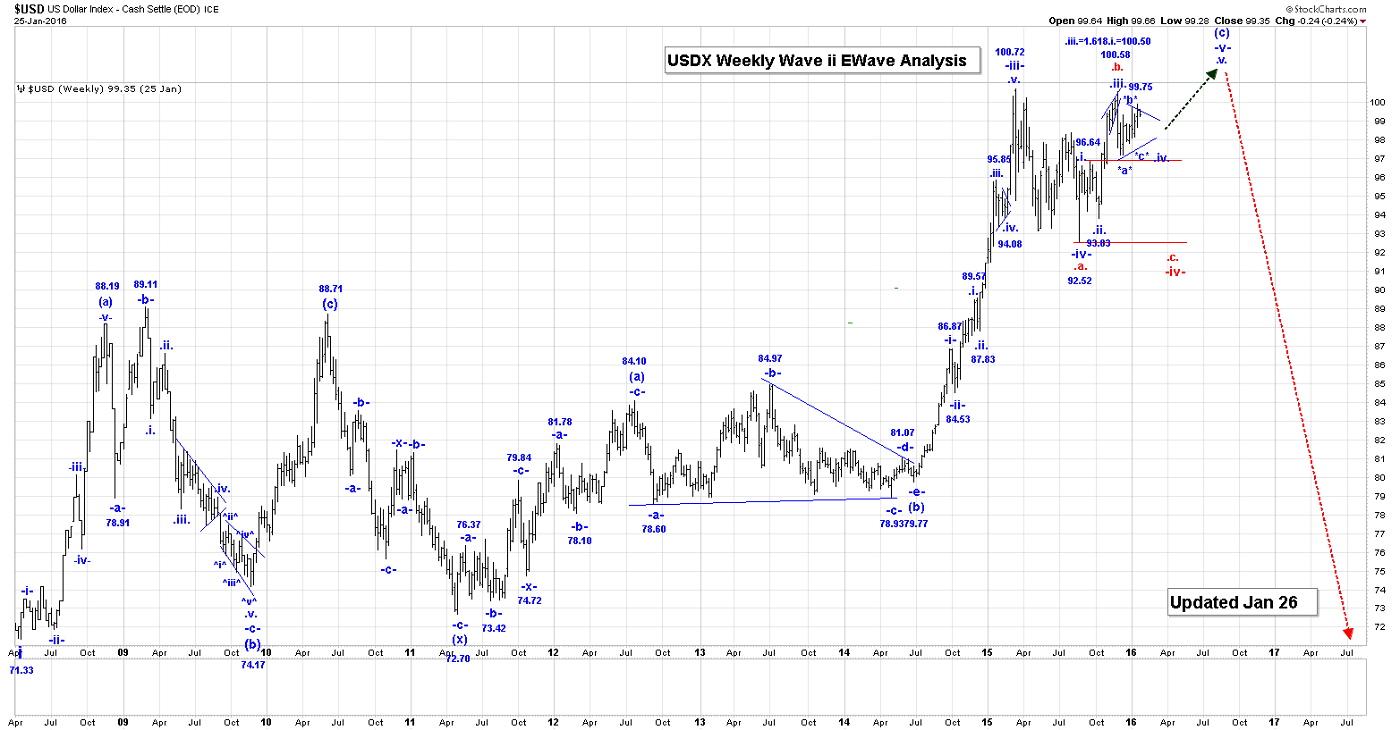
It now looks like our wave .iv. Triangle is extending and will likely churn for another couple of weeks.
Our current count for all of wave -v- is:
.i. = 96.64;
.ii. = 93.83;
.iii. = 100.58;
.iv. triangle is still underway.
.v. rally to go to at least the 100.71, wave -iii- high.
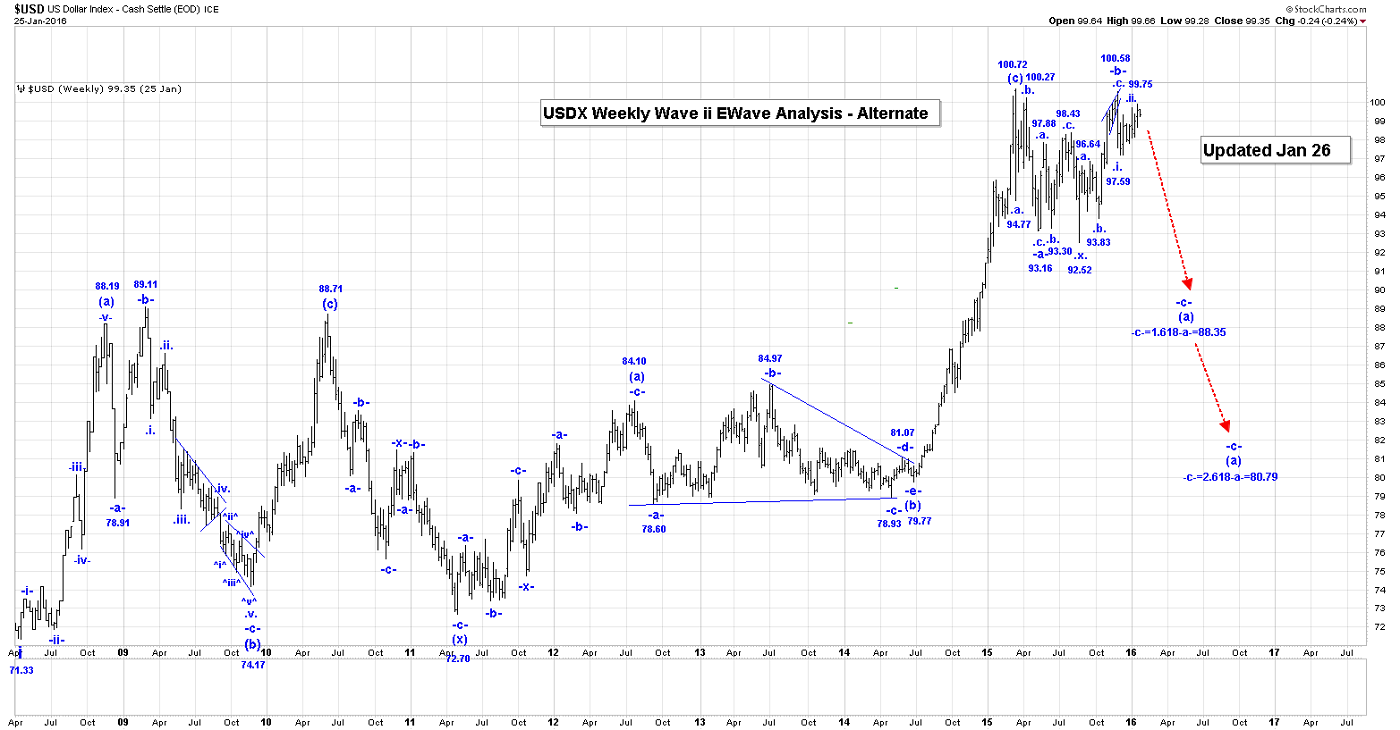
The other much more bearish count is shown on the attached Weekly USDX(Alternate) Chart. In this our second (a), (b), (c) pattern from the wave i low of 71.33, ended at 100.72 and we are now falling in another 3 wave pattern. Within this 3 wave pattern we are working on wave -c-, with projections of 88.35 and 80.79.
All of our alternate counts will become valid if we drop below the 96.64 high.
Active Trading Positions: We short, risking to 100.59!
NATGAS
Short-Term Update:
It looks like our wave *b* triangle ended in the overnight session, and we also got all or some of our expected wave *c* thrust, as we reached a high of 2.214. Our current for all of wave .b. is: (wave .a. ended at 2.045):
*a* = 2.170;
*b* triangle:
^a^ = 2.069;
^b^ = 2.189;
^c^ = 2.082;
^d^ = 2.171, if complete. Wave ^d^ cannot rally above the wave ^b^ high for this triangle formation to remain valid.
^e^ = 2.129 to complete all of the wave *b*triangle.
Projections for the end of wave *c* are:
*c* = 0.618*a* = 2.206
*c* = *a* = 2.254;
*c* =1.618*a* = 2.331
Our retracement levels for wave .b. are:
50% = 2.271;
61.8% = 2.324
The 2.214 high is still short of our 50% retracement level for all of wave .b., so we suspect that wave *c* should move higher to at least the 2.27 level, before all of wave .b. ends.
A drop now back into the wave *b* triangle formation would suggest that wave *c* and all of wave .b. could be complete at the 2.214 high. Upon completion of wave .b. we expect one more drop in wave .c. to at least the wave .a. low of 2.045 to complete all of wave -b-.
Retracement levels for the end of wave -b- are:
50% = 2.089;
61.8% = 1.99
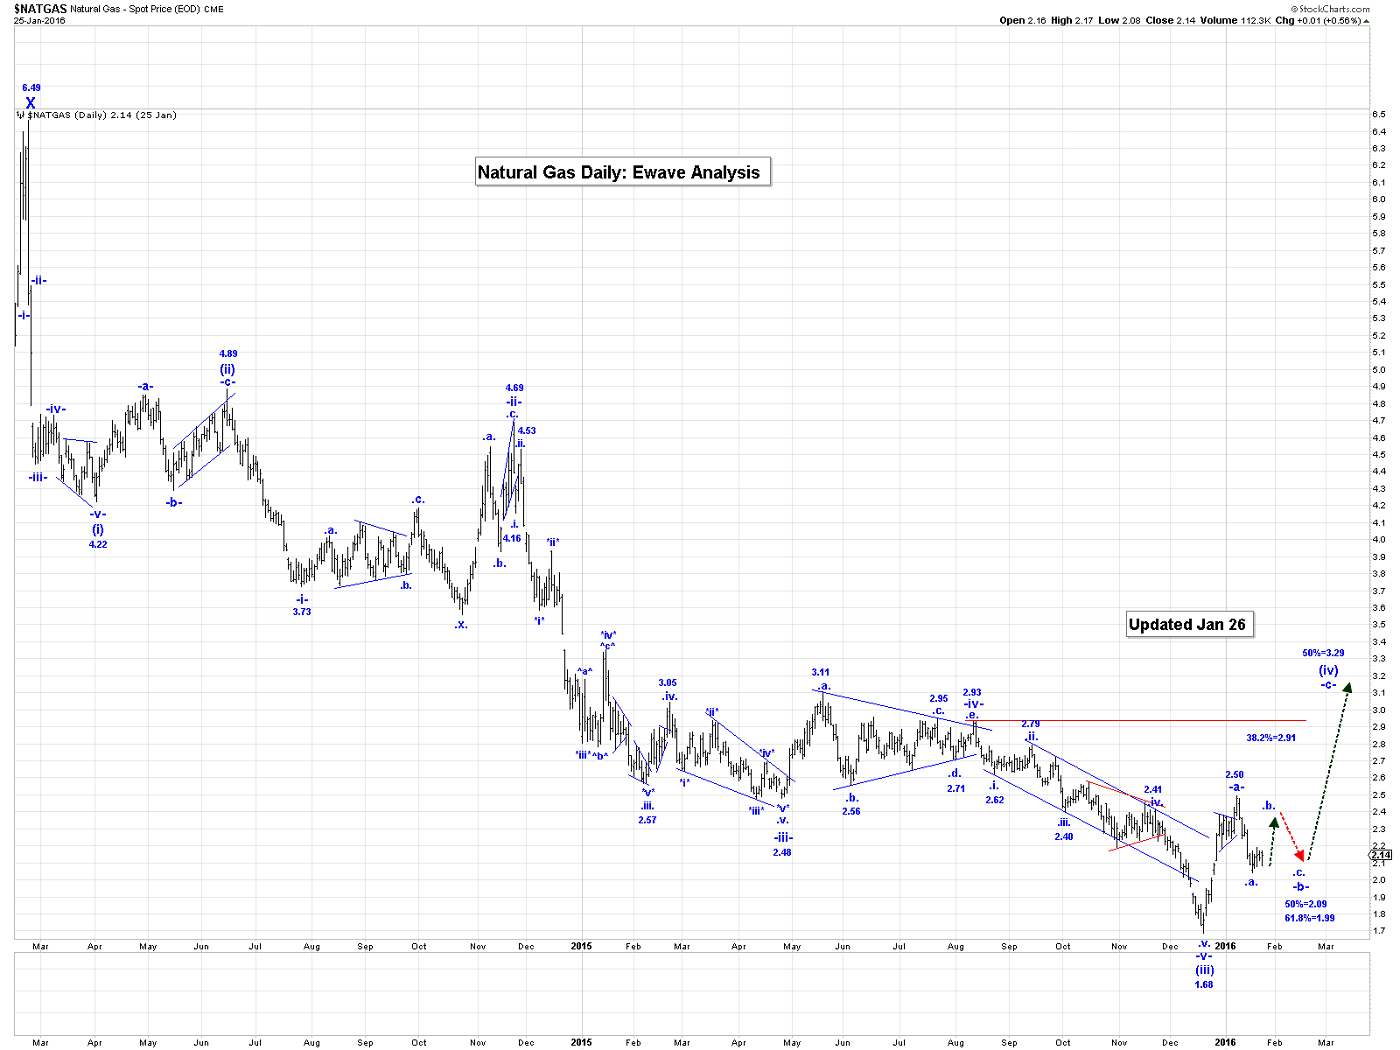
Long-Term Trading Update
Our retracement levels for all of wave (iv):
38.2% = 2.91;
50% = 3.29.
For the time being we will assume that wave (iv) is a simple -a-, -b-, -c- pattern, and within that count we have :
-a- = 2.494;
-b-:
.a. = 2.045, if complete;
.b. rally is underway;
.c. drop to at least the wave .a. low of 2.045, to complete all of wave -b-;
-c- rally to at least the wave -a- high, but more likely to our 38.2%/50% retracement zone shown above.
Active Trading Positions: Long 5 at 2.05, risking to 1.69, but will take profits at 2.29!
HUI/GDX and Selected Gold Stocks
Short-Term Update:
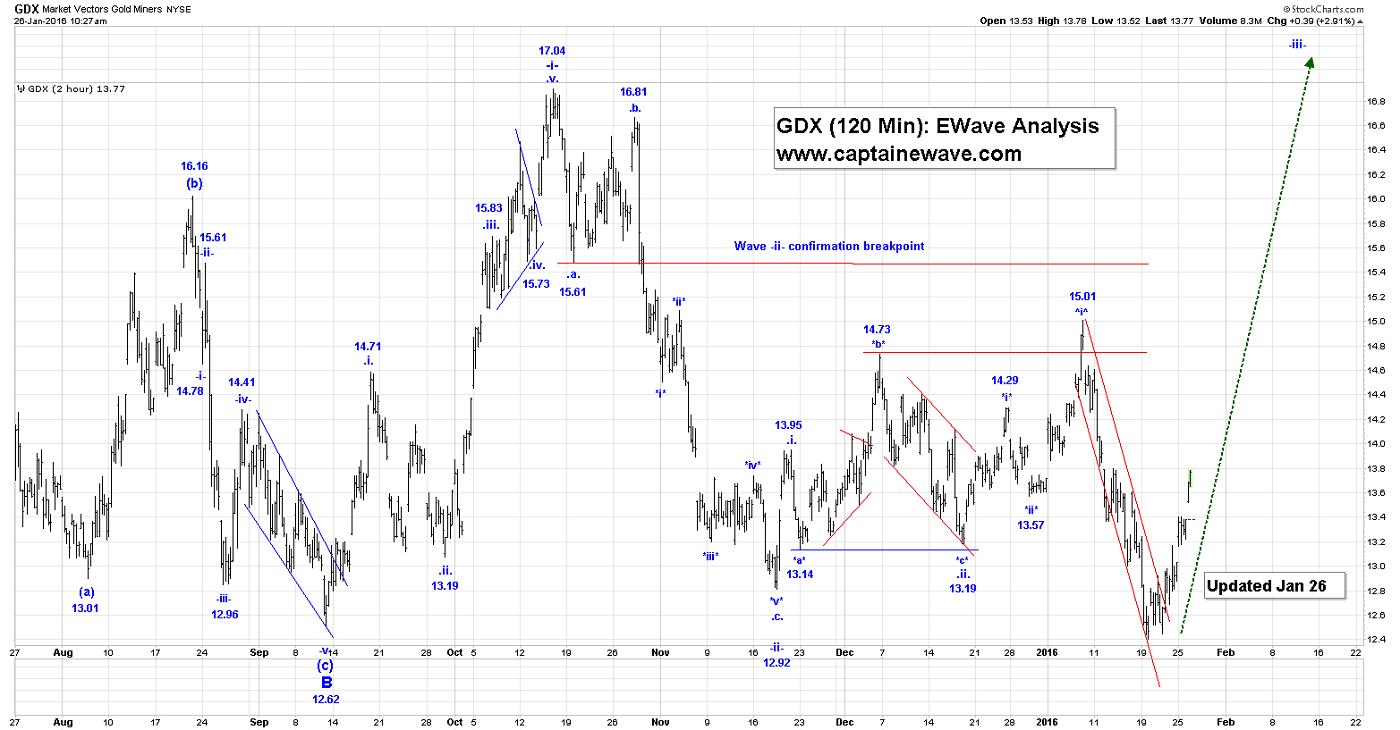
There’s no real change to our outlook here, until we see an impulsive wave structure develop in the GDX.
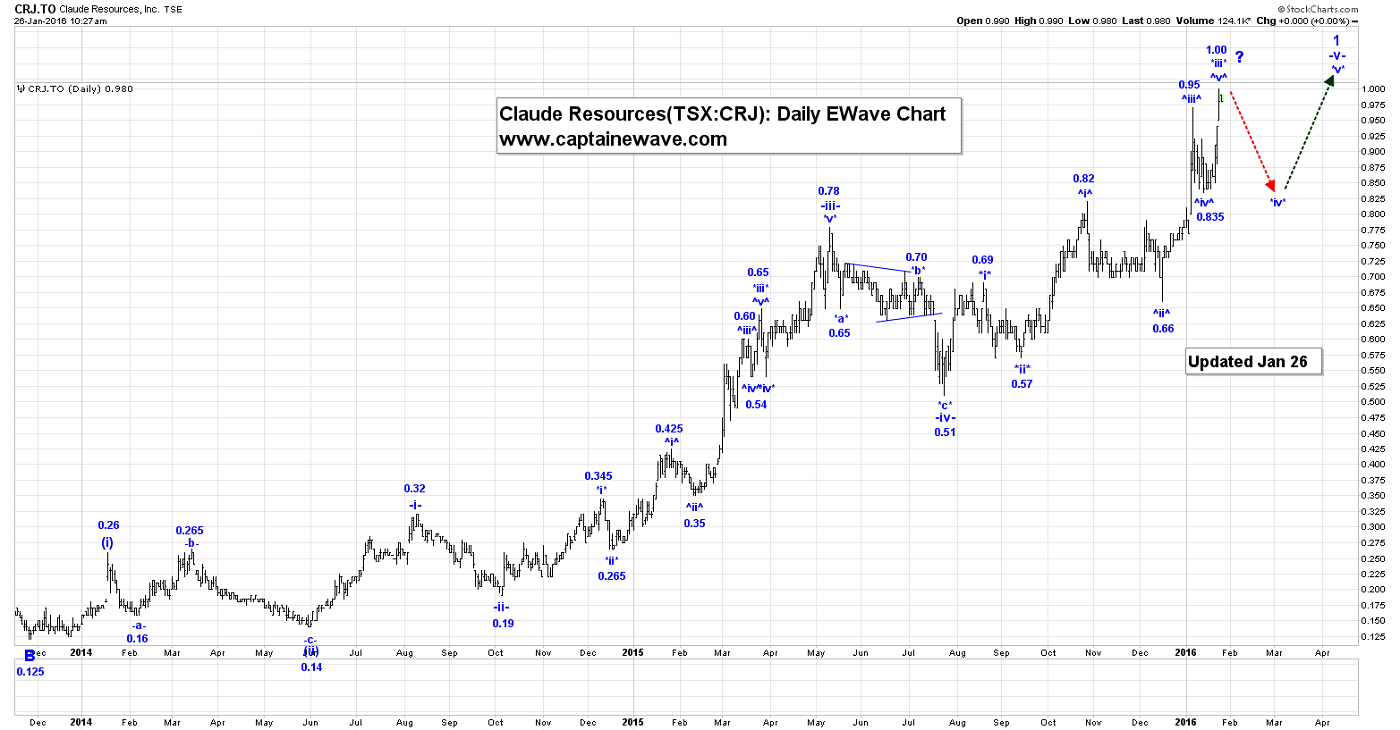
Assuming that the gold rally holds, we should expect higher prices in CRJ and maybe ABX. We are not sure about Kinross. CRJ (Claude Resources) is our bell weather gold stock, and it’s been performing like a stallion over the past few days, and over the past year!


