Technical Analysis Of The Markets


Current Position Of The Market
SPX: Long-term trend – The bull market is continuing with a top expected in the low 3000s.
Intermediate trend – The intermediate correction from 2873 should continue until about early June.
Analysis of the short-term trend is done on a daily basis with the help of hourly charts. It is an important adjunct to the analysis of daily and weekly charts which discusses the course of longer market trends.
Bears Last Stand
Market Overview
The bulls took control on 5/03 and produced a 138-point rally. Is wave 4 over, and have we started wave 5? Maybe, maybe not! In any case, even if we have, the bears still have a final statement to make; and even if they cannot drive the SPX to a new low over the next two or three weeks, they should erase some of the bullish confidence which has now returned. I estimate that there is only about a 15% chance that the 40-week cycle made its low in early May. Last week, I mentioned that this cycle has earned the respect of analysts with its regularity and impact on the market. I believe that its low is still ahead of us and will probably arrive between late May and early June, about a week later than I had originally anticipated. I would also point out that the weekly chart indicators have not yet given a buy signal!
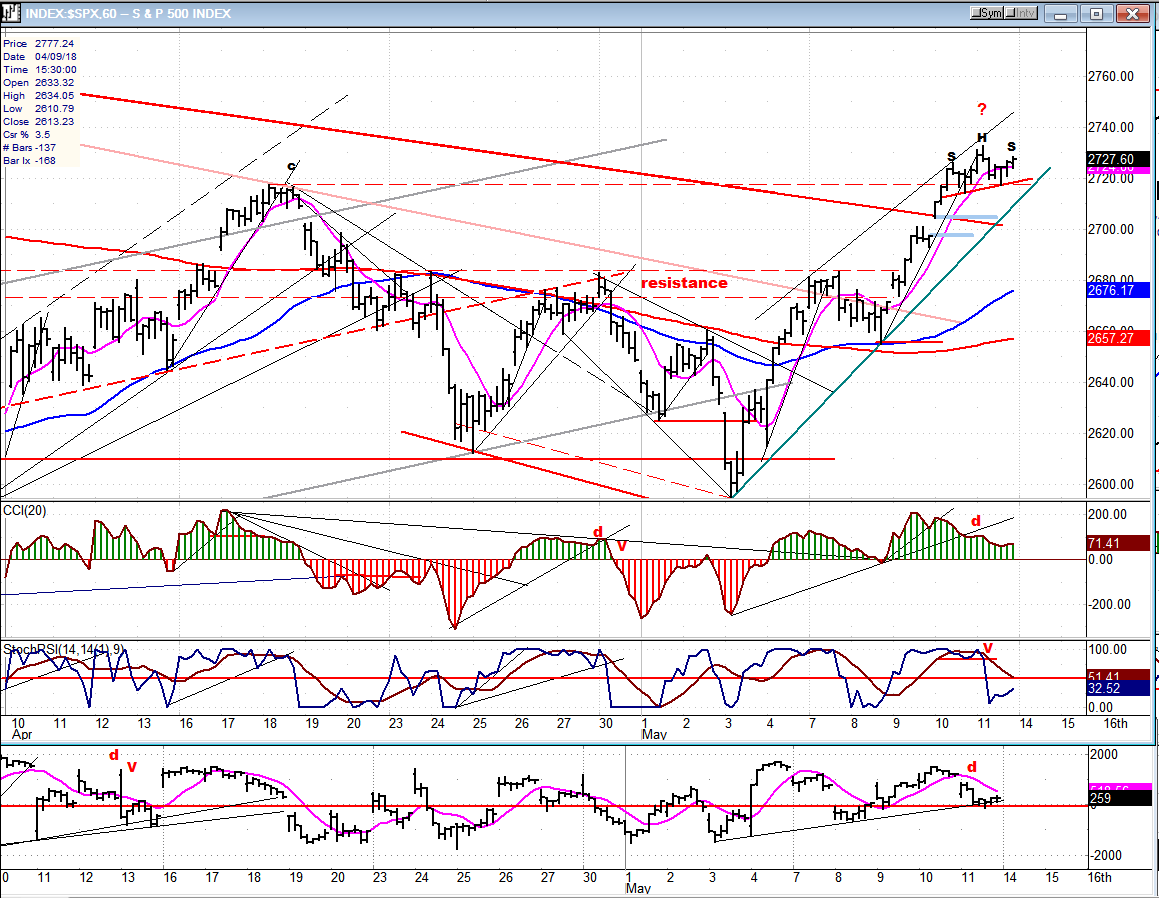
A new low for the correction is not expected, and we may only retest the early May low. In a week or so, I may be able to formulate some sort of price projection, but for now, I don’t have enough data. I suspect that a distribution top will take shape over the next few days and it may already have started. The rally has stalled at the 2730 level and it looks as if a small H&S pattern has formed on the 60m chart. This will be confirmed if we break below the neckline (~2720), and this move would put us outside of the uptrend line as well. Considering the amount of negative divergence which is already showing on the hourly indicators, this looks like a likely prospect for the near-term.
Chart Analysis (These charts and subsequent ones courtesy of QCharts)
SPX Daily Chart
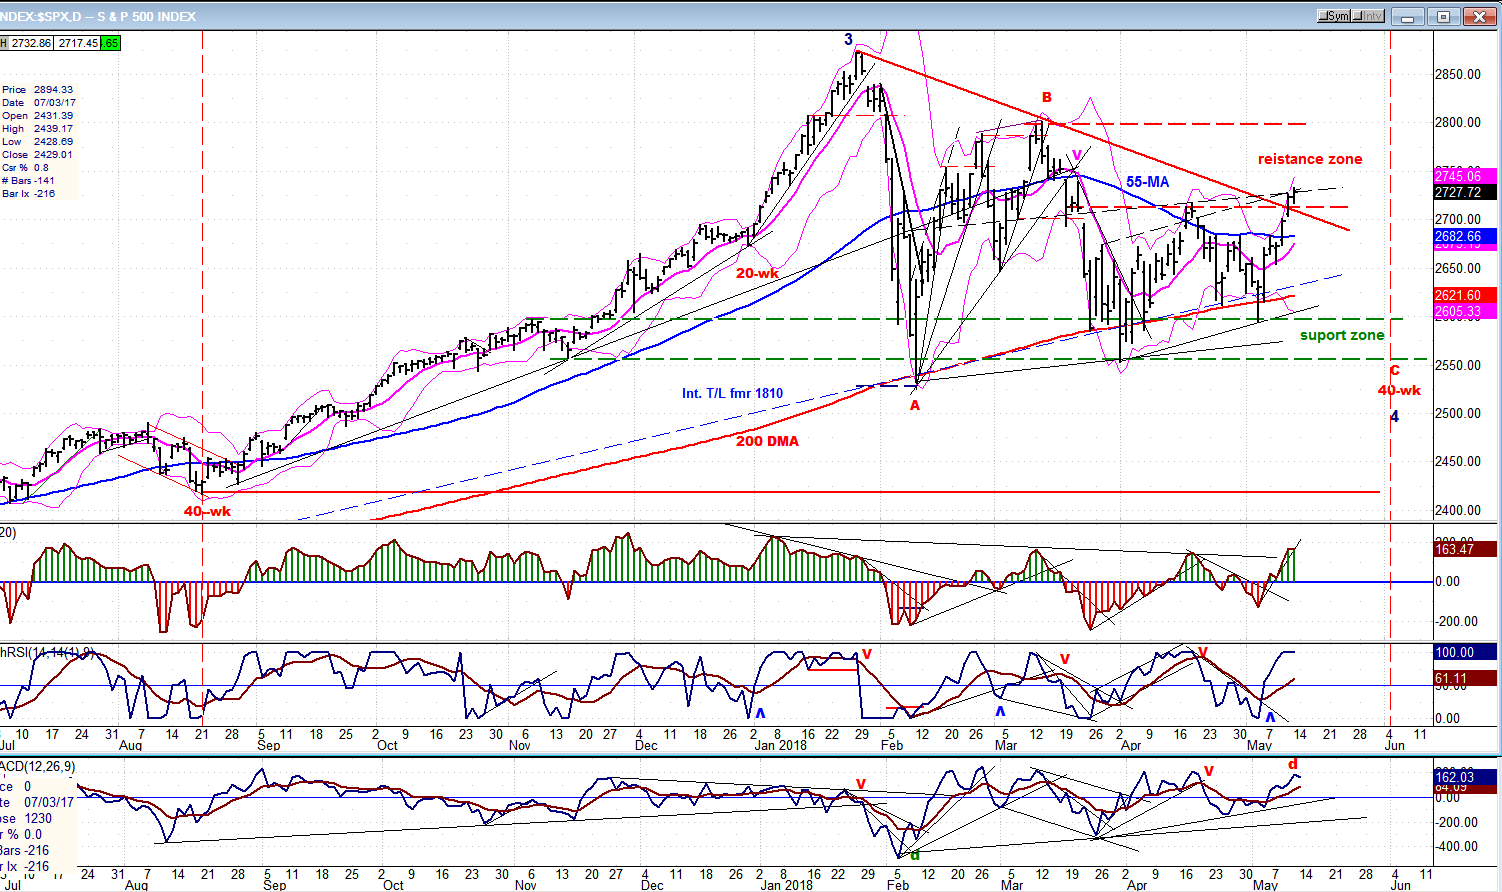
On the chart below, I have identified the date when the previous 40-wk cycle made its low, as well as the ideal time for the next one to do so. As mentioned earlier, the correction has taken the form of a probable triangle, and it is likely to remain so. A triangle is by definition a continuation pattern, so we should expect the long-term trend to continue and make a new high after this correction is over. It is also worth noting that many fourth waves do occur as a triangle.
I have also marked the support and resistance zones which have confined the action to a trading range for the past four months. The last short-term decline stopped right on the top layer of the support, and the current rally has progressed slightly higher than the previous one into the resistance band, but is not expected to do much more, considering the negative divergence which has appeared on the hourly indicators.
If you look at the oscillators at the bottom of this daily chart, you will see that they have reached the tops of their normal ranges, which is the area from which they normally reverse (as well as the market). What will determine whether or not the 40-wk cycle made its low in early May, will be whether or not the top oscillator remains in the green, which is what tends to occur in a prolonged uptrend. If, after retracing to the zero line, it continues below, we can pretty much assume that we are in the bottoming phase of the intermediate cycle.
SPX Hourly Chart
The current rally has surpassed the previous short-term rally by a few points; but it has stalled and has made a pattern which looks very much like a small H&S formation. The slanted red line is the neck line and if, on Monday, we fail to go higher, turn down and go through it, thereby declining below the uptrend line as well, this would have to be regarded as a short-term sell signal.
Considering the state of the oscillators -- with the two outside ones showing negative divergence and the middle one having already given a sell signal -- this looks like the most likely scenario going forward. If we do start to decline from here, the initial target would be the top of the former resistance band. Some congestion forming above that level would create the pattern we need on the Point & Figure chart in order to derive a projection for the final low of the correction.
As the decline progresses, more support should be met where the two MAs (blue 55-hr & red 233hr) come together; and it would have to be broken by a wide margin to suggest that the 40-wk cycle is still in the process of bottoming. If we halt the decline at that level and resume the uptrend, I will have to (reluctantly) concede that the 40-wk cycle has fooled me and made its low in early May.
SPX, IWM, TRAN (Daily Charts)
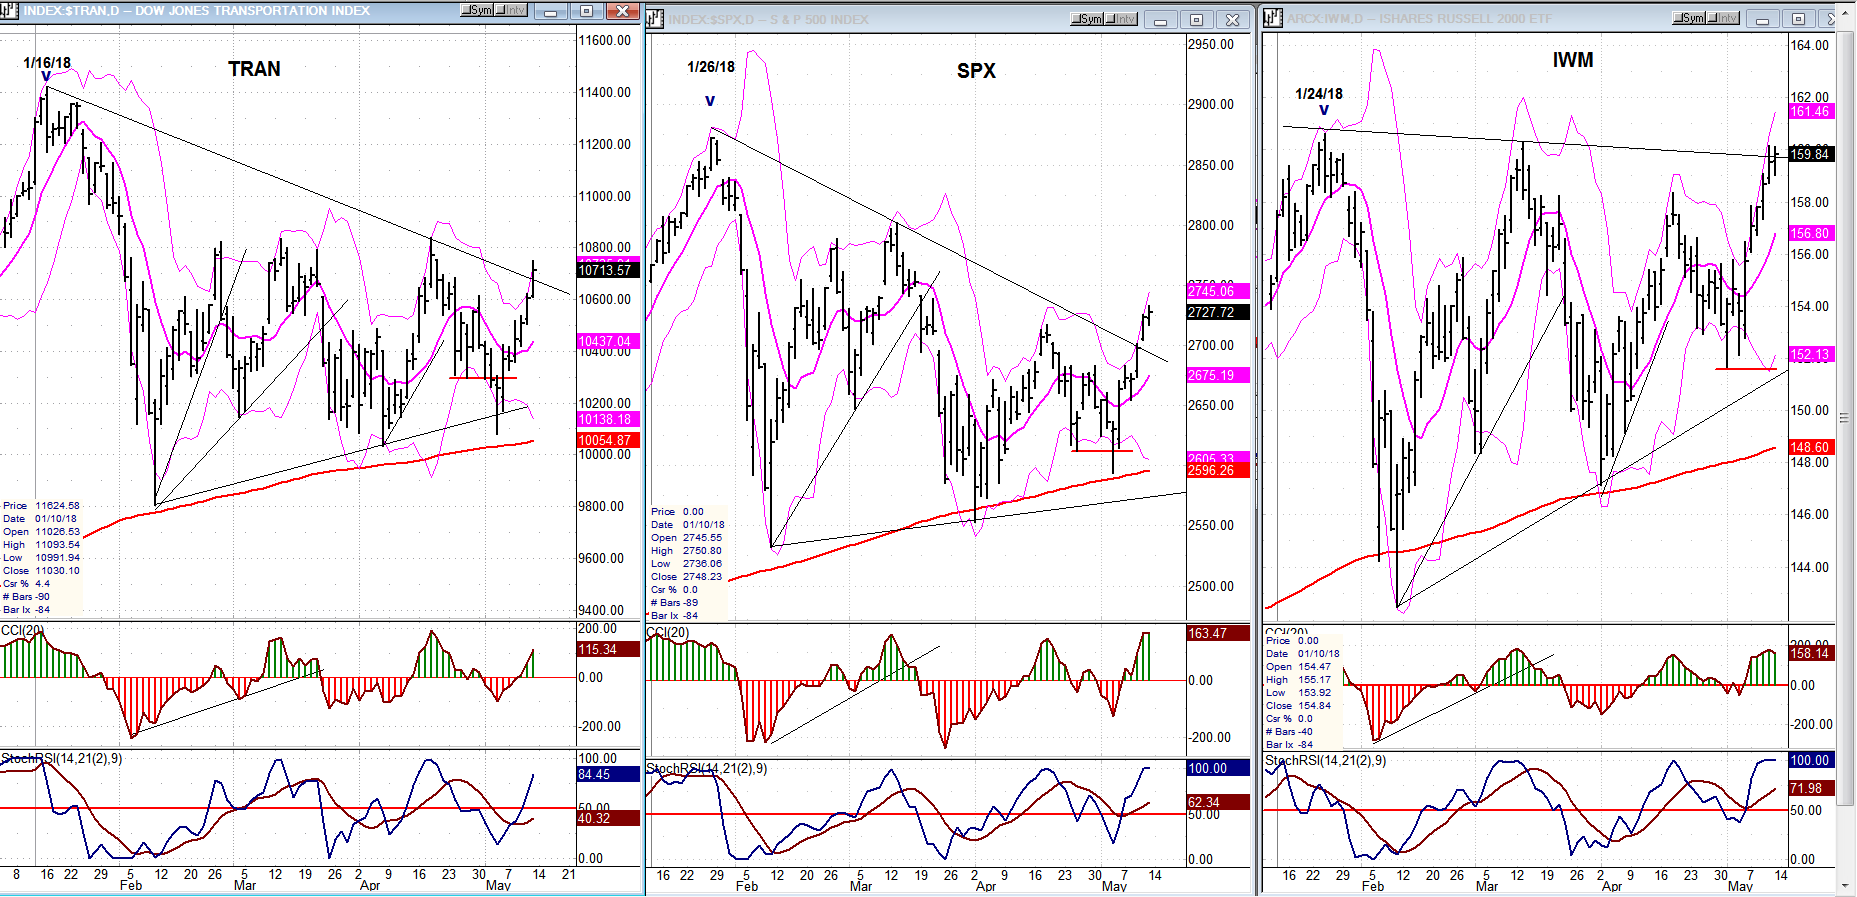
The primary purpose of comparing these three indexes is to have advance warning for an important top. As we see here, both TRAN and IWM made their intermediate highs ahead of SPX and warned that a correction was coming. As the market approaches the next important high -- which should be the top of the bull market (sometime in the Fall) -- it will be time, once again, to look for divergence to occur between SPX and the two others. In the meantime however, we can still benefit from the fact that IWM remains stronger than SPX, suggesting that the bull market is not yet over. We can also see that all three are making a triangle correction, with IWM probably making a bullish ascending triangle pattern.
UUP (Dollar ETF) Weekly
After reaching the previously mentioned resistance, UUP is finally beginning to correct, but as long as the indicators do not drop into the red zone and give a confirmed sell signal, this may only be a mild consolidation followed by a resumption of the uptrend. Best guesstimate is that it will retrace to about 24.00 before attempting to make a new high. The P&F chart is currently ambivalent.

GDX (Gold Miners ETF)
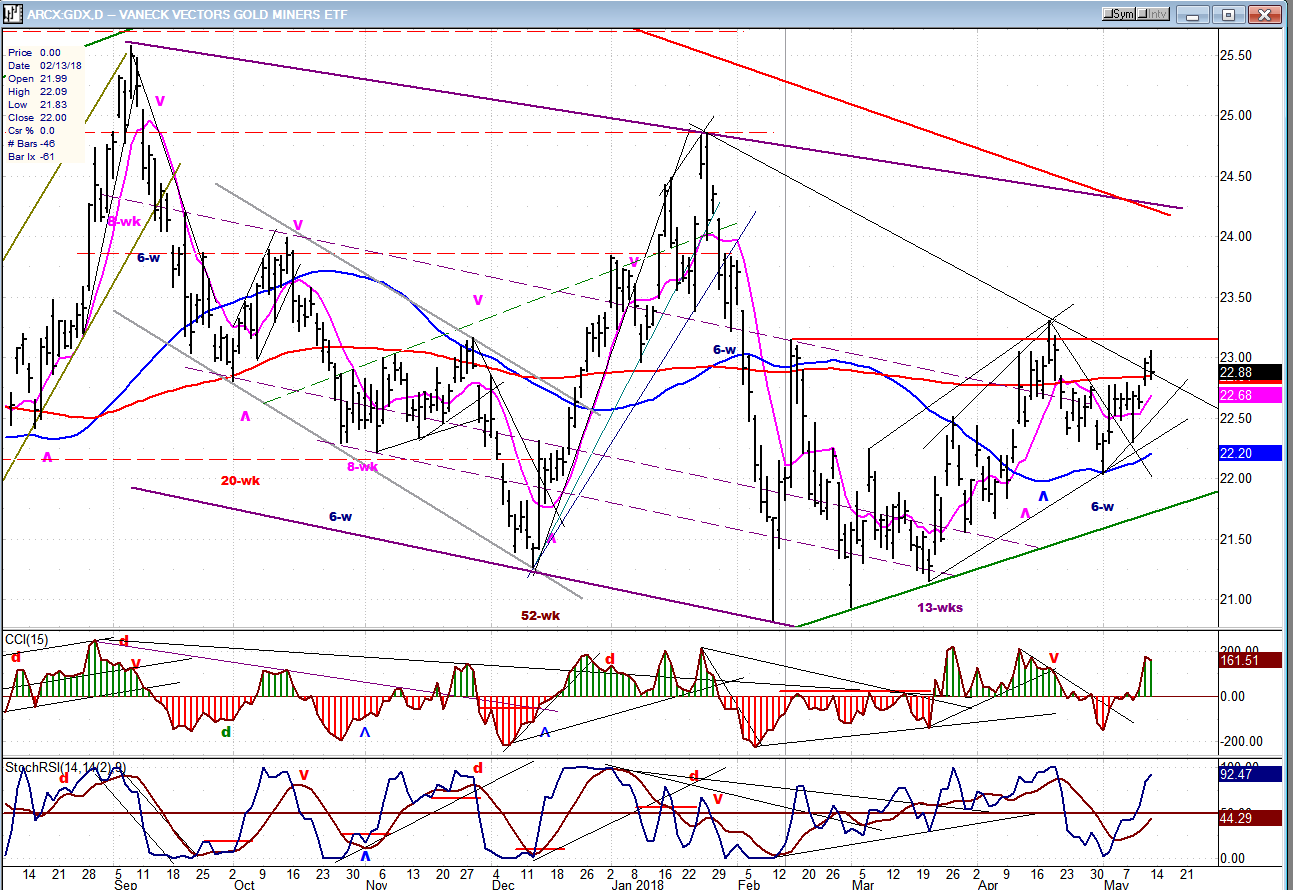
GDX is making a basing pattern which should eventually lead to higher prices, but this is not likely to happen until the dollar begins to correct in earnest. With UUP beginning to pull back, GDX was able to rise above a minor resistance level, but as soon as UUP showed signs of resisting its downtrend, GDX started to retreat. In spite of having developed a good base which points to much higher prices (as long as the pattern remains bullish), if UUP only declines 24.00, GDX will also be limited to 24.00-24.50 over the near-term.
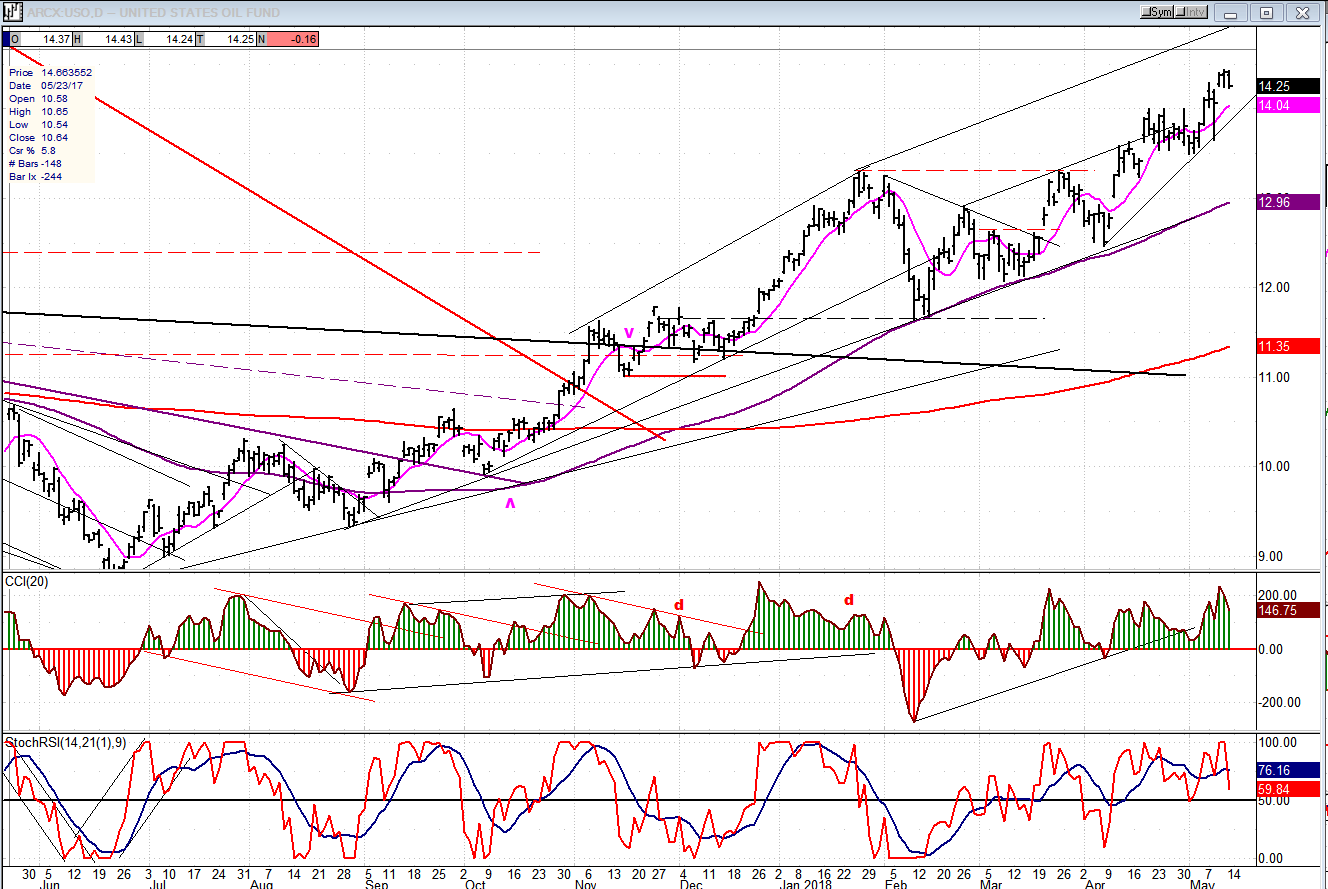
USO (United States Oil Fund)
USO continues its uptrend, seemingly intent on reaching its 14.50-15.00 target before correcting.
Summary
The rally which started on 5/03 appears to be coming to an end. This should be confirmed by next week. If so, the bears are ready to make their final statement with a decline into the low of the 40-week cycle. This would complete the triangle pattern and end the correction. A confirmed intermediate reversal will come when the weekly chart indicators have issued a buy signal.
*********
FREE TRIAL SUBSCRIPTON
With a trial subscription, you will have access to the same information that is given to paid subscribers, but for a limited time period. I think you will find that knowing how far a move can carry is one of the most useful benefits of this service, whether you are a trader or an investor -- especially when this price target is confirmed by reliable indicators which give advance warning of a market top or bottom. Furthermore, cycle analysis adds the all- important time element to the above price projections.
For a FREE 4-week trial, further subscription options, payment plans, and for general information, I encourage you to visit my website at www.marketurningpoints.com.
The above comments about the financial markets are based purely on what I consider to be sound technical analysis principles. They represent my own opinion and are not meant to be construed as trading or investment advice, but are offered as an analytical point of view which might be of interest to those who follow stock market cycles and technical analysis.

When Andre Gratian was a stock broker years ago, a friend introduced him to technical analysis of the market. Consequently, it is not an exaggeration to say that Andre fell in love with this approach! Ever since then, it has become an increasingly important part of his professional life. Gratian has studied the works of Wyckoff, Edwards & Magee, Edward J. Dewey (cycles) and many others. However, one of my most profitable undertaking has probably been to study Point & Figure charting, which he finds invaluable in analyzing stocks and indices. If he were restricted to one methodology, this is the one that he would choose. This well-rounded background has given him what he feels to be a special insight into the stock market, facilitating the recognition of meaningful patterns and the ‘turning points’ in all trends, whether they be short or long term. Andre feels very comfortable discussing the stock market and passing on meaningful information to others. His subscribers include individuals and money managers throughout the world. Moreover, his Newsletters are currently published on several financial sites, here and abroad.


