Technical Analysis Of The Markets


Current Position of the Market
SPX: Long-Term Trend – The bull market is continuing with a top expected in the low 3000s.
Intermediate Trend – The intermediate correction from 2873 is likely to continue until about early June.
Analysis of the short-term trend is done on a daily basis with the help of hourly charts. It is an important adjunct to the analysis of daily and weekly charts which discusses the course of longer market trends.
One Final Pull-Back?
Market Overview
Last week, I mentioned that the 2700 level was key. If it did not hold, we could get a minimum pull-back to about 2780, and perhaps lower if weakness persisted. The rationale for holding at about 2780 was given as trend lines, MAs, minimum projection, etc… In fact, we did break below the 2700 las Monday, declined to 2676.81, and rallied in an a-b-c pattern to 2736.93 on Friday before retracing to 2729 and closing at 2734.
The strength of the rebound indicates that the bulk of the correction is over and that we may already have started a new uptrend which will lead us to new highs before long. But there are some indications that one more and final pull-back is warranted -- if I am analyzing the minor cyclic rhythm correctly! In that case, a final low could come around June 6th or 7th.. This would not exclude the possibility of making a slightly higher high, first.
As far as the 40-wk cycle is concerned, unless we miraculously have a strong decline next week, it is very possible that it made its low early by ending the corrective pattern as a triangle on May 03, and that we have already started a new uptrend. That, or that it is a complete no-show this time around. There are other possibilities that I won’t go into.
Chart Analysis (These charts and subsequent ones courtesy of QCharts)
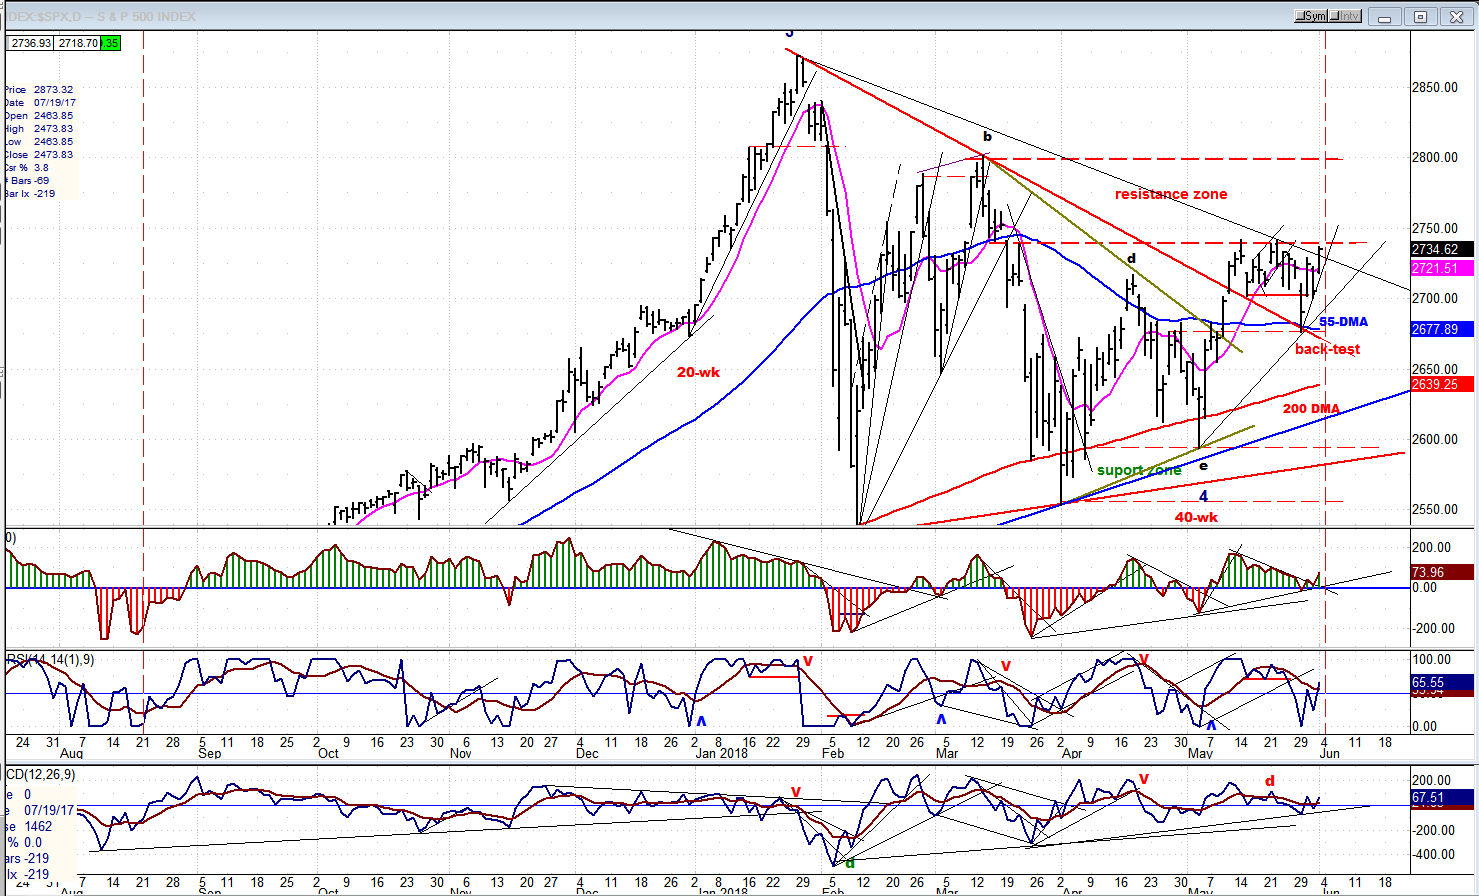
SPX Daily Chart
I gave the 40-wk cycle every possible chance to make its low during the ideal time period which was estimated to be in early June. Last week we saw the beginning of a retracement which, had it extended into the following week, and dropped another fifty points or so, could have satisfied the most basic requirement for that intermediate cycle low. Instead, after back-testing the red declining trend line one more time, there was a strong rebound toward the former highs of the past three weeks. Both indicators and price appear to be getting back into an uptrend and it would only take another push of eight points on Monday to surpass the recent high.
In the Market Overview, I mentioned that minor cycles could bring the index back down into the end of the week before we have a decisive break-out. The end of the week also happens to be the “ideal” date for the 40-week cycle to make its low. I have waited this long, and might as well wait one more week to see what transpires over the next few days. Another news item which refers to the ratcheting up of the trade war could easily give the market a reason to drop back a hundred points in an instant.
Besides the dilemma with minor cycle lows ahead, not long ago I posted a chart in which the DJIA was showing negative divergence to SPX, and this was followed by price weakness in both. This condition has materialized once again, as you will see a little later. So there is no harm in waiting another week to see what the market wants to do!
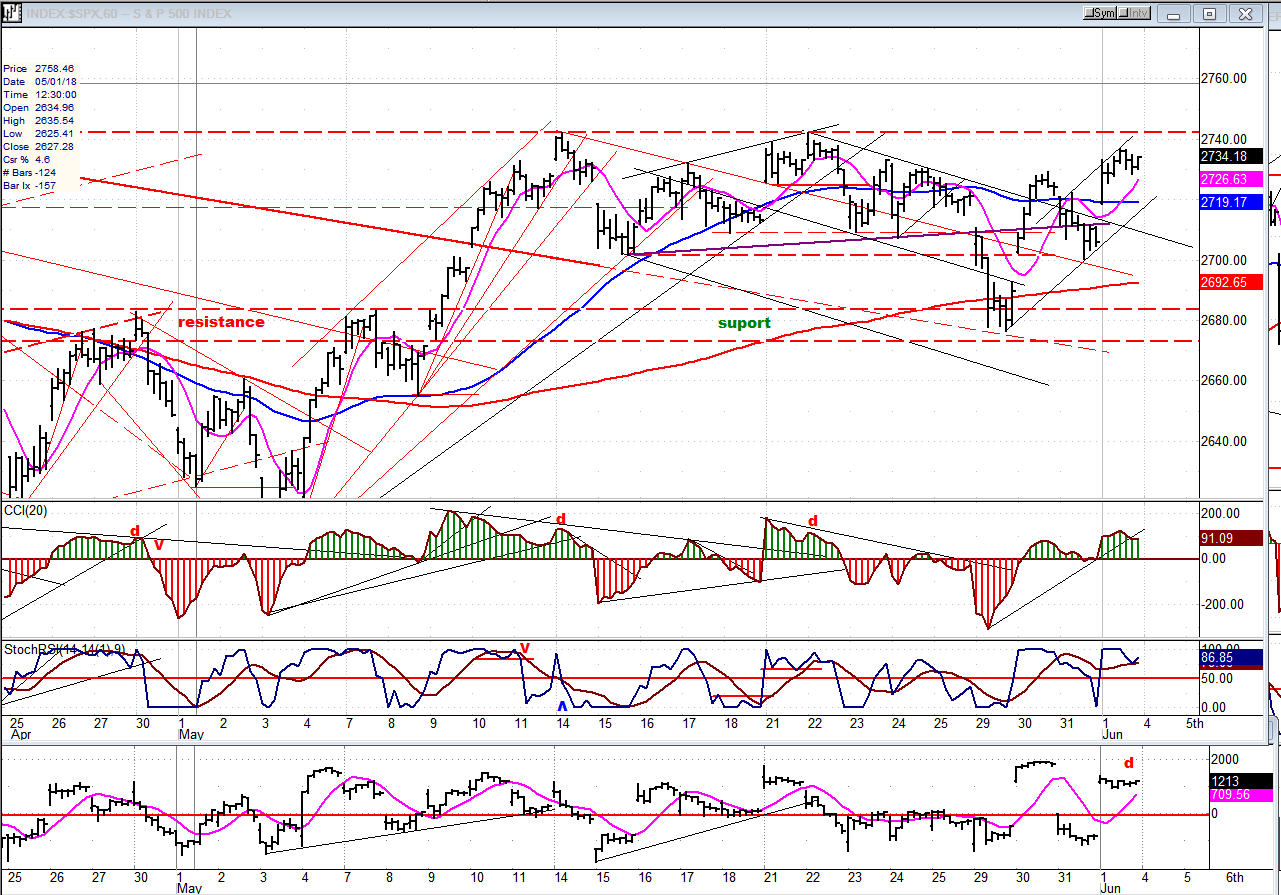
SPX Hourly Chart
“if SPX broke below 2700, it would make perfect sense for it to retrace to about 2680.”
The above was written in the last letter, and it turned out to be spot on! A strong rebound from that level was stopped by overhead resistance and was followed by an initial pull-back. Had we started back down right away, it would have given more credibility to the above band of resistance being a distribution pattern, ready to send the index back toward its early May low. Instead we had a second up-phase which stopped just short of the former highs, and did not give back that much by Friday’s close. Furthermore, negative divergence normally appears in the upper oscillator as a warning that we are about to reverse, but as of Friday there was none, suggesting that the advance may not be over. Some minor divergence did show up in the A/Ds, but not enough to make a real difference.
So, we are faced with a couple of possibilities: we are already in an uptrend which will take us toward new highs or, even if we do surpass the recent tops, we still have one more pull-back to satisfy the minor cycles before a true break-out occurs. Be aware that if we do go above the dashed red line on Monday, it may turn out to be just a head fake, immediately followed by a reversal -- unless, of course the move shows undeniable strength.
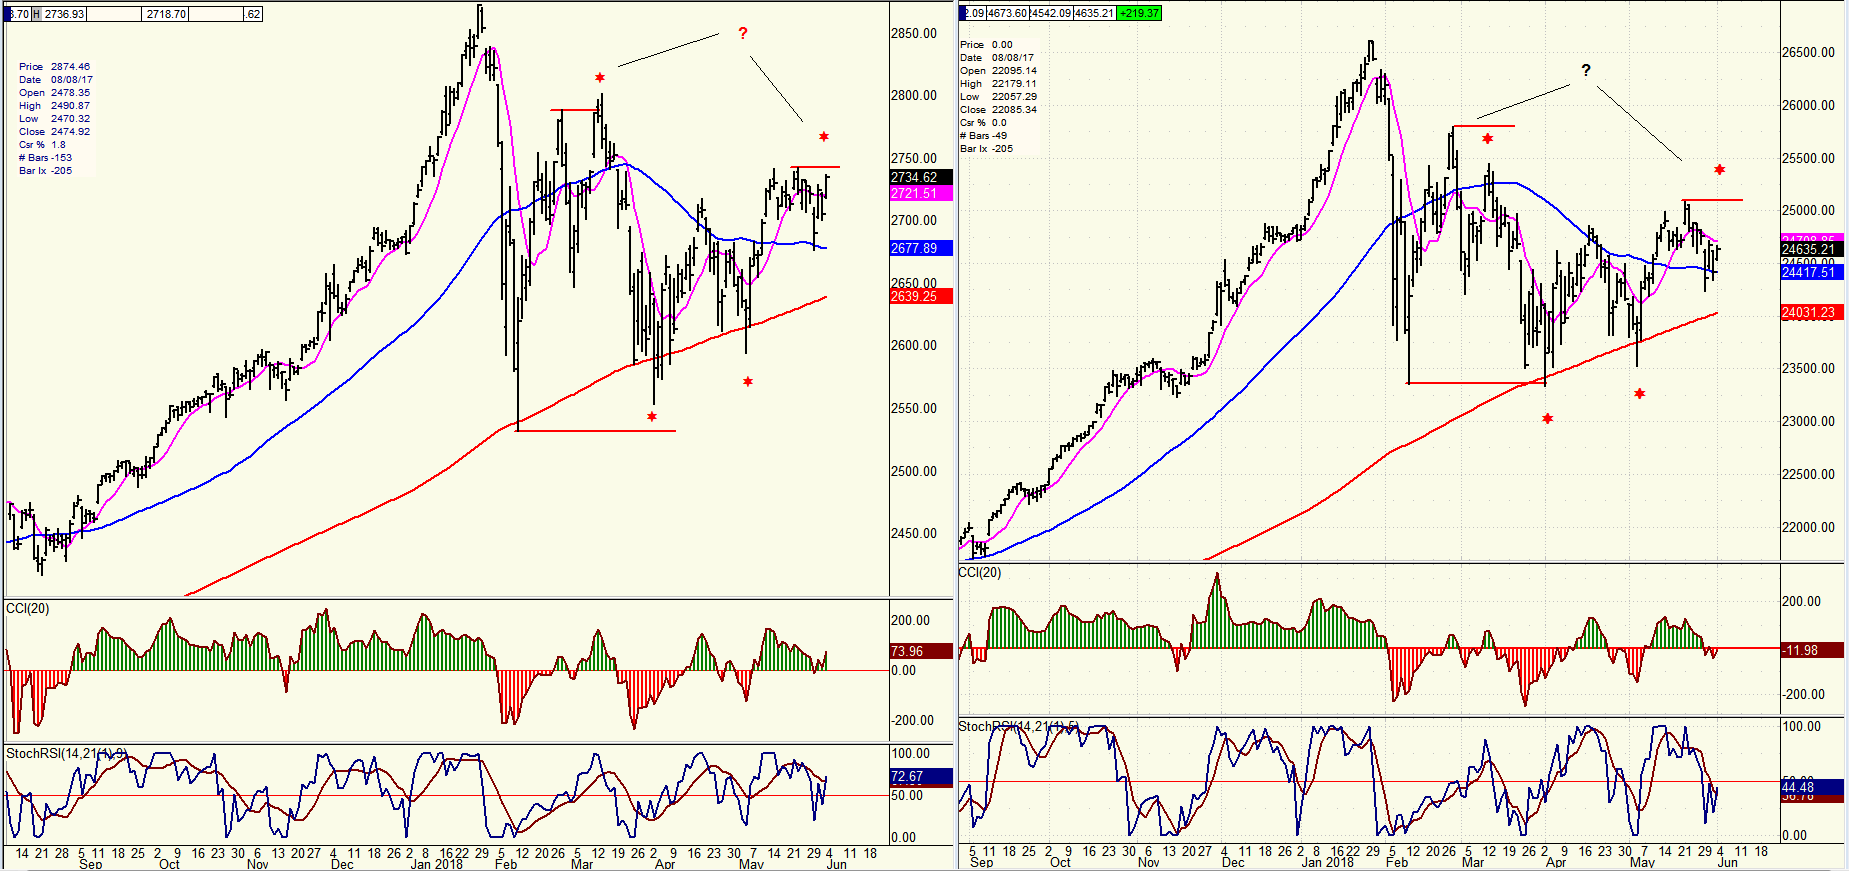
SPX vs DJIA (Daily Charts)
You may recall that last week I posted charts that showed that both IWM and TRAN were stronger than SPX, so it is not surprising that SPX is playing catch-up. But what are we to make of the fact that DJIA is lagging, which looks like a repeat of the condition we had at the former highs marked with red asterisks? And if SPX made a slightly higher high before pulling back, and DJIA did not, the similarity would be even more pronounced.
On Friday it was obvious that the FAANGs were contributing greatly to the strength in the SPX. This could explain the discrepancy between the strength of the SPX and that of DJIA.
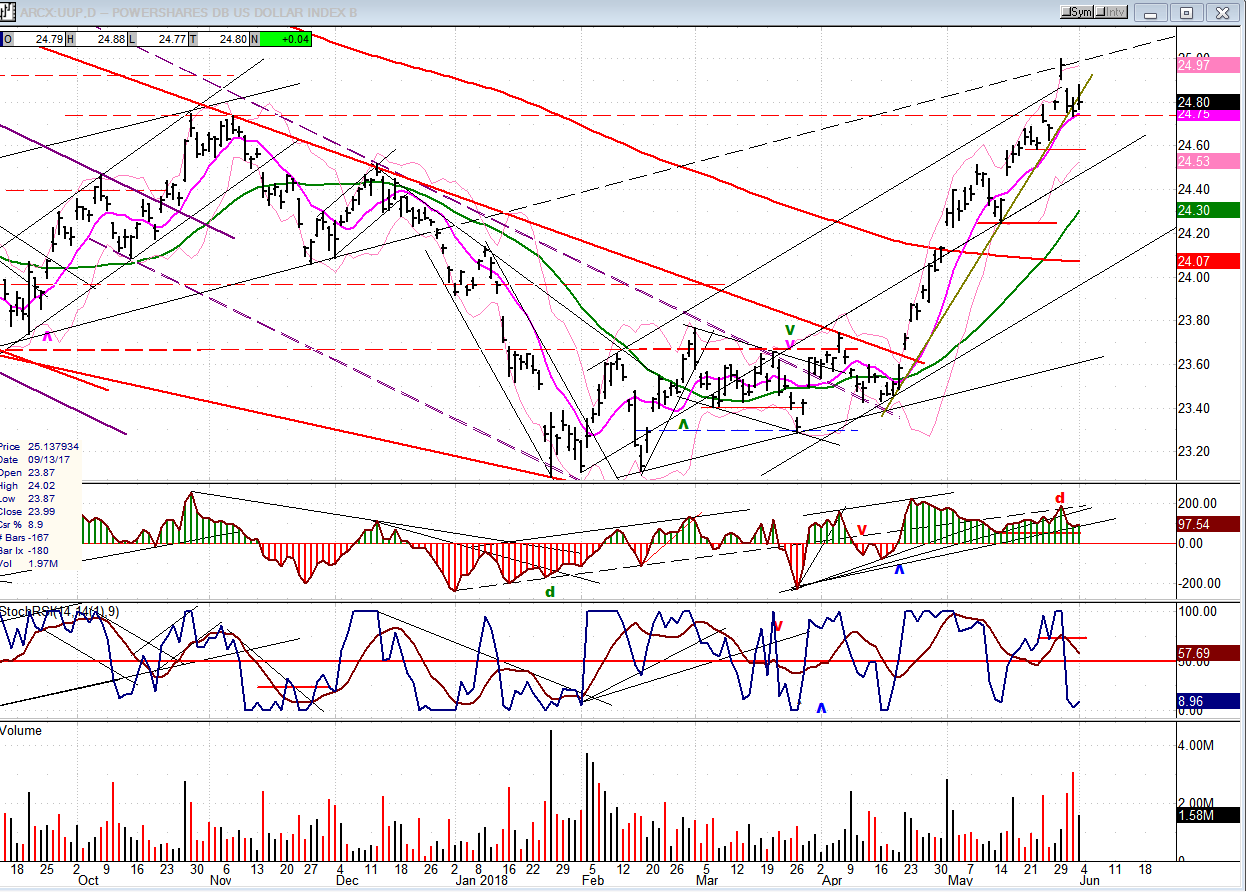
UUP (Dollar ETF) Weekly
Last week, UUP darted to a new high and retraced immediately, leaving a gap in both directions. There is a name for this type of action: it is called an island reversal, and it normally appears at the end of a trend. In the case of UUP, this is also confirmed by the volume pattern. If the “expected” follows, UUP should begin to correct. In the last two trading days, it did its best to hold above the uptrend line and the 9-DMA, but the coming week should see a continued price retracement.
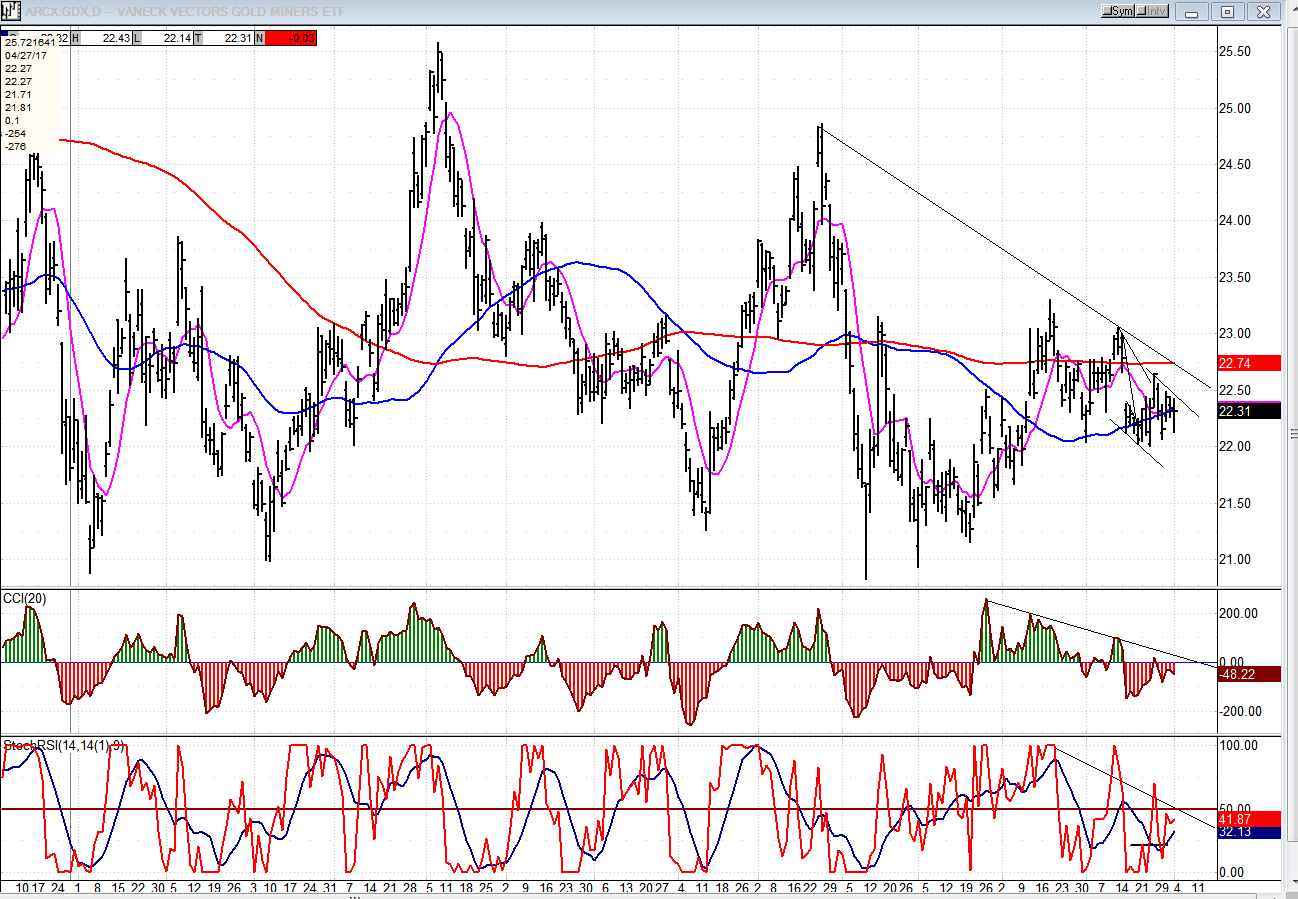
GDX (Gold Miners ETF)
GDX is not making a negative technical pattern, but it has not been able to generate enough buying interest for a break-out. This could quickly change if UUP begins to correct. GDX needs to clear the downtrend line as well as its 200-DMA to get something started.
USO (United States Oil Fund)
USO reached its projection and has reversed. The correction could take it back down to about 12.00, which is a former support level as well as the point where it would meet its 200 DMA. There are higher counts possible (and even probable) after this correction is over. It’s a question of when it will be ready for them. We need to follow the correction and to determine when it has come to an end.

Summary
The last short-term correction in SPX found support where suggested and a strong rebound ensued. It is unclear if this is another phase of the consolidation pattern of the past three weeks, or if the index is now ready to resume its longer term uptrend. Minor cyclical patterns suggest that another – perhaps final – pull-back is likely, even if we do extend the current rebound a little past recent short-term tops.
*********
FREE TRIAL SUBSCRIPTON
With a trial subscription, you will have access to the same information that is given to paid subscribers, but for a limited time period. I think you will find that knowing how far a move can carry is one of the most useful benefits of this service, whether you are a trader or an investor -- especially when this price target is confirmed by reliable indicators which give advance warning of a market top or bottom. Furthermore, cycle analysis adds the all- important time element to the above price projections.
For a FREE 4-week trial, further subscription options, payment plans, and for general information, I encourage you to visit my website at www.marketurningpoints.com.
The above comments about the financial markets are based purely on what I consider to be sound technical analysis principles. They represent my own opinion and are not meant to be construed as trading or investment advice, but are offered as an analytical point of view which might be of interest to those who follow stock market cycles and technical analysis.

When Andre Gratian was a stock broker years ago, a friend introduced him to technical analysis of the market. Consequently, it is not an exaggeration to say that Andre fell in love with this approach! Ever since then, it has become an increasingly important part of his professional life. Gratian has studied the works of Wyckoff, Edwards & Magee, Edward J. Dewey (cycles) and many others. However, one of my most profitable undertaking has probably been to study Point & Figure charting, which he finds invaluable in analyzing stocks and indices. If he were restricted to one methodology, this is the one that he would choose. This well-rounded background has given him what he feels to be a special insight into the stock market, facilitating the recognition of meaningful patterns and the ‘turning points’ in all trends, whether they be short or long term. Andre feels very comfortable discussing the stock market and passing on meaningful information to others. His subscribers include individuals and money managers throughout the world. Moreover, his Newsletters are currently published on several financial sites, here and abroad.


