Technical Analysis Of The Markets


Current Position of the Market
SPX: Long-term trend – The bull market is continuing with a top expected in the low 3000s.
Intermediate trend – This is now clearly pointing up and should remain so until its next high coincides with the projection that has been made for the bull market top.
Analysis of the short-term trend is done on a daily basis with the help of hourly charts. It is an important adjunct to the analysis of daily and weekly charts which discusses the course of longer market trends.
Expanding the top
Market Overview
Last week, SPX reached its ~2800 P&F target and started to form a short-term top. By Friday, the hourly indicators had given a sell signal and the daily had continued to increase their negative divergence pattern, suggesting that a short-term correction was imminent. This is expected to be a normal pull-back following the previous move which started at 2692 and ended at 2815, and we can’t be too far off if we apply our standard measurement of a .382 to .50 retracement of the just completed 123-point uptrend to determine the extent of the correction. This would bring the index back down to between 2750 and 2770 before the next short-term uptrend can get under way as the bullish progression continues toward an eventual goal of about 3000 or slightly higher.
Of course, this is not meant to be a refined analysis of the index. It only serves as a gross appraisal of what lies ahead. Refinements are made and given in our daily updates with the help of more specific P&F price projections as well as time frame estimates provided by the minor cycles which determine the short-term market rhythm.
For now, it is sufficient to say that the bull market will probably continue into year’s end and a warning will be issued if it looks as if that prediction needs to be altered.
Chart Analysis (The charts that are shown below are courtesy of QCharts)
SPX daily chart
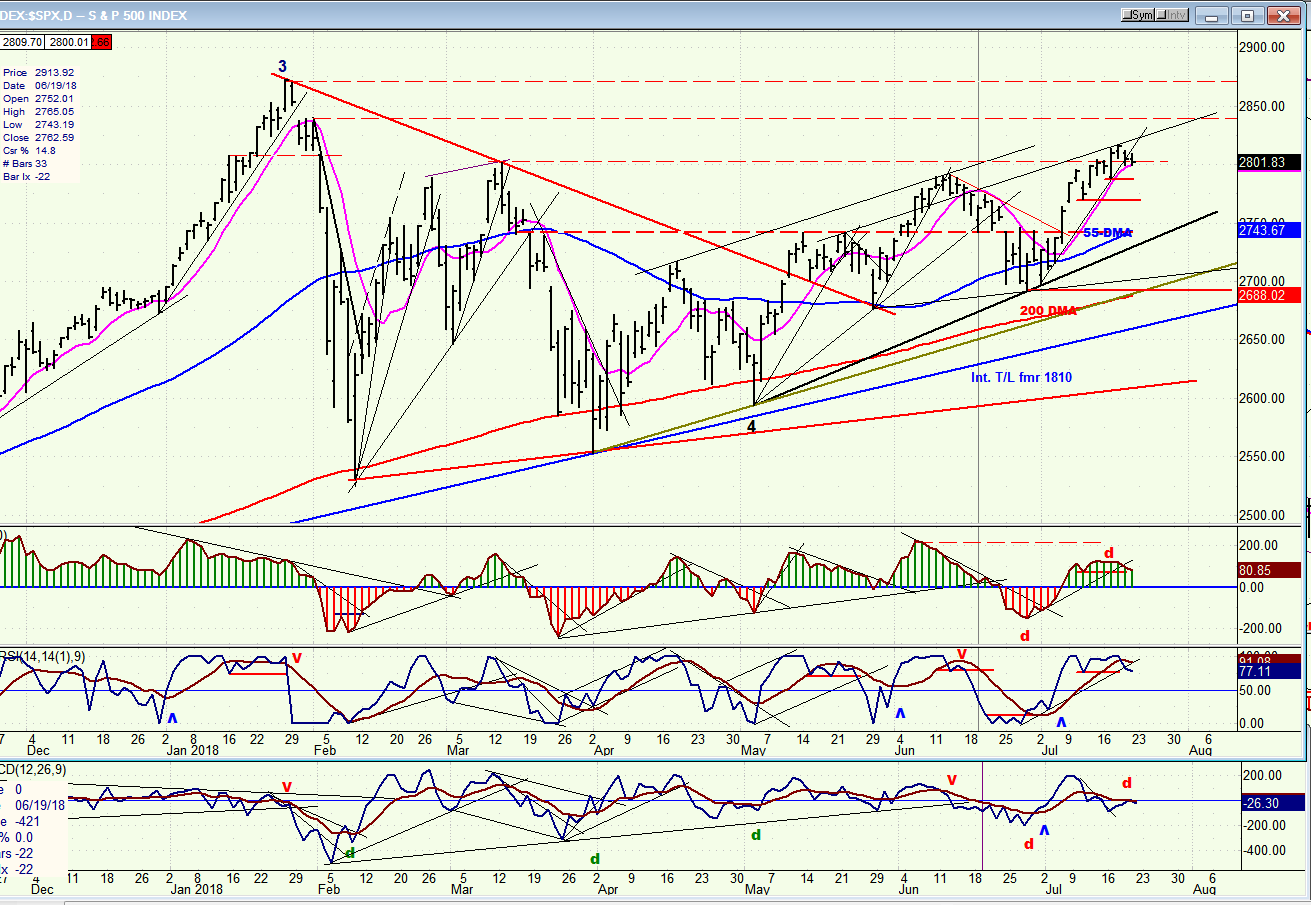
A quick glance at the chart below tells us that nothing much changed last week in the overall index trend. The price increased slightly beyond the March top, but a closer look at the market action warns that this is all we get for now. Moving averages serve as flexible trend lines and, in this case, the index is positioned well above its intermediate (55-dma) and long-term (200-dma) averages. Until the price gap narrows with these two lines, we need not be concerned that more than a short-term correction is ahead of us. Of course we can never make absolute, unqualified statements about the market. All we have to do is look back at what happened in January. Such a statement would then have been grossly misleading because it did not apply to that time period. Being in the “now” is a philosophy which should be applied to the stock market!
By looking at what the price did over the course of the past few days, we can see that it was meeting with resistance, since it had trouble sustaining its upward momentum. But this is far more noticeable in the oscillators at the bottom of the page. The top two are momentum indicators and they normally start rolling over a little ahead of the price. They are currently warning us that we should expect at least a consolidation. The bottom oscillator is a breadth indicator. It is analyzed the same way as the ones above, but it tends to precede them. This is very apparent on this chart. When we get these types of patterns in the oscillators, we should keep a close eye on the trend line as well as on the shortest 9-dMA. We can see that on Friday, the index closed just outside of its trend line for the first time since the move started. This is another warning that a correction is about to begin. Now we should start tracking the price action more closely. If it falls below the first small red horizontal line, we will have a confirmation that a correction has started.
We already know what kind of a correction we can expect, based the normal Fibonacci retracements discussed above. But those who receive daily updates will have the advantage of knowing more specifically the extent and duration of that correction because more refined information is provided to them.
SPX hourly chart
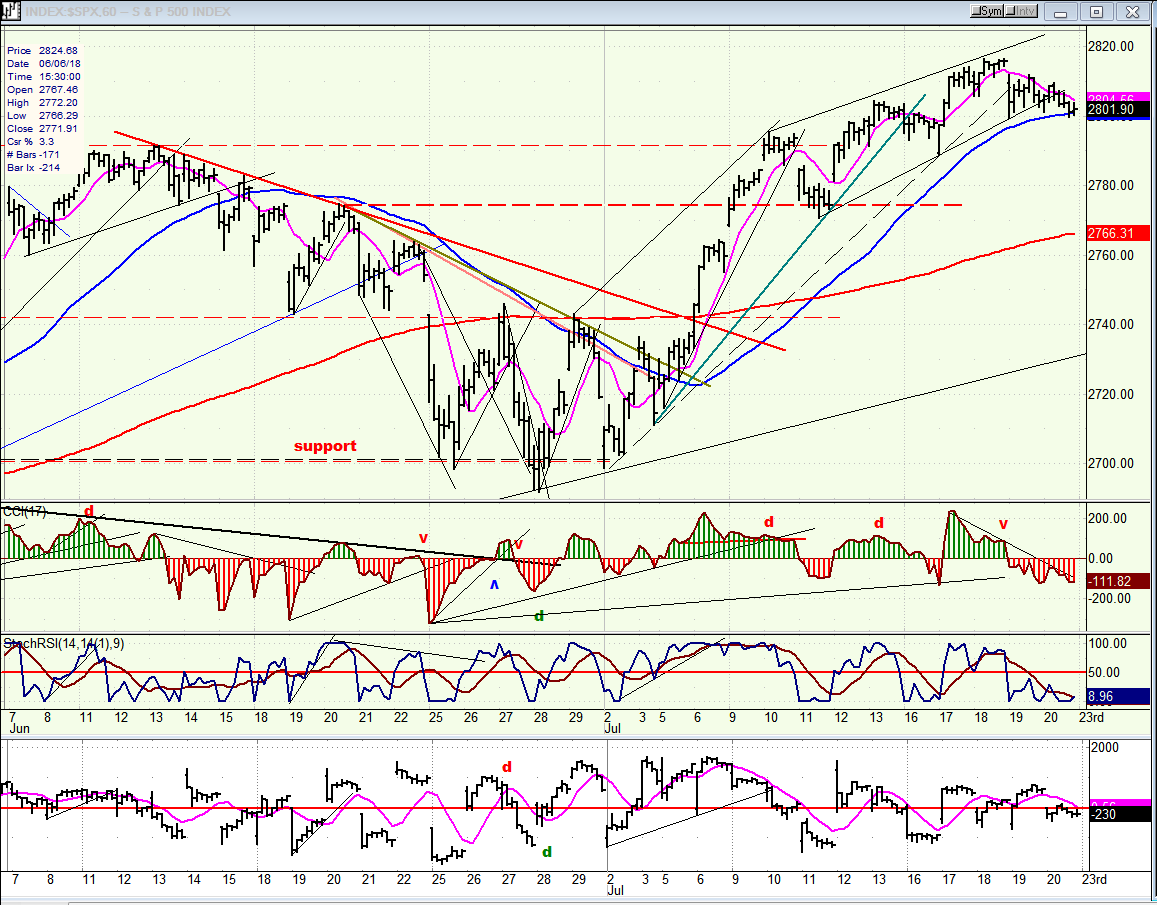
Once again, the hourly chart clearly displays its value. Here, we can see plainly the loss of upside momentum beginning to occur a little before the middle of the month, and what looks like a last gasp on the 18th as the index could obviously go no farther and distribution began ahead of a near-certain correction. Incidentally, just to point out the value of P&F charts, this two-day, seemingly insignificant minor congestion pattern appearing on the hourly chart has already confirmed – when translated into P&F – the type of correction suggested by Fibonacci measurement.
We can also plainly see that prices have closed outside of the dashed channel trend line, as well as below the 9-hr MA. All that remains for a hardened confirmation that the correction has started is a drop below the blue 55-hr MA, which could arrive first thing on Monday morning with an opening gap.
The hourly oscillators are also proving their value! All three issued a sell signal when they went negative on the 19th, and remained negative into Friday’s close.
As stated above, there is no reason (at this time) to expect anything more than a normal correction of the previous uptrend. But if we were to extend the decline beyond 2740, alert bells should start to sound a warning that something more serious is afoot.
SPX, DJIA (daily)
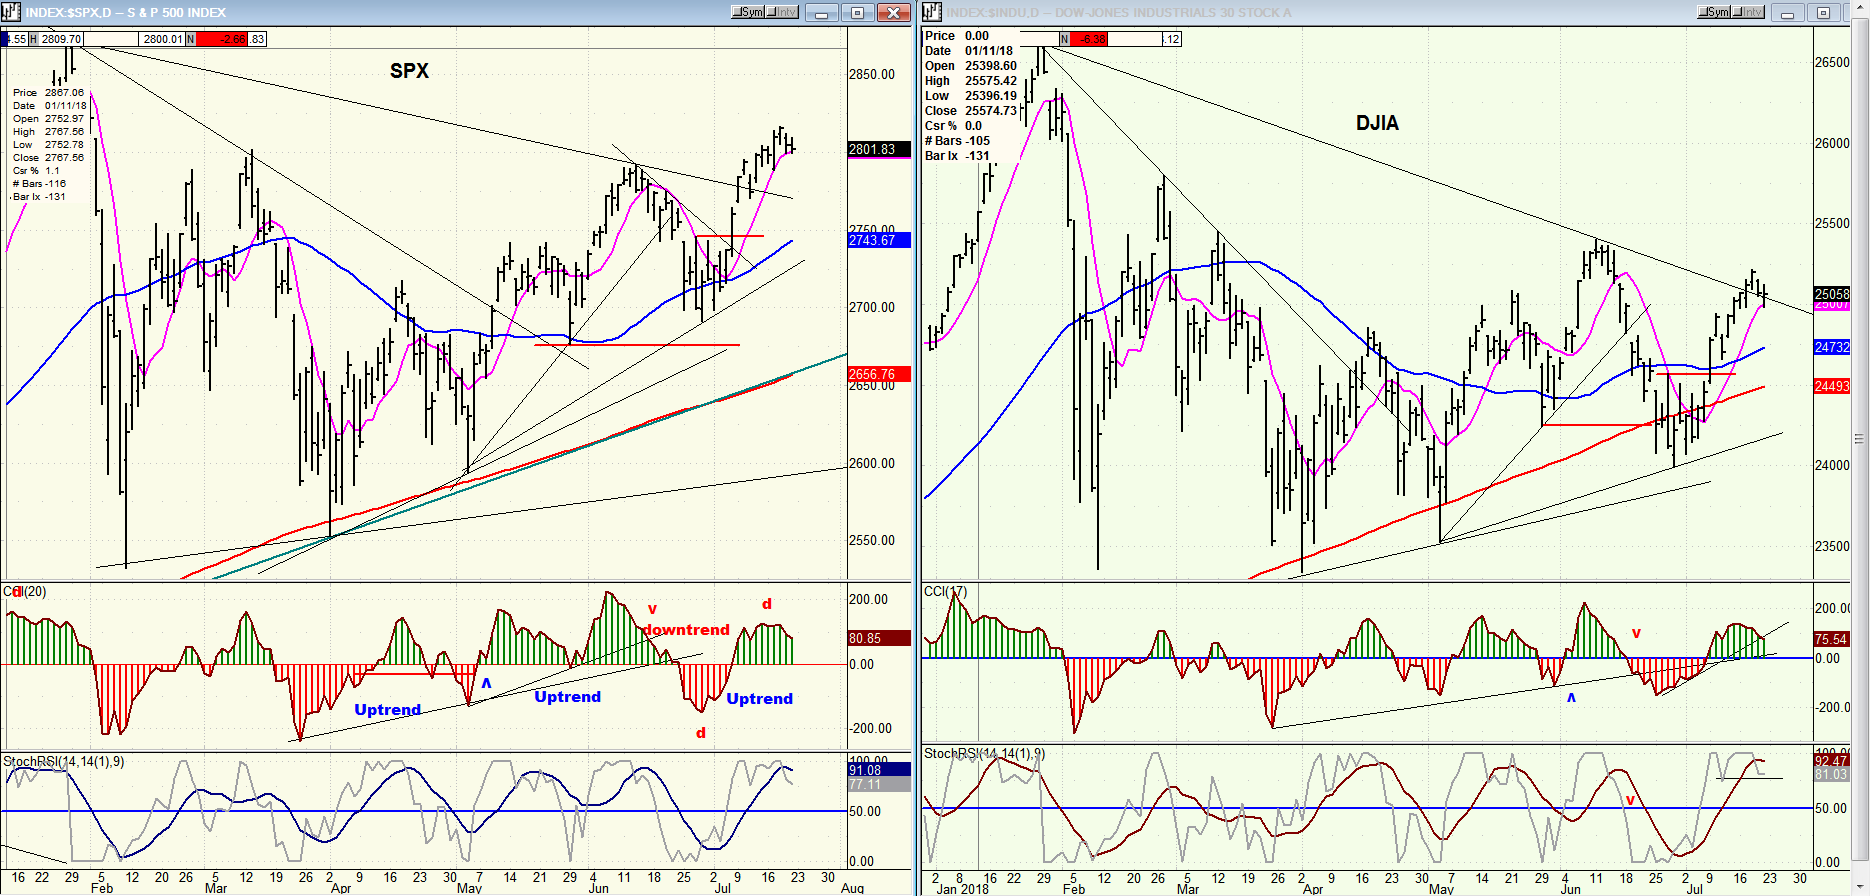
We can’t say that we were not warned that a correction was coming. I have been pointing to the developing divergence between the DJIA and SPX, as well as in the TRAN vs. SPX.
Another way to measure the extent of the coming correction is to look for the daily oscillators to retrace their move from top to bottom -- which is their normal pattern. Since they are just getting started, we can assume that the low is not likely to come on Monday, nor even next week!
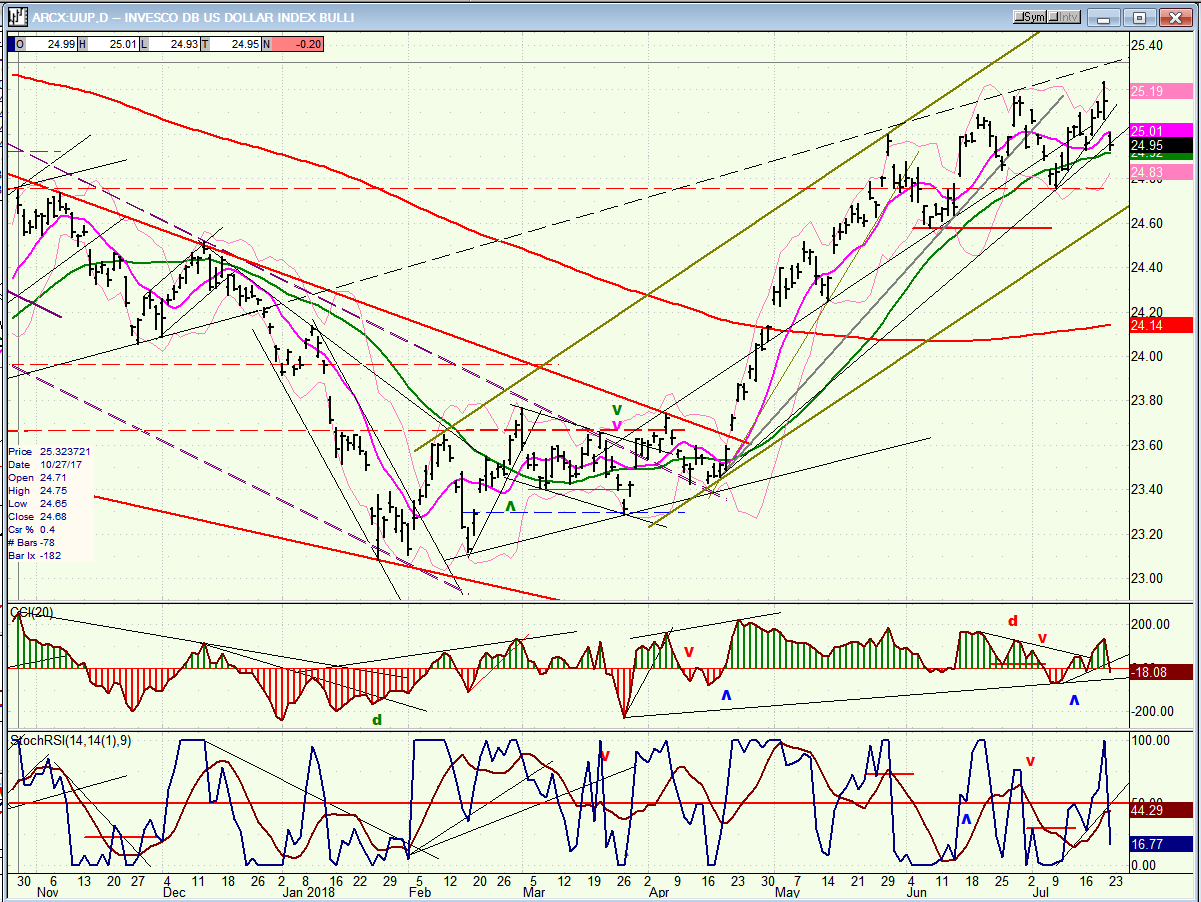
UUP (dollar ETF) Weekly
UUP had a sharp one day pull-back on Friday – relative to previous ones. This could be a warning that it can go no higher for the time being and could be on the verge of (finally) correcting its seven-month uptrend. A continued decline over the next few days would confirm this, especially if it drops below the dashed line. This would bode well for GDX (below).
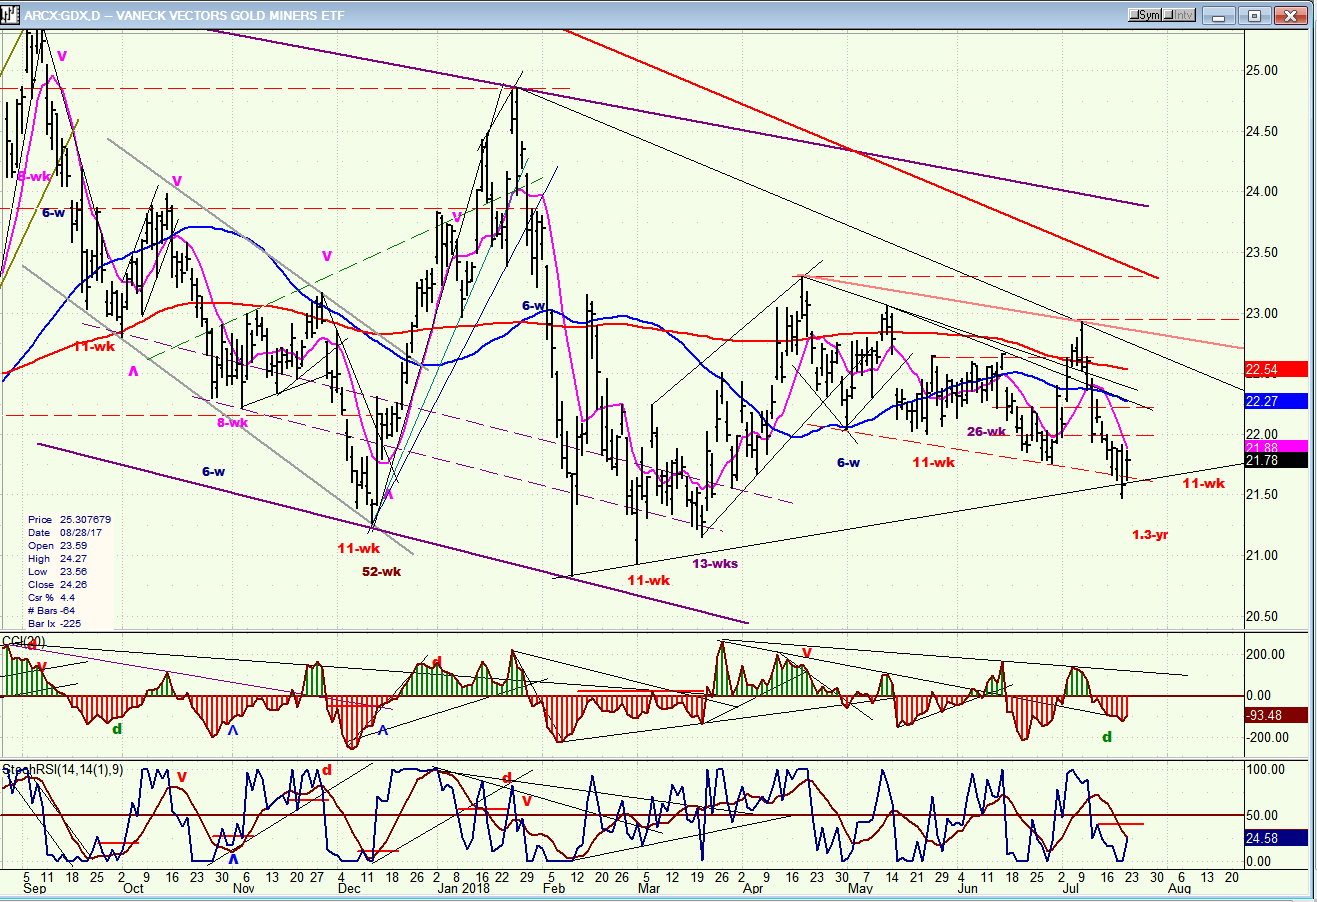
GDX (Gold miners ETF)
Is GDX, at last, ready to start a significant uptrend? We should know as early as Monday. The small move below the lower (dashed) channel line, followed by a higher close on Friday, could be a sign of downside price exhaustion, in which case, aggressive buying will soon appear. Note also the good positive divergence which has formed in the top oscillator, and the reversal which has taken place in the lower one. These are warnings that the starting gun is about to go off! Unless it turns out to be another false start; we’ve had those before.
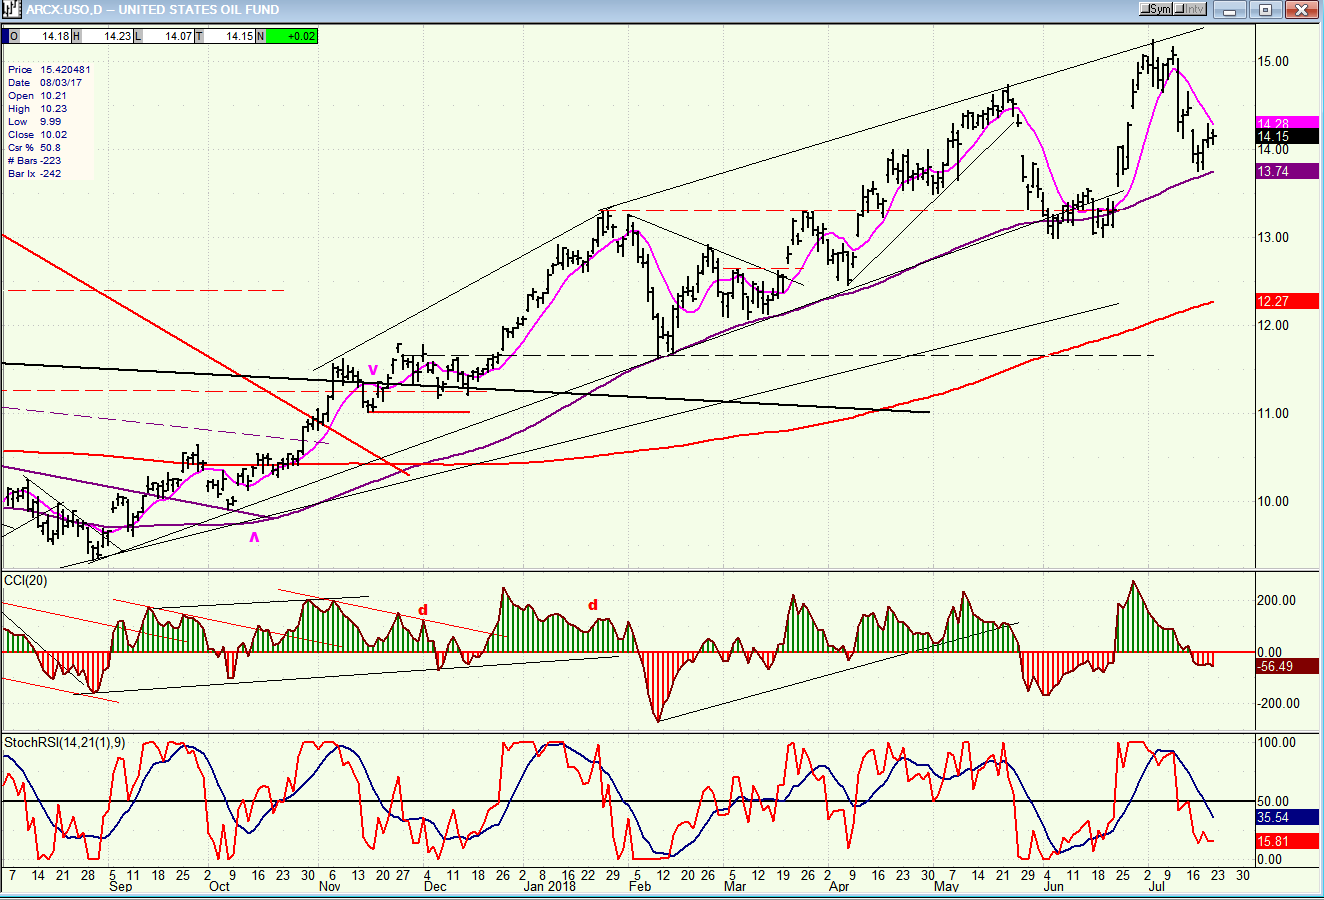
USO (United States Oil Fund)
USO has made another trip to support, at the bottom of the channel and 30-dMA. Are there enough bulls left to send it back to the top? I would not count on it!
Summary
The signs could not be clearer that SPX is ready to correct its previous 123-point rally. At this time, there is no reason to think that this will be anything more than a normal correction in a longer uptrend but still, due to the extent of the previous bullish phase, we can (should) expect a fair move in the opposite direction.
*********
FREE TRIAL SUBSCRIPTON
With a trial subscription, you will have access to the same information that is given to paid subscribers, but for a limited time period. I think you will find that knowing how far a move can carry is one of the most useful benefits of this service, whether you are a trader or an investor -- especially when this price target is confirmed by reliable indicators which give advance warning of a market top or bottom. Furthermore, cycle analysis adds the all- important time element to the above price projections.
For a FREE 4-week trial, further subscription options, payment plans, and for general information, I encourage you to visit my website at www.marketurningpoints.com.
The above comments about the financial markets are based purely on what I consider to be sound technical analysis principles. They represent my own opinion and are not meant to be construed as trading or investment advice, but are offered as an analytical point of view which might be of interest to those who follow stock market cycles and technical analysis.

When Andre Gratian was a stock broker years ago, a friend introduced him to technical analysis of the market. Consequently, it is not an exaggeration to say that Andre fell in love with this approach! Ever since then, it has become an increasingly important part of his professional life. Gratian has studied the works of Wyckoff, Edwards & Magee, Edward J. Dewey (cycles) and many others. However, one of my most profitable undertaking has probably been to study Point & Figure charting, which he finds invaluable in analyzing stocks and indices. If he were restricted to one methodology, this is the one that he would choose. This well-rounded background has given him what he feels to be a special insight into the stock market, facilitating the recognition of meaningful patterns and the ‘turning points’ in all trends, whether they be short or long term. Andre feels very comfortable discussing the stock market and passing on meaningful information to others. His subscribers include individuals and money managers throughout the world. Moreover, his Newsletters are currently published on several financial sites, here and abroad.


