Technical Analysis Of The Markets


Current Position of the Market
SPX: Long-term trend – The bull market is continuing with a top expected in the low 3000s.
Intermediate trend – A correction in the intermediate trend should keep prices above the 2680 level.
Analysis of the short-term trend is done on a daily basis with the help of hourly charts. It is an important adjunct to the analysis of daily and weekly charts which discusses the course of longer market trends.
Is The Correction Over?
Market Overview
On 7/25, SPX ended a 156-point rally from 2692 to 2848 and started to correct. During a normal correction, an index retraces .382 to .50 of the uptrend which just ended. The lesser retracement would have taken the index back to about 2788, but instead, it made an initial correction low to 2798 and, after a two-day bounce, made a second low at 2796 before embarking on another 44-point surge and closing on its high of the day at 2740 on Friday.
Does this mean that the correction is over and that we have already started a new uptrend which will take the index to a new recovery high before the next pull-back takes place? That remains to be seen, and next week should bring about clarification of the market trend. However, there are a number of factors which make this doubtful, the principal one being that the overall market is currently in an apparent state of discord with disparity between the technical position of the various indices. The near-term strength in SPX is not being shared by NDX, DJIA, and least of all by IWM. This lack of cohesion points to the need for some additional consolidation/correction to allow the various indexes to get back in sync before a new recovery high can take place. HowH
By Friday’s close, the short-term was overbought and, with minor cycles expected to make their lows on Monday, a near-term pull-back should take place. What follows will shed some light on the immediate course of the SPX and other indexes.
Chart Analysis (The charts that are shown below are courtesy of QCharts)
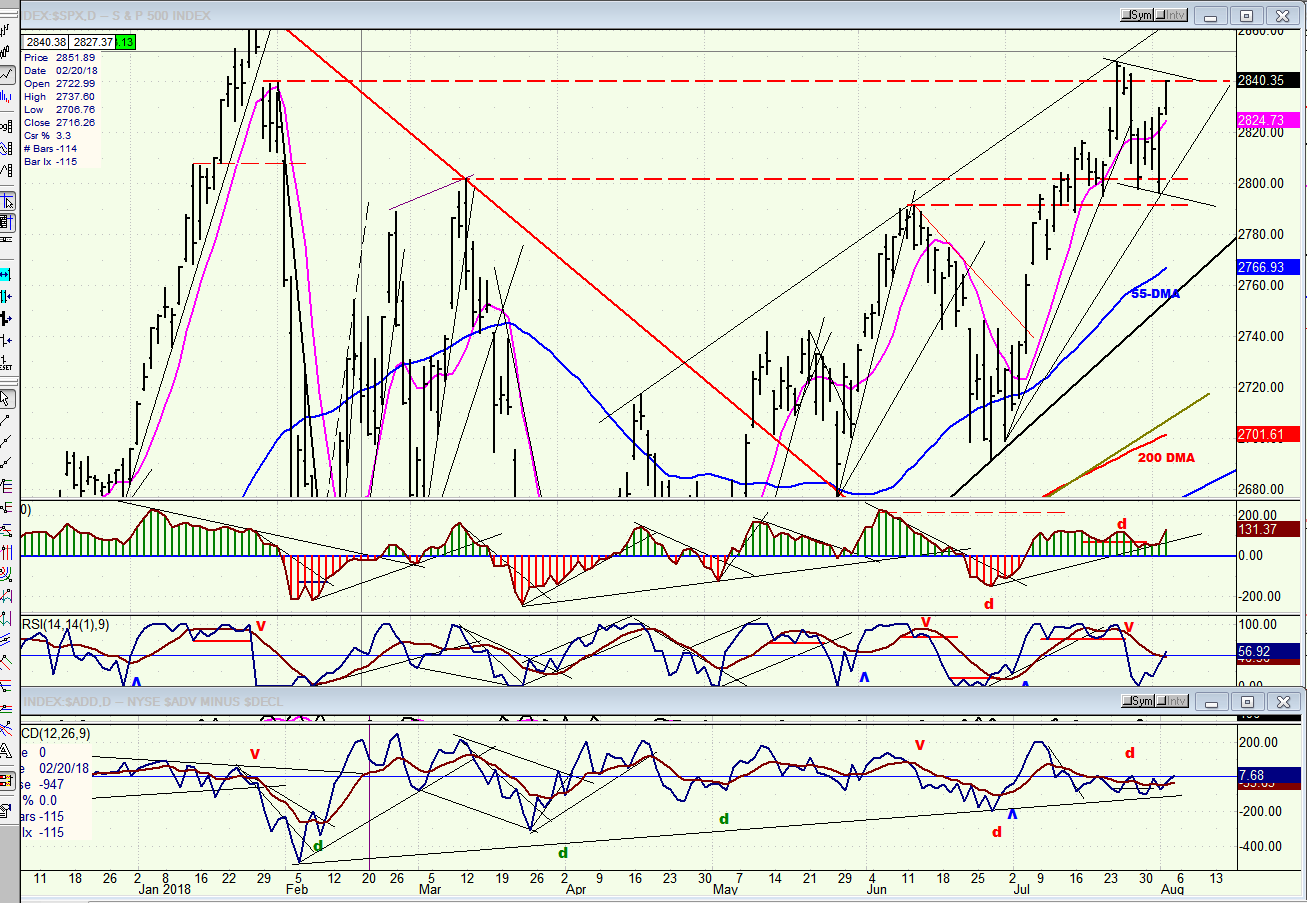
SPX Daily Chart
This is what the market action looks like on the chart. It’s easy to see why we found resistance at the 2848 level. We tried, but could not quite fill the open gap from the January high, and by the time we got there, we were not only stretched but also had completed a phase projection to 2848. The following correction was rapid, stopping at a support level provided by a former high from early March. After a bounce, the same support – buffered by another slightly lower – halted another attempt at extending the correction. Friday’s action took us right back to the resistance level which stopped us in the first place.
We are reaching that level in a short-term overbought condition, having come up nearly fifty points without a meaningful consolidation along the way. That, in itself, calls for some consolidation, and the bottoming of minor cycles on Monday practically ensures it. If this does not cause too much weakness, the index could then challenge 2848 and perhaps even fill the January gap by rising to 2852, but this is as high as I would expect it to go before additional consolidation takes place.
In the oscillators, the CCI remains positive while the other two are simply neutral, and if SPX goes past 2848 right away, additional negative divergence will form, at least in the lower two, so I am not convinced that it is ready for a significant extension of its uptrend at this time.
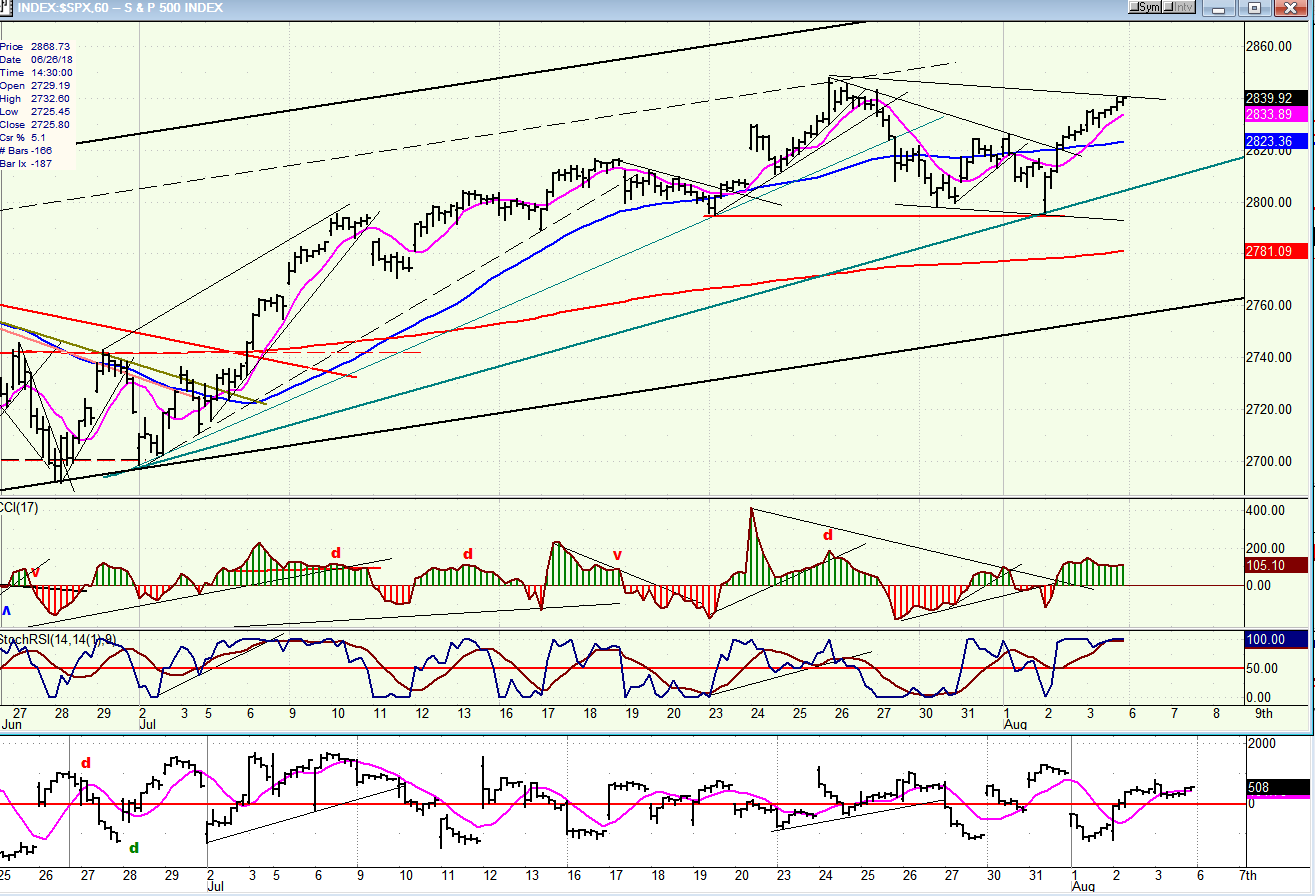
SPX Hourly Chart
There is not much that I can add to what I said above, except to repeat that the near-term looks overbought, and that condition should be relieved before we try to go higher. Since cycles occasionally invert, it’s possible that those due on Monday may do so, except that I don’t recall ever seeing a clear example of inversion in these minor cycles. Another possibility is that the upside momentum will be limited by something of larger magnitude pushing down on the market, and this would make more sense. There are many cycles, and since I only follow a few, there could be a longer one topping in this area which will cause some additional retracement. The short-term market profile looks more like a top that should be followed by a consolidation; so, we’d better wait until we see what transpires over the next few days before passing judgment on the market position.
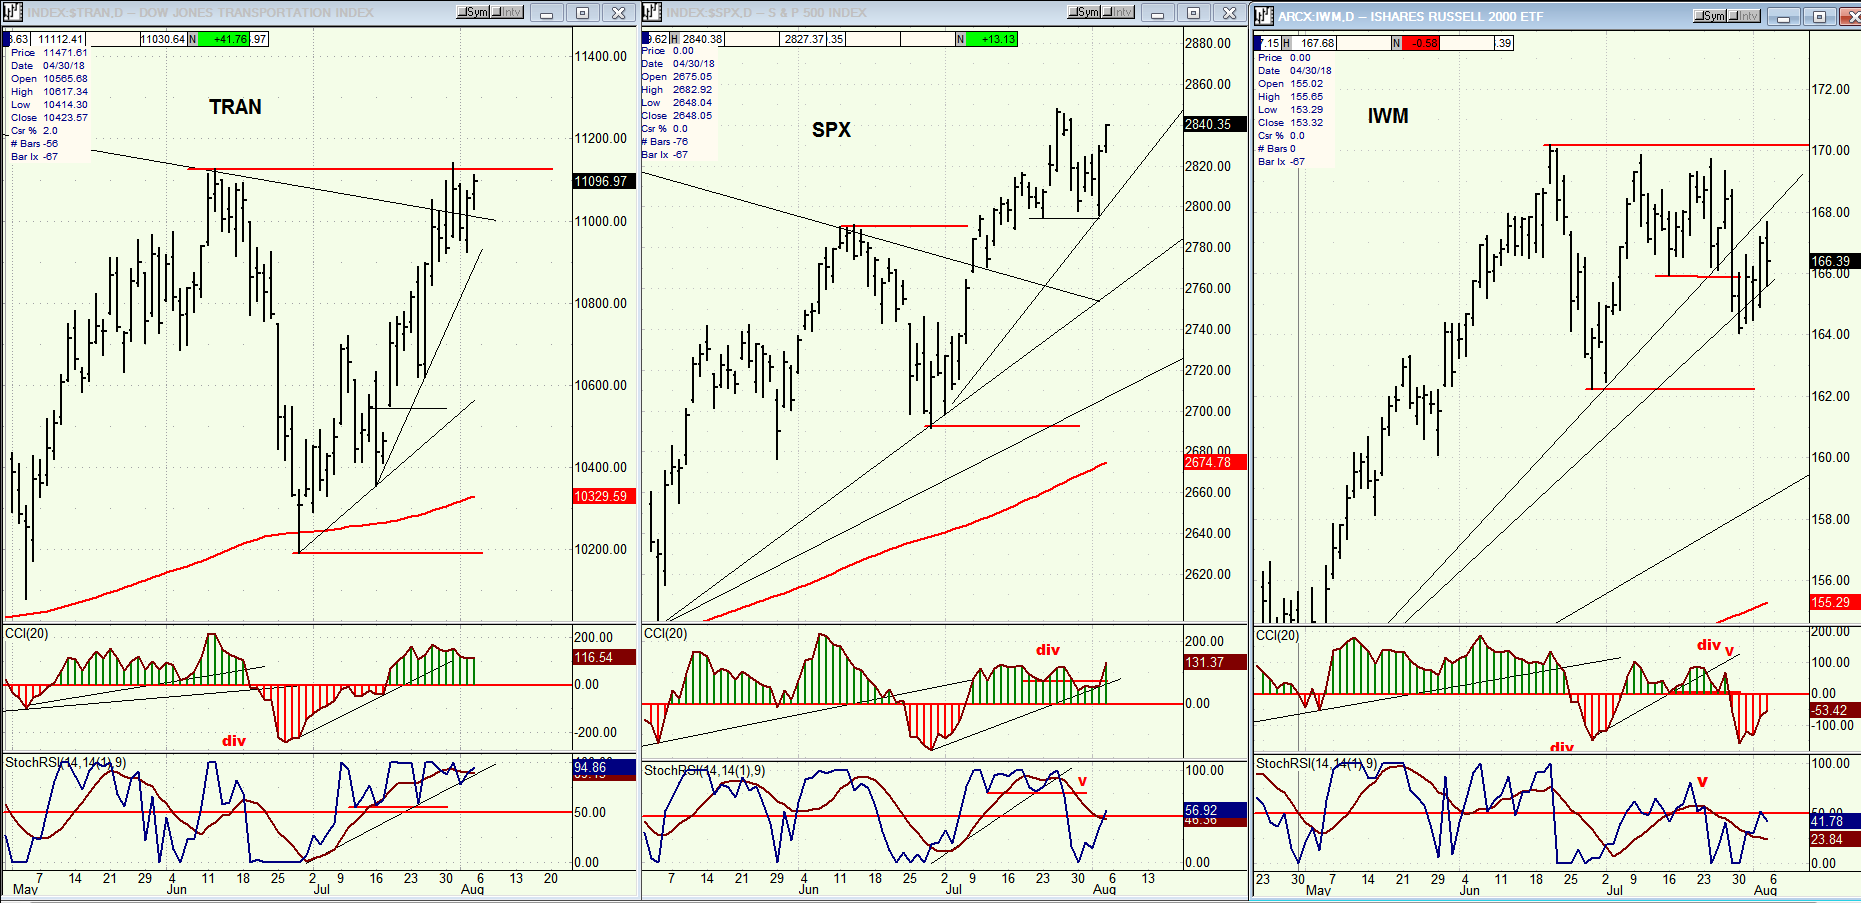
TRAN,SPX, IWM (Daily)
Perhaps the bigest draw-back to expecting a new high in SPX at this time is the relative weakness of IWM which increased last week as it dropped below the level where SPX found support, with its subsequent rally paling by comparison. The pattern that IWM is making looks more like it’s inclined to continue its correction than to resume its uptrend.
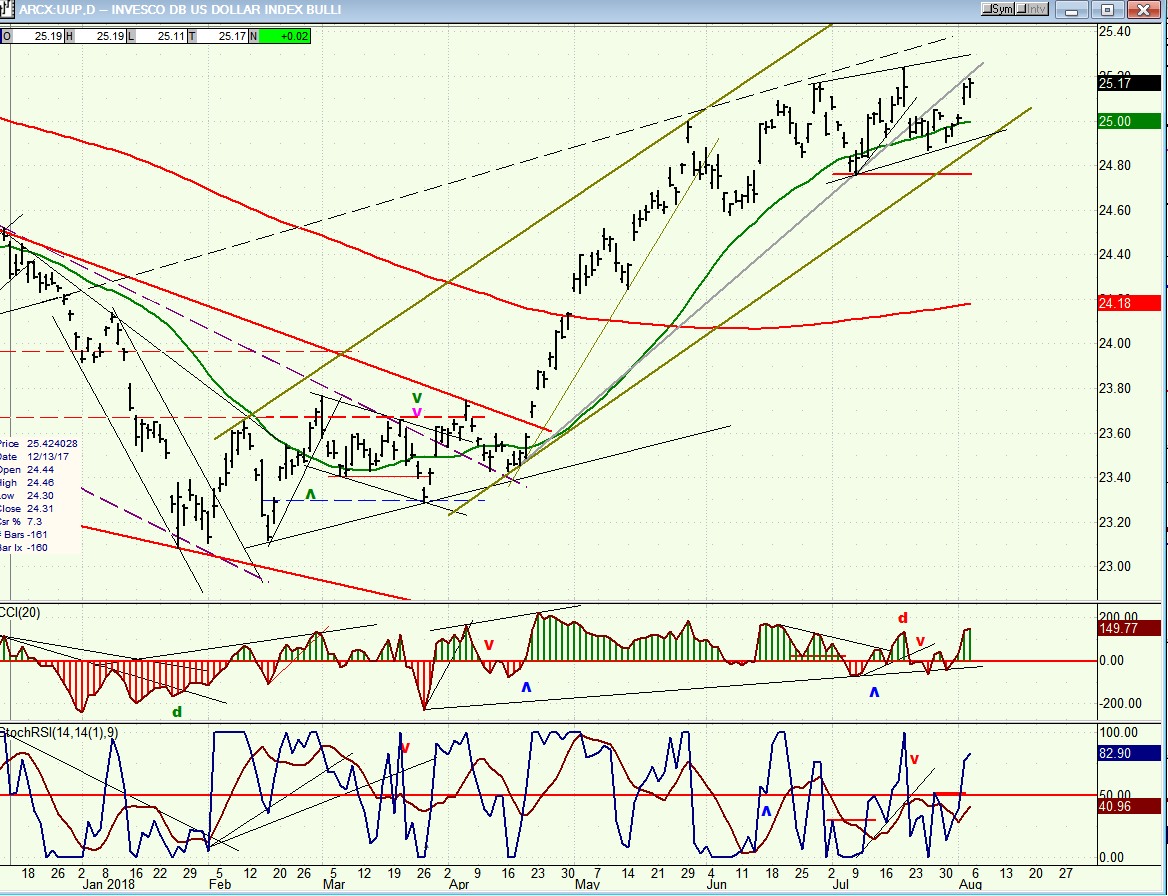
UUP (Dollar ETF) Weekly
It is still not clear if UUP is about to make a new high or if it is completing a topping formation that will shortly result in the beginning of a retracement below the horizontal red line. Next week should bring some clarification.
The dollar index P&F chart has formed a masive top formation which creates strong overhead resistance for the current rally which has only managed to rise to the lower level of that formation. Furthermore, a small base was created at the 89 level which appears to have filled its count at the curent price. That does not bode well for UUP continuing to rally from here, but we’ll need a confirmed reversal from its current level to show that it is, in fact, ready to start a downtrend.
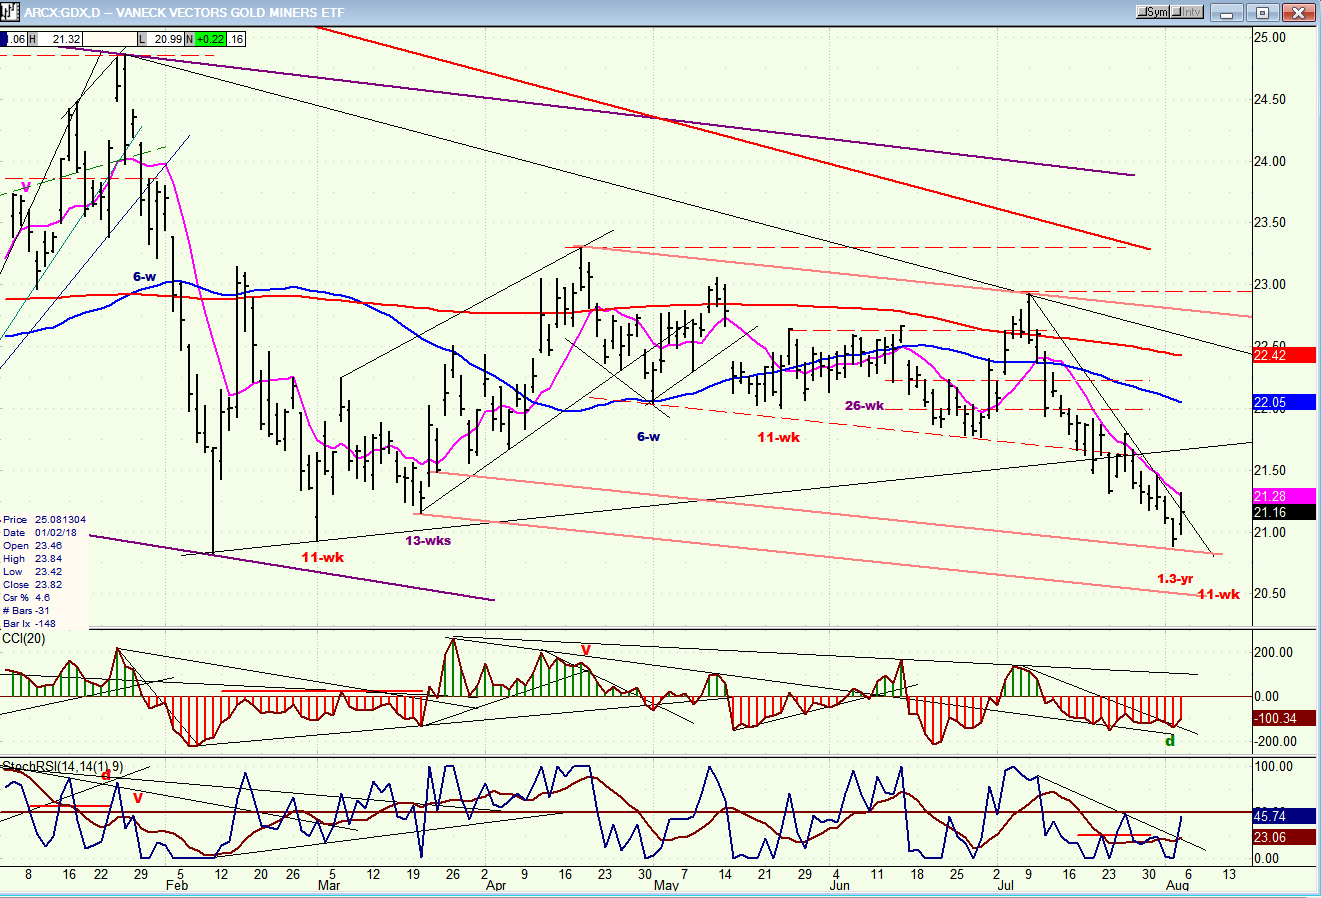
GDX (Gold Miners ETF)
GDX has reached what could be an ideal, 65-wk low, time frame. On Friday, it gave some encouraging signs that it may be reversing its downtrend, but much more will be needed to confirm this early warning. A move back to 21.50 would be encouraging, but it will not be until prints 23.50 that the bulls can at last start feeling hopeful that it is finally on its way to higher -- perhaps much higher -- prices.
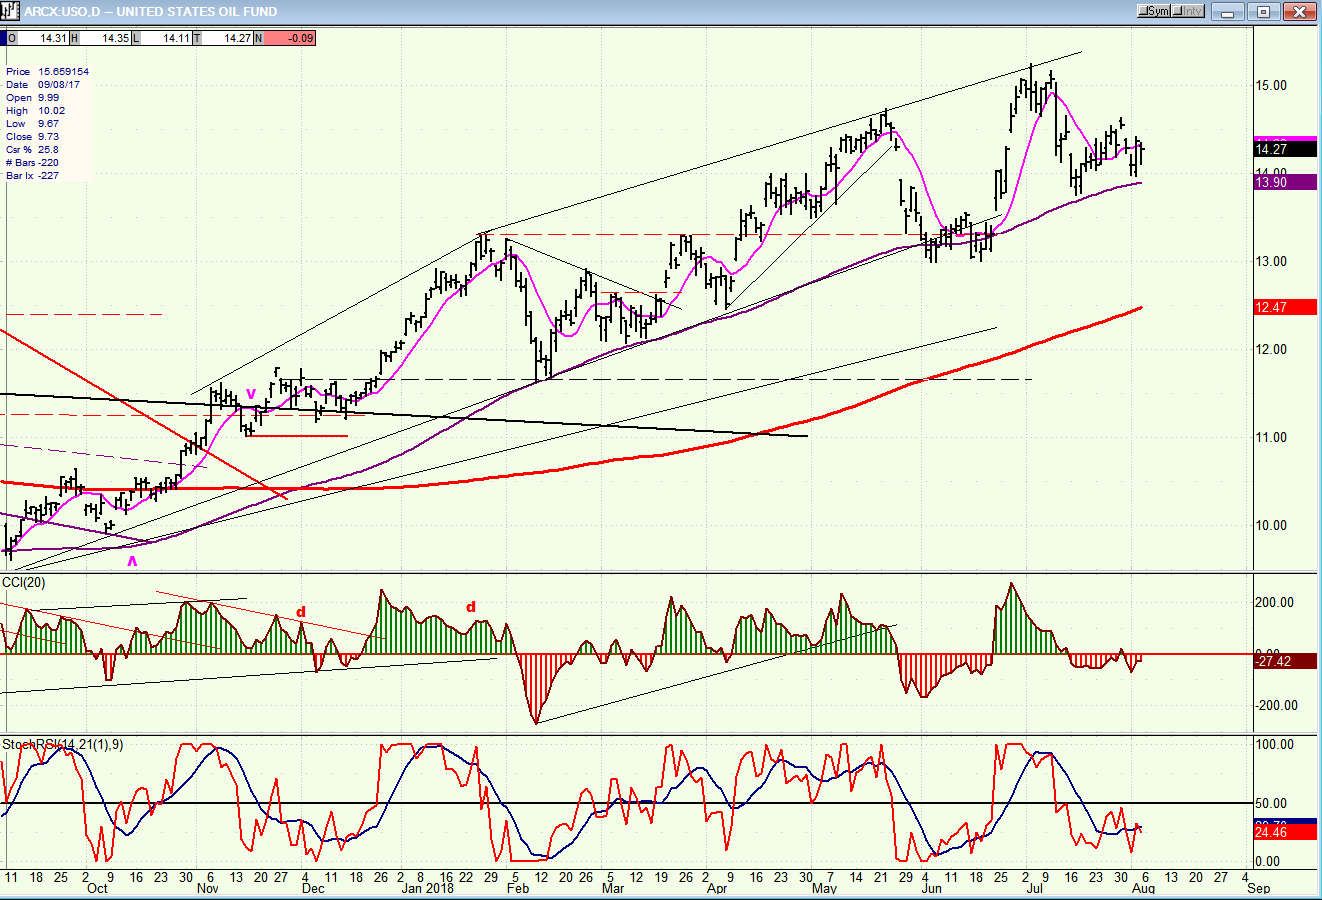
USO (United States Oil Fund)
USO continues to hold above its 89-DMA which has defined its uptrend ever since it rose above it, after making a secondary low of 8.65. This suggests that it is not ready for a meneangful reversal until it breaks below this MA and, even if it does, it may simply be entering a brief consolidation in an uptrend.
Summary
For now, we’ll take the apparent strength in SPX at face value, albeit with some reservation. The divergence between the various indices makes for a chaotic market environment. Moreover, it is not clear how long SPX can continue its bullish showing without assistance. As long as its recent base points to higher prices and the index remains above important trend lines, we should not look for major weakness to appear in the market; but nor should we get too bullish until the ambiguity in the near-term market direction is resolved.
FREE TRIAL SUBSCRIPTON
With a trial subscription, you will have access to the same information that is given to paid subscribers, but for a limited time period. I think you will find that knowing how far a move can carry is one of the most useful benefits of this service, whether you are a trader or an investor -- especially when this price target is confirmed by reliable indicators which give advance warning of a market top or bottom. Furthermore, cycle analysis adds the all- important time element to the above price projections.
For a FREE 4-week trial, further subscription options, payment plans, and for general information, I encourage you to visit my website at www.marketurningpoints.com.
The above comments about the financial markets are based purely on what I consider to be sound technical analysis principles. They represent my own opinion and are not meant to be construed as trading or investment advice, but are offered as an analytical point of view which might be of interest to those who follow stock market cycles and technical analysis.
*********

When Andre Gratian was a stock broker years ago, a friend introduced him to technical analysis of the market. Consequently, it is not an exaggeration to say that Andre fell in love with this approach! Ever since then, it has become an increasingly important part of his professional life. Gratian has studied the works of Wyckoff, Edwards & Magee, Edward J. Dewey (cycles) and many others. However, one of my most profitable undertaking has probably been to study Point & Figure charting, which he finds invaluable in analyzing stocks and indices. If he were restricted to one methodology, this is the one that he would choose. This well-rounded background has given him what he feels to be a special insight into the stock market, facilitating the recognition of meaningful patterns and the ‘turning points’ in all trends, whether they be short or long term. Andre feels very comfortable discussing the stock market and passing on meaningful information to others. His subscribers include individuals and money managers throughout the world. Moreover, his Newsletters are currently published on several financial sites, here and abroad.


