Technical Analysis Of The Markets


Current Position Of The Market
SPX: Long-term trend – The bull market is continuing with a top expected in the low 3000s.
Intermediate trend – A new correction has started. More time is needed to determine its extent and duration.
Analysis of the short-term trend is done on a daily basis with the help of hourly charts. It is an important adjunct to the analysis of daily and weekly charts which discusses the course of longer market trends.
Challenging Recent High
Market Overview
Last week, SPX filled the count established at the 2860 level by dropping to 2802, formed a small base, and rallied strongly on the news that there appeared to be a détente in the potential trade war between the US and China. Should these prove to be false expectations, the market will most likely react by reversing its short-term direction once again. From a purely technical basis, the count provided by the small accumulation base after the 2802 low has been filled to the extreme, and it is logical to expect a pull-back before re-testing the 2860 high. We need to see how much of a pull-back we get, and observe the market action afterwards to determine if we are indeed ready to surpass the current high, or if a deeper and larger retracement will be needed before doing so. Next week should help to clarify the market’s current position.
It might be noteworthy to point out that, for the second short-term correction in a row, SPX failed to retrace .382 of its previous rally. Is this the sign of a strong market, of one which is overbought and needs more correcting? Last week, I pointed out that DJIA was a laggard compared to other principal indexes but it just gave a strong performance. Since AAPL has become part of the DOW, the latter has become more volatile, and AAPL was exceptionally strong in this rally -- and so was the DOW. NDX was a laggard, but IWM will be the one to watch. It has been consolidating since the beginning of July and has established a large congestion pattern. If it breaks out on the upside, it should lead the market higher. On the other hand, a decline from here could lead to an extended correction.
Chart analysis (The charts that are shown below are courtesy of QCharts)
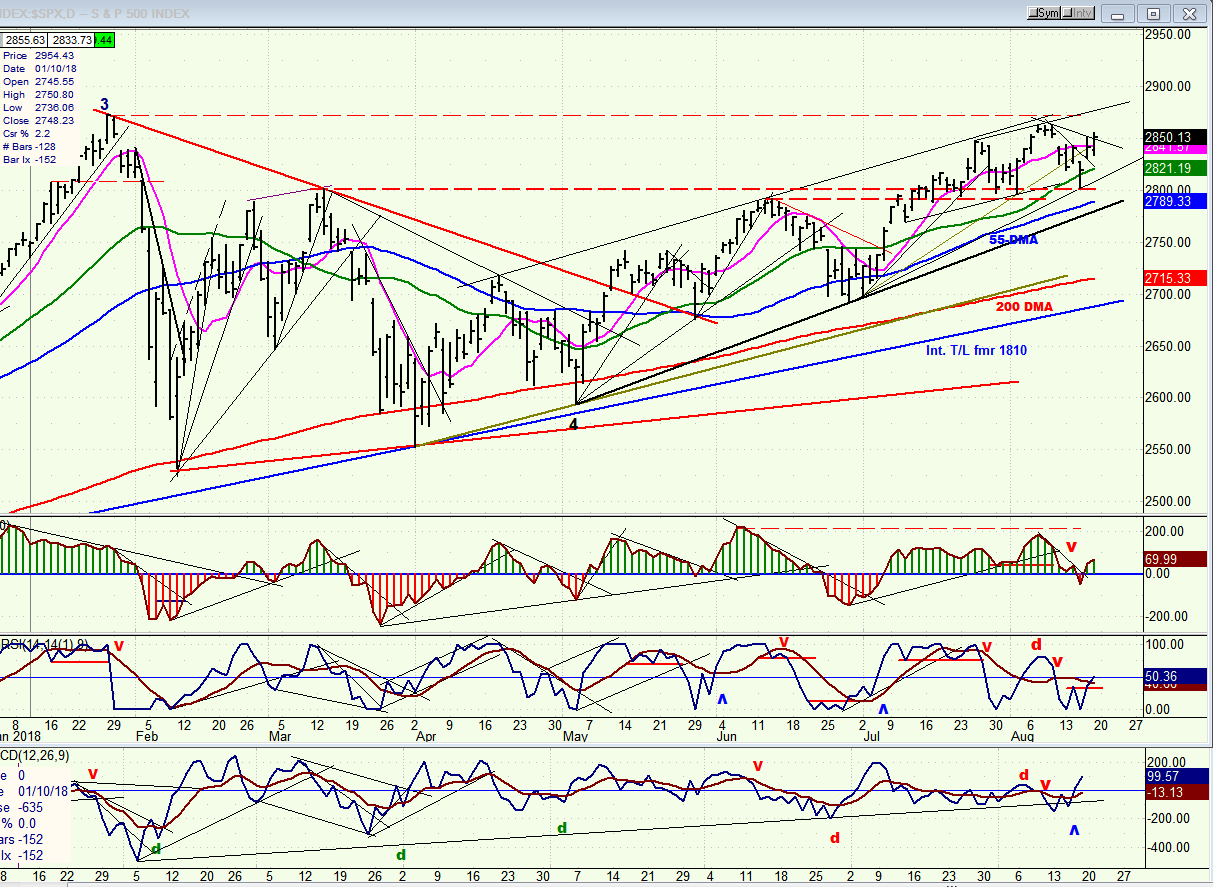
SPX daily chart
For the time being, SPX is ranging between the former high and the 2800 level, establishing strong support which would signal a larger and deeper correction if broken. But currently, our focus should be more on whether or not this index is on its way to making a new high. Two weeks ago, it came within less than 10 points of doing so. This week, it is trying again but has exhausted its current short-term potential to the upside. It will therefore require some retracement to eliminate the near-term overbought condition and create another launching platform for its next try. Next week should therefore be a period of preparation for another assault.
Since we should have another pull-back over the next few days, the daily indicators could easily turn negative again. But instead of putting all of our attention on this index, let’s keep an eye on IWM which has led the market in both directions lately and should continue to do so. It closed the week at 168.35 and a move past 170 would have bullish implications for the rest of the market. We’ll also have to keep another eye (?) on NDX and DJIA, since both of these have a direct influence on SPX. I just took a look at AAPL which seems to be very overbought with negative divergence in its daily indicators -- a warning that it may be ready for a pull-back and take DJIA with it.
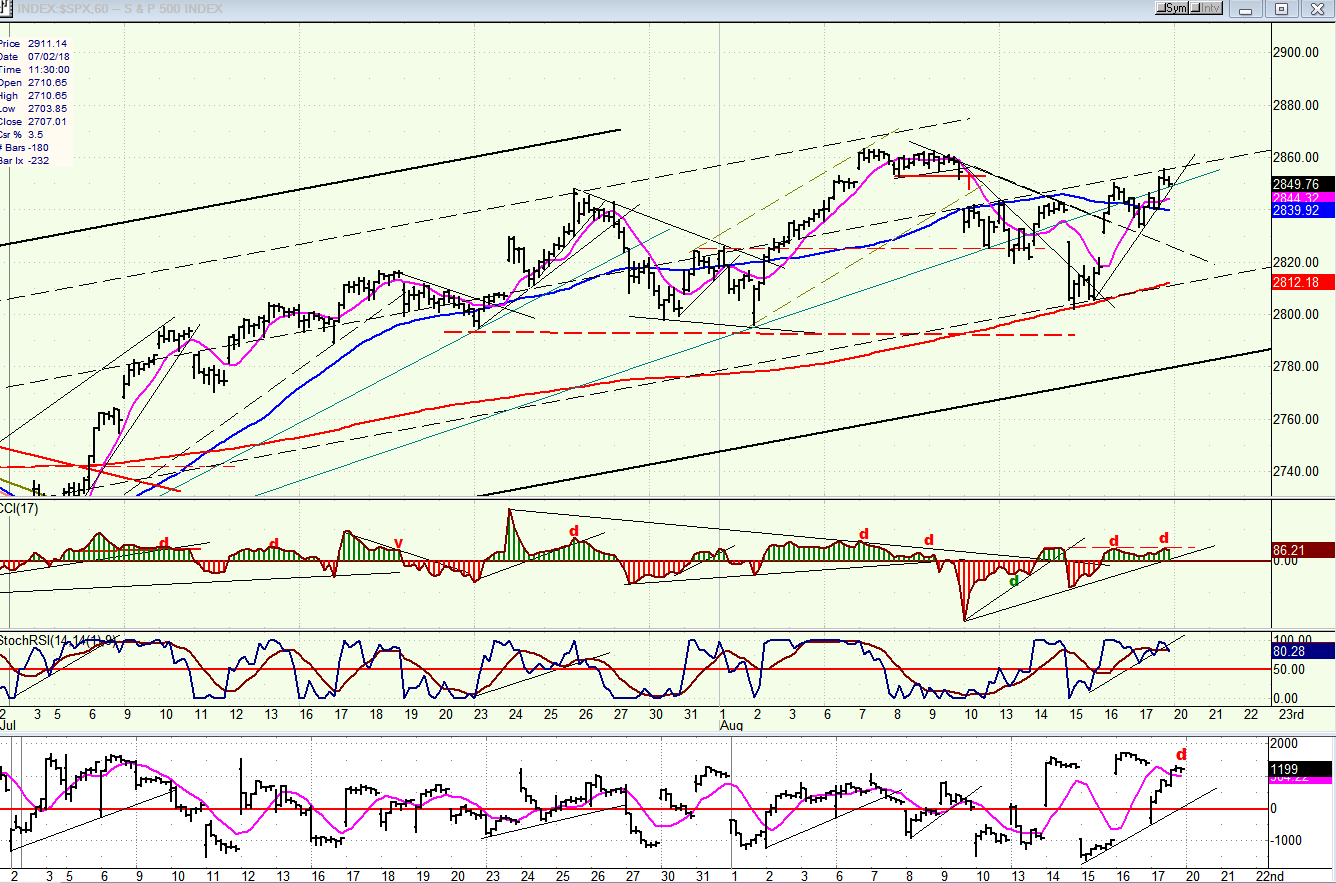
SPX hourly chart
As you can see, at the last low (2802) SPX did not have the time to create a very large base before the next news-driven rally started. It is likely that traders had advance notice and reacted immediately. Still, when translated to a P&F chart, there was enough of a count in that base to take it as high as it went on Friday. Meaning that we should start a correction right away or after a throw-over of a couple more points. It would be very unorthodox for the index to draw additional count from the pattern that formed just above the 2820 level so that it could push higher before correcting; but if there is more bullish news over the week-end, this is what could happen.
The oscillator pattern strongly suggests that what we already have is all we get for now. Double divergence has formed on the top oscillator (CCI) and this, under normal circumstances, suggests that a correction is about to start. After it gets under way, we can try to establish a projection for the extent of the retracement.
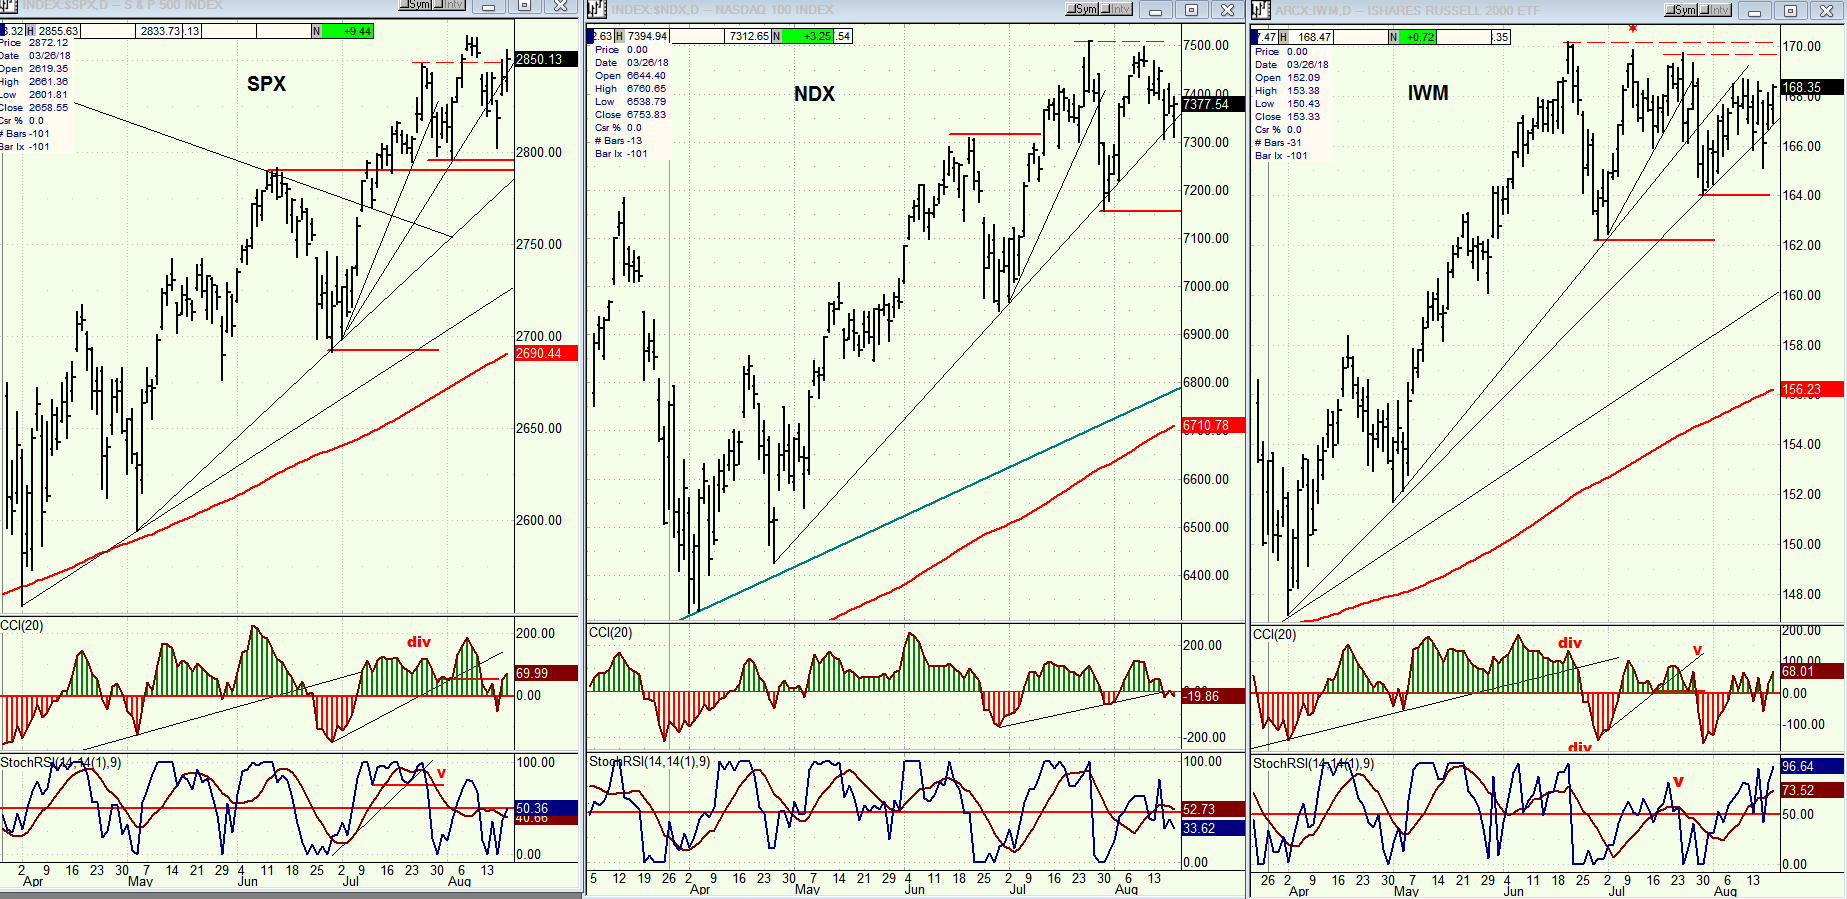
SPX, NDX, IWM (daily)
We are looking at the charts that we analyzed earlier. SPX was the strongest performer last week, but should now correct. IWM had a pull-back equivalent to that of SPX, but did not rally as strongly, stopping a little short of its last top while SPX exceeded it. NDX’s decline was curtailed when it found support on a trend line, resulting in a more shallow retracement than the other two. This relative strength in NDX should have led to an immediate challenge of its former high, but instead, it had the weakest rally of the three. That probably makes it more vunerable in the coming reversal since it is not ikely to hold again above the trend line. In any case, it had already established enough distribution to correct down to 7210. If it breaks its trend line, it could come down to that level in the next correction. If DJIA also corrects sharply along with a correction in AAPL, this will be a double whammy for SPX. So, the week ahead could be interesting.
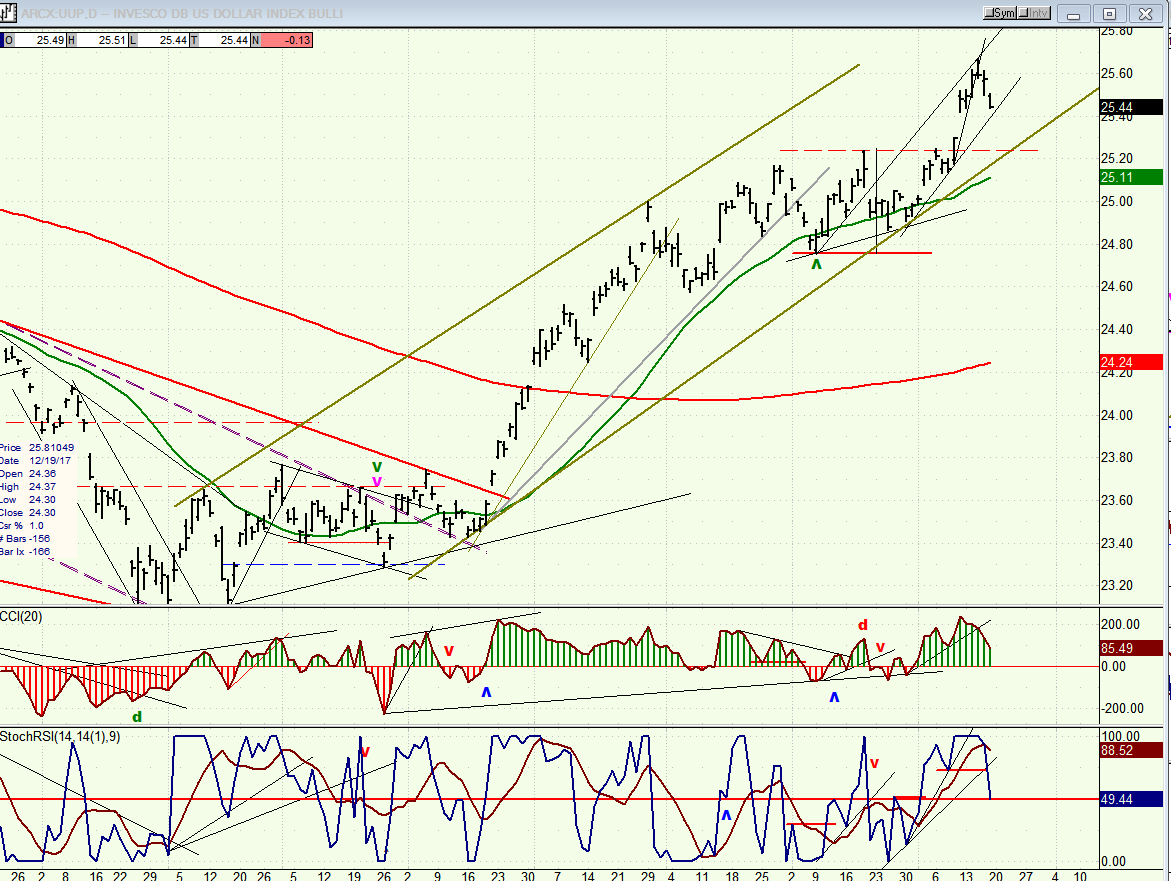
UUP (dollar ETF) daily
After surging to its P&F target of 25.50 (+ a few pennies), UUP is now starting to correct. Until it shows some real weakness it may still go a little higher, and it would have to decline below its trend line to begin a move down to the 24.80 support.
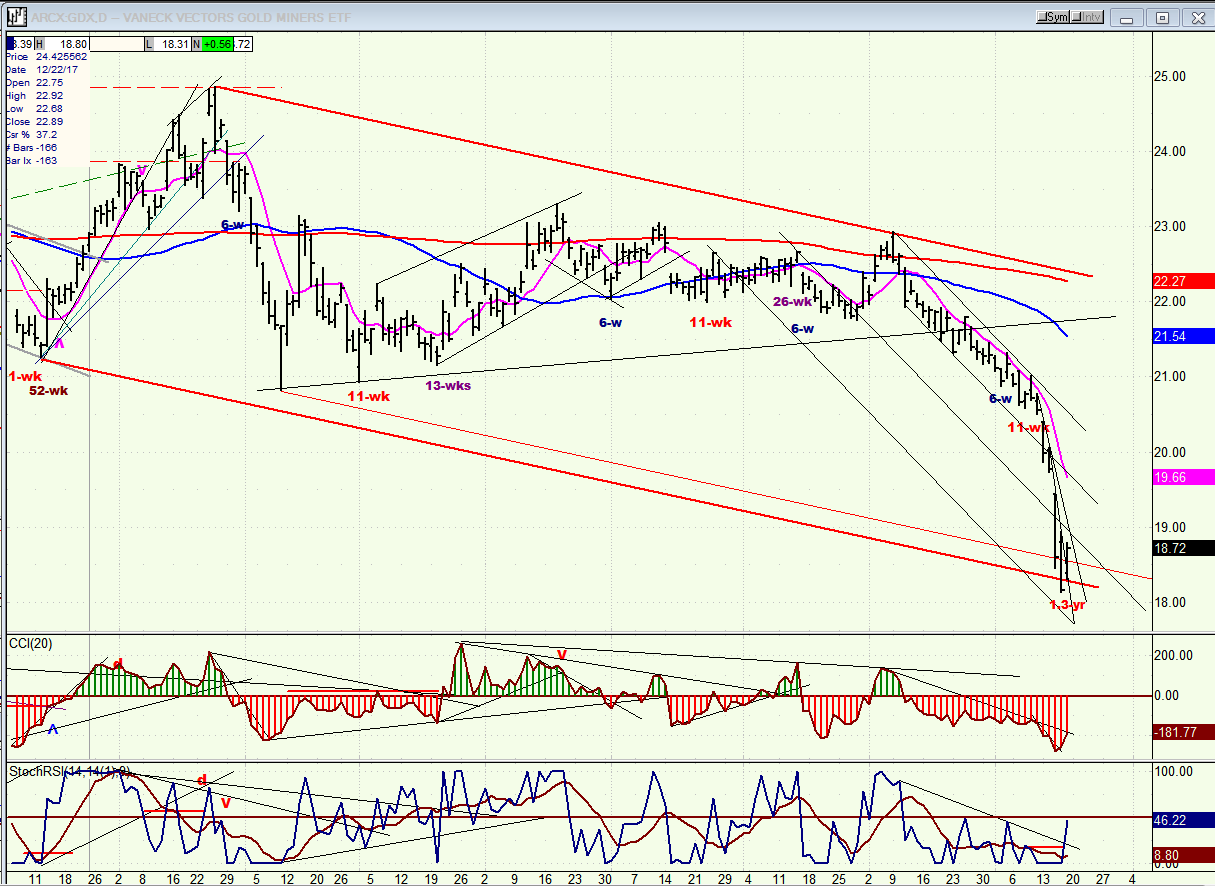
GDX (Gold miners ETF)
GDX has dropped to the bottom of a broad declining channel where it is beginning to find support. It is probably not a coincidence that this weakness corresponds to the time frame when the 65-wk cycle was due to make its low. Nor need this be the final low since there is the potential for a point or so lower. Friday marked the first up-day after a drop of about 20% without a single rally or even consolidation. Surely, the index is entitled to an oversold bounce. Even a minimum Fib retracement of .235 would bring it back to about 19.50. Eventually, a retracement of 50% would return it to the level of the broken support which is now resistance.
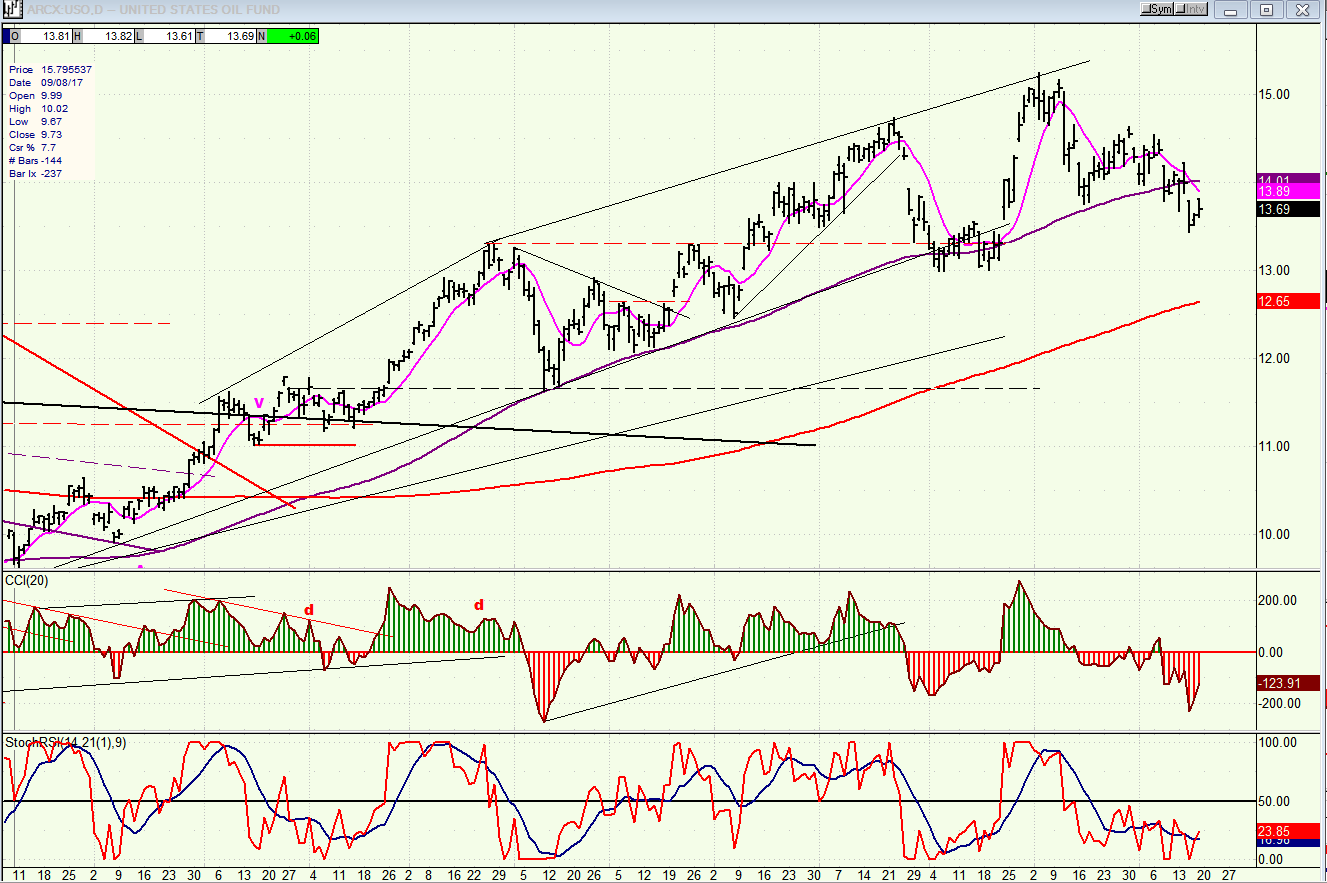
USO (United States Oil Fund)
USO has started its correction after reaching its 15+ target, and dropped to 13.50 last week before bouncing. It will probably have to get down to about 13.00 before it starts to consolidate in anticipation of continuing its longer-term uptrend.
Summary
Last week, SPX corrected down to 2802, filling the count of the distribution pattern established at 28.60, and rallied back to 2855 which should be about all we get for now. Divergence at the hourly level also suggests that we are ready for a near-term reversal. Next week’s action should determine whether or not we are ready to challenge the high at this time. If we are not, some extended and perhaps deeper correction may be required before we do.
*********
FREE TRIAL SUBSCRIPTON
With a trial subscription, you will have access to the same information that is given to paid subscribers, but for a limited time period. I think you will find that knowing how far a move can carry is one of the most useful benefits of this service, whether you are a trader or an investor -- especially when this price target is confirmed by reliable indicators which give advance warning of a market top or bottom. Furthermore, cycle analysis adds the all- important time element to the above price projections.
For a FREE 4-week trial, further subscription options, payment plans, and for general information, I encourage you to visit my website at www.marketurningpoints.com.
The above comments about the financial markets are based purely on what I consider to be sound technical analysis principles. They represent my own opinion and are not meant to be construed as trading or investment advice, but are offered as an analytical point of view which might be of interest to those who follow stock market cycles and technical analysis.

When Andre Gratian was a stock broker years ago, a friend introduced him to technical analysis of the market. Consequently, it is not an exaggeration to say that Andre fell in love with this approach! Ever since then, it has become an increasingly important part of his professional life. Gratian has studied the works of Wyckoff, Edwards & Magee, Edward J. Dewey (cycles) and many others. However, one of my most profitable undertaking has probably been to study Point & Figure charting, which he finds invaluable in analyzing stocks and indices. If he were restricted to one methodology, this is the one that he would choose. This well-rounded background has given him what he feels to be a special insight into the stock market, facilitating the recognition of meaningful patterns and the ‘turning points’ in all trends, whether they be short or long term. Andre feels very comfortable discussing the stock market and passing on meaningful information to others. His subscribers include individuals and money managers throughout the world. Moreover, his Newsletters are currently published on several financial sites, here and abroad.
More from Gold-Eagle


