Technical Analysis Of The Markets


Current Position of the Market
SPX: Long-term trend – The bull market is continuing with a top expected in the low 3000s.
Intermediate trend – Another correction has started which could conceivably continue into mid-October.
Analysis of the short-term trend is done on a daily basis with the help of hourly charts. It is an important adjunct to the analysis of daily and weekly charts which discusses the course of longer market trends.
Will Support Hold?
Market Overview
Last week was marked by a sharp correction in NDX, while DJIA held up well. SPX, which is a kind of hybrid of the two, logged in six consecutive days of decline spanning a total of almost 50 points. The last two days entered a zone of support which ranges from 2854 to 2873, but since the index closed the week at 2872, no serious technical damage has yet been done.
Both SPX and NDX have so far, built congestion zones which could serve as bases capable of sending them to retest their recent highs, if this is where this phase of the correction ends. After that the correction should extend into mid-October which is both the anticipated low of the next 20-week cycle, as well as a notoriously weak period for stock prices.
Furthermore, the period of comments and objections regarding the decision to impose an additional $200 billion in tariffs on China concluded last week with Trump re-asserting that he intended to do just that; but there are normally two to three weeks of evaluation before that decision is finalized. This could be the catalyst which causes the correction to continue into mid-October.
Chart analysis (The charts that are shown below are courtesy of QCharts)
SPX daily chart
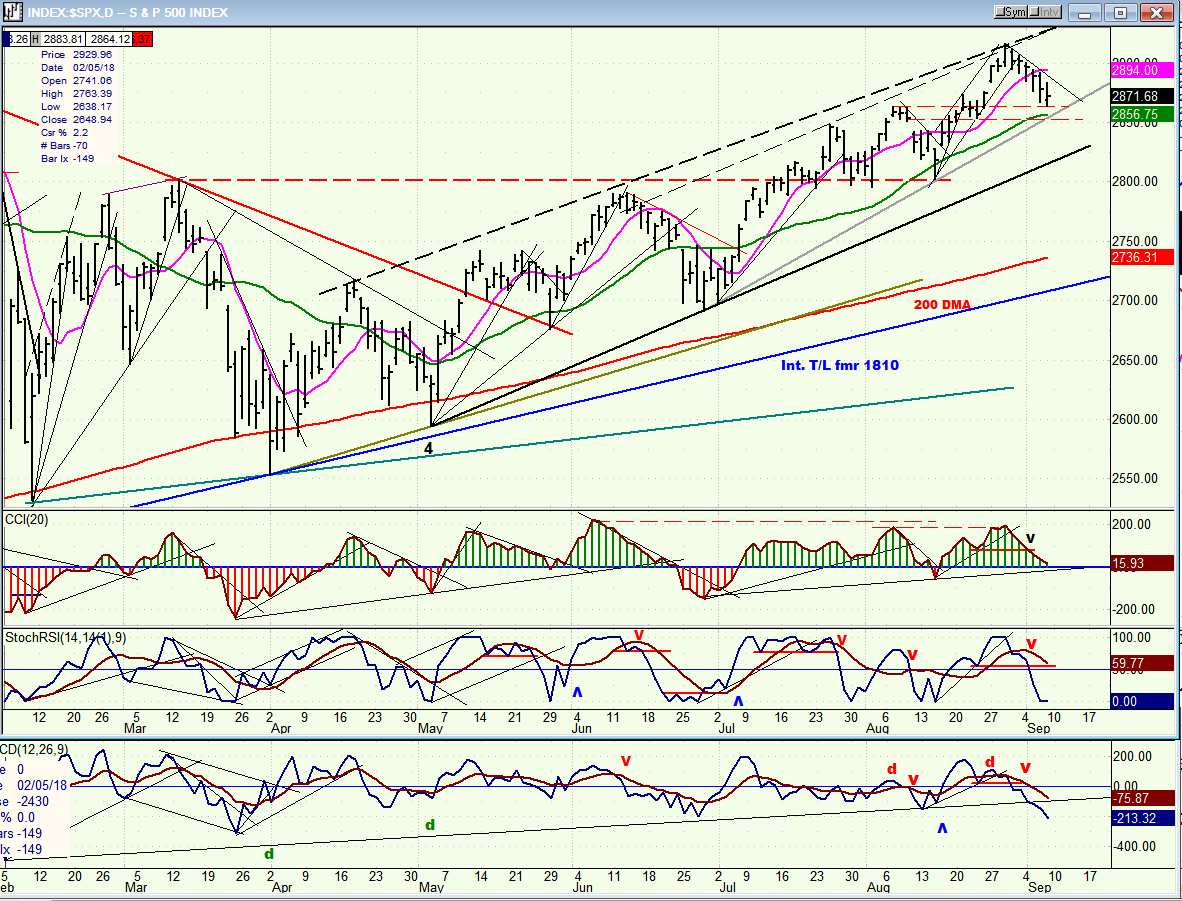
The support zone under the current SPX price is outlined in dashed red parallels. So far, the index has only scratched the surface, but if it moves deeper right away it will encounter even more support in the form of a trend line as well as the (green) 30-dma. The target for this phase of the correction was gauged at 2860-2855. There is, therefore, a little more room for the decline to come to a temporary rest on the bottom of the support level, but doing so would alter the congestion pattern as well as the count suggesting a retest of the highs.
If I am right about this correction lasting into mid-October we should probably expect an a-b-c pattern with the a-wave concluding at about 2855. The b-wave would start as soon as the short-term downtrend line is broken, and the c-wave could take prices at least down to the next (more) important trend line. We can get a better idea of the ultimate downside projection if another phase of distribution has formed representing the top of the b-wave, and after a c-wave has begun to manifest itself. The rationale for a corrective move being underway is that longer-term projections point to a target in the low 3000s before the bull market ends.
All the oscillators are declining and the two lower ones have already given a sell signal; the third one must become red to confirm that more than a short-term correction is in play. Next week should give us more information.
SPX hourly chart
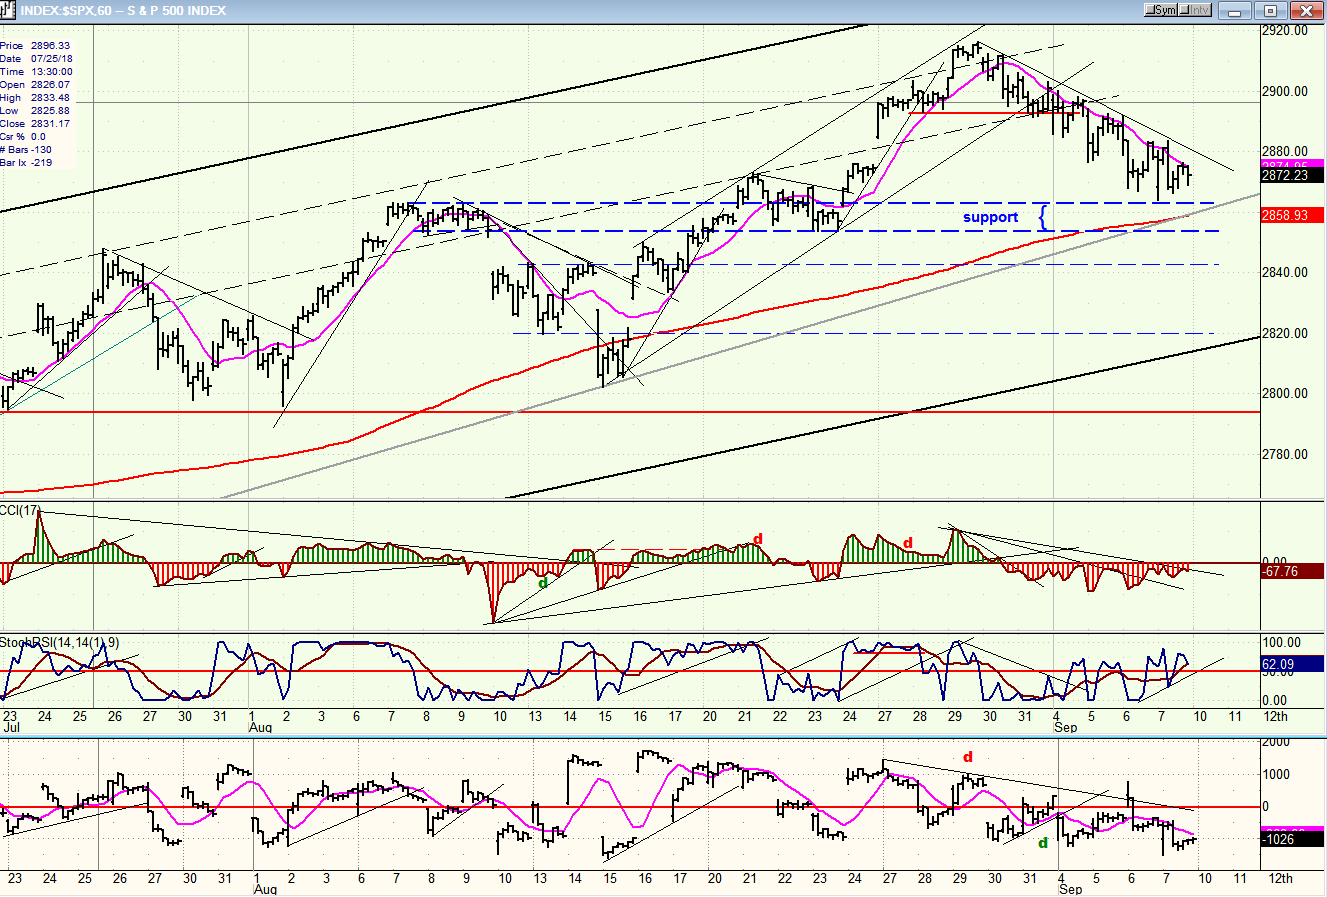
It would be difficult to find a more orderly correction pattern. It is made up of small declines followed by small rallies taking place within a larger channel delineated by the two heavy trend lines. The bottom channel line starts at 2594 which is the low of the wave 4 correction in early May, and connects with the late June low of 2692. With this trend line currently running a little lower than 2820, a wave-a low of about 2855 would remain well above it. But if we are destined to have an a-b-c correction into mid-October, it is not unconceivable that the c-wave could drop down to that lower channel line -- and perhaps even outside of it -- as the overall advance shows a normal deceleration phase before going for the final top.
The oscillators reflect the corrective pattern with the SRSI oscillating with each short wave, while the CCI remains negative and the A/Ds stay primarily in the red. All three should become positive as we start on the assumed b-wave. There is a good possibility that we could end wave-a around 2855 by the middle of the week.
SPX, NDX, DJIA,IWM (daily)
The index charts comparison shows that DJIA was the first to make a new high, followed one day later by IWM. Keep in mind however, that for DJIA that was only a recovery high, since it is still some 700 points below its January top. For IWM, it was a new all-time high. SPX followed it a day later, but it took NDX a whole week to catch up, and catch up it did, with a strong rally. But even after NDX made a powerful breakout, I became suspicious of this move’s carrying power because IWM was struggling to follow through. So, true to its reputation as a leader, it did signal a new high, as well as the end of the rally by its refusal to move ahead aggressively, even though it had forged a strong base pattern which pointed to higher highs on its P&F chart.
Now, NDX has become the weakest index as heavy profit-taking has hit the tech complex. The SRSI of all four indices show no sign that the decline is over, confirming what the top distribution pattern is saying: we should still have another 15 points or so to go before we arrive at the low of wave-a.

UUP (dollar ETF) weekly
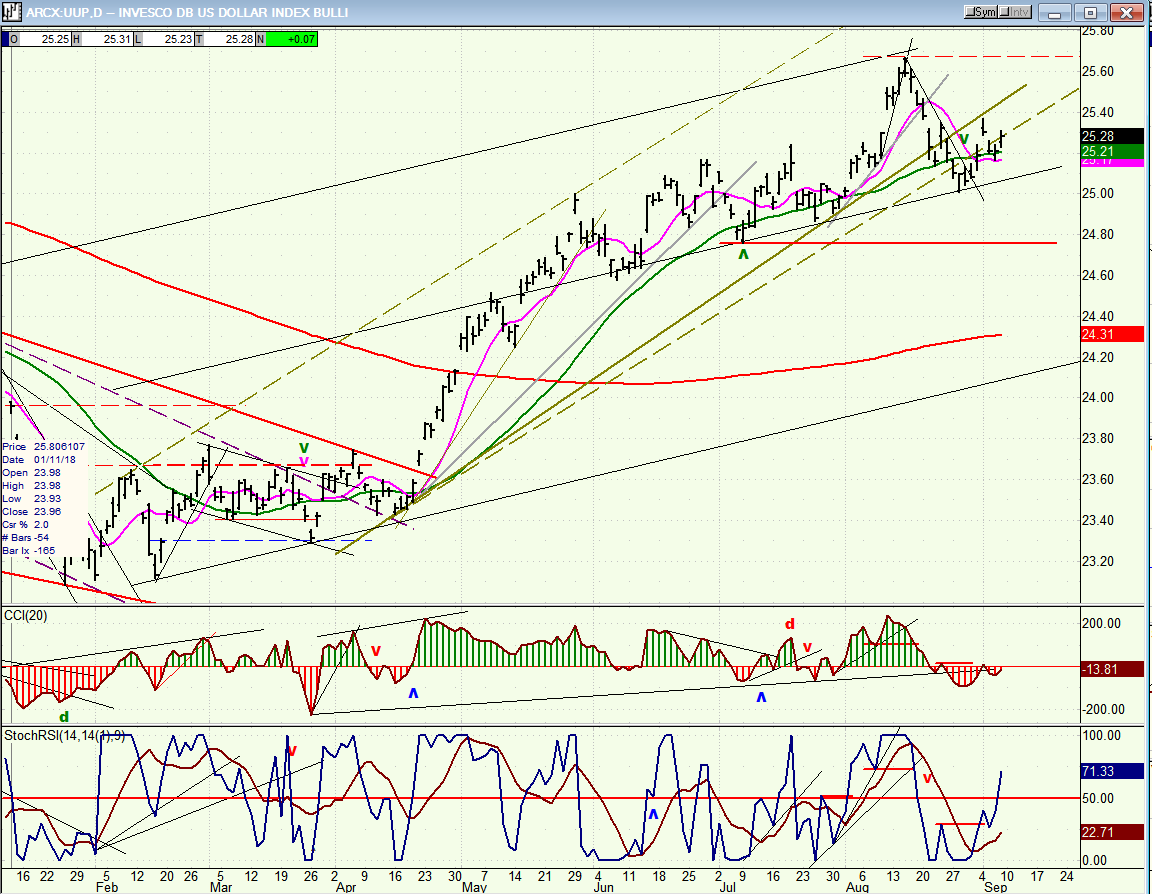
UUP found initial support just above 25.00 before bouncing. Best guesstimate is that it will first touch 25.00 before additional distribution takes place above that level.
GDX (Gold miners ETF) weekly
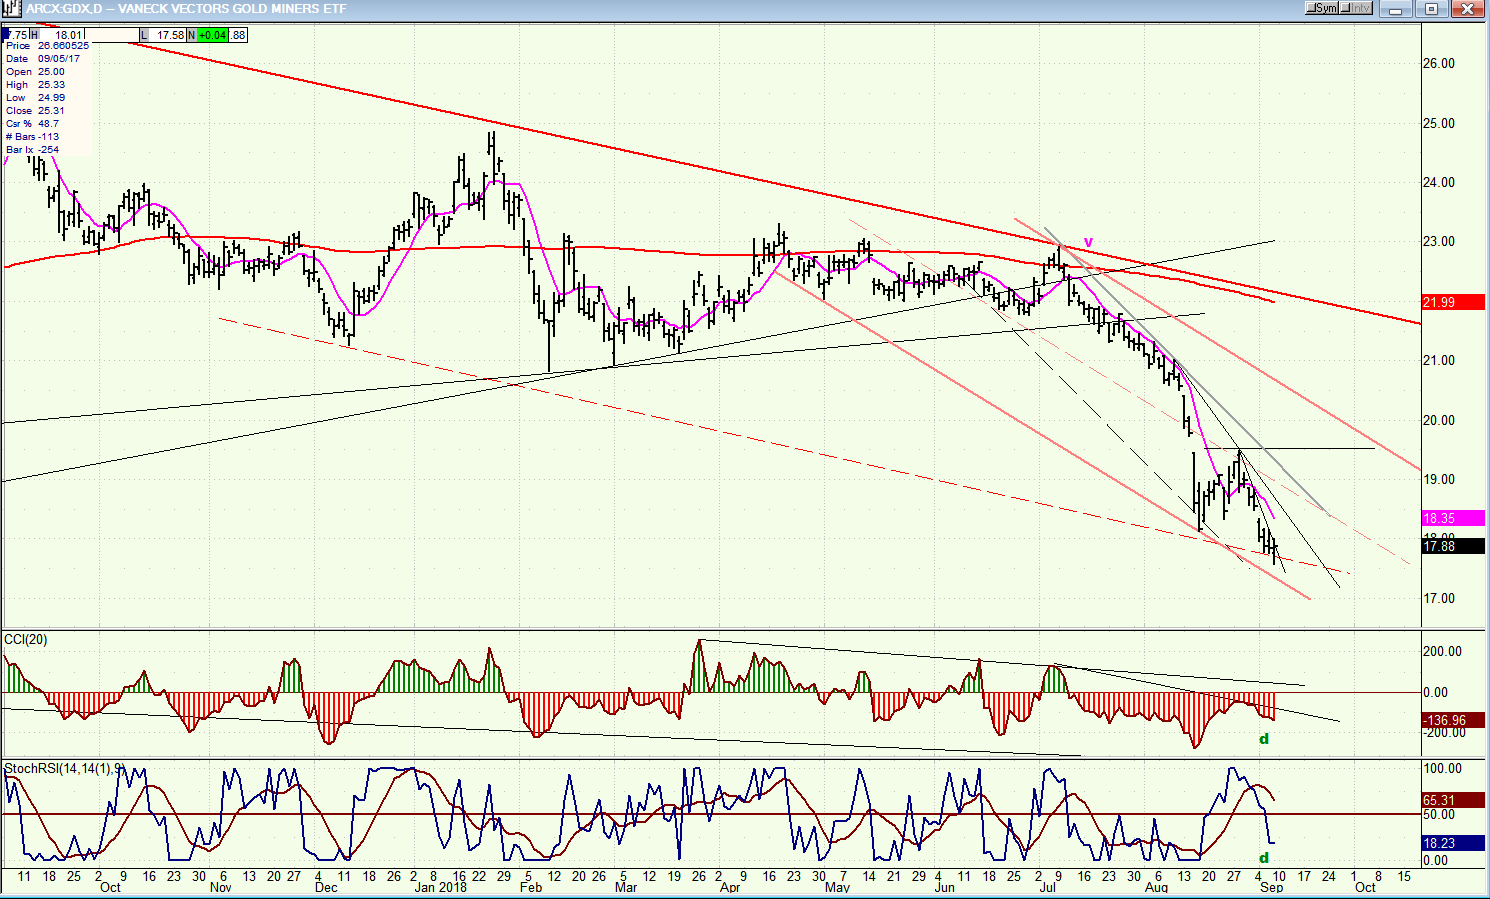
If the next tariffs implementation is delayed by two or three weeks, it would allow GDX to bounce from its low as it continues to construct a P&F base capable of supporting a meaningful rally.
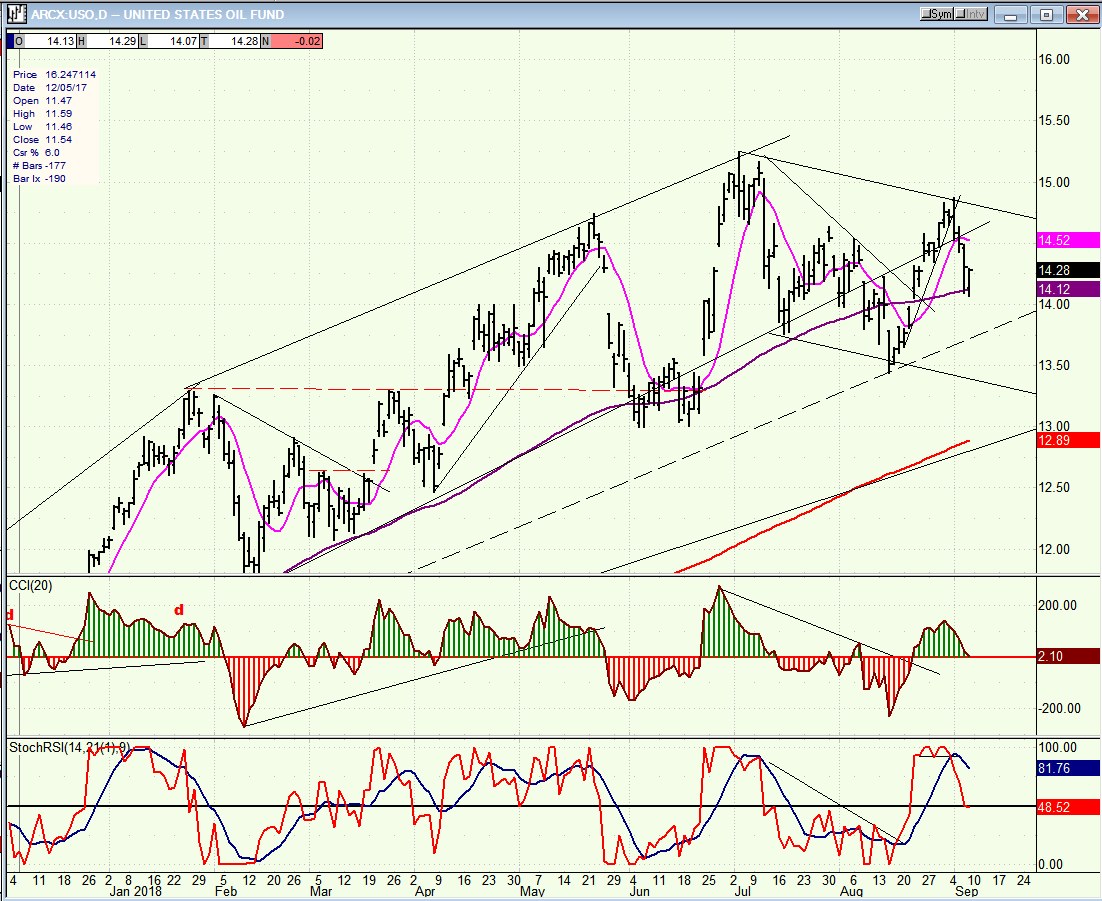
USO (United States Oil Fund)
I believe that USO is engaged in a consolidation/correction which will take it to 13.50-13.00 before it is over.
Summary
SPX has started a correction, which could last into mid-October.
*********
FREE TRIAL SUBSCRIPTON
With a trial subscription, you will have access to the same information that is given to paid subscribers, but for a limited time period. I think you will find that knowing how far a move can carry is one of the most useful benefits of this service, whether you are a trader or an investor -- especially when this price target is confirmed by reliable indicators which give advance warning of a market top or bottom. Furthermore, cycle analysis adds the all- important time element to the above price projections.
For a FREE 4-week trial, further subscription options, payment plans, and for general information, I encourage you to visit my website at www.marketurningpoints.com.
The above comments about the financial markets are based purely on what I consider to be sound technical analysis principles. They represent my own opinion and are not meant to be construed as trading or investment advice, but are offered as an analytical point of view which might be of interest to those who follow stock market cycles and technical analysis.

When Andre Gratian was a stock broker years ago, a friend introduced him to technical analysis of the market. Consequently, it is not an exaggeration to say that Andre fell in love with this approach! Ever since then, it has become an increasingly important part of his professional life. Gratian has studied the works of Wyckoff, Edwards & Magee, Edward J. Dewey (cycles) and many others. However, one of my most profitable undertaking has probably been to study Point & Figure charting, which he finds invaluable in analyzing stocks and indices. If he were restricted to one methodology, this is the one that he would choose. This well-rounded background has given him what he feels to be a special insight into the stock market, facilitating the recognition of meaningful patterns and the ‘turning points’ in all trends, whether they be short or long term. Andre feels very comfortable discussing the stock market and passing on meaningful information to others. His subscribers include individuals and money managers throughout the world. Moreover, his Newsletters are currently published on several financial sites, here and abroad.


