Technical Analysis Of The Markets


Current Position of the Market
SPX: Long-term trend – Has the bear market started?
Intermediate trend – The correction has turned into a short-term debacle which may not be over.
Analysis of the short-term trend is done on a daily basis with the help of hourly charts. It is an important adjunct to the analysis of daily and weekly charts which discusses the course of longer market trends.
Is the Bull Dead?
Market Overview
When I warned to be cautious about the September/October seasonal weakness, I had no idea that it would turn into a 229-point debacle for the SPX. Although it was 110-points short of the January plunge, the timing of this selling spell is a greater cause for concern. Going into January 2018, there were expectations that we were more than ready for wave 4 of the uptrend which started in January 2016, but as we approached the end of the year, it was the top of that 3-year bull phase that we were anticipating. So, has it arrived? Has wave 5 (from Jan. 2016) fallen a little short of its 3000 projection?
The simplest way to make that determination is to see if the trend line drawn from the 1810 level has been violated. As of Friday, of the four indexes we follow only IWM had closed decisively below that trend line. SPX, so far, only breached it, and closed above with Friday’s rally, as did DJIA and NDX. Furthermore, as we will see later on, these last two indexes have two separate trend lines to consider, which makes this simple form of analysis a little more complicated. Absolute confirmation would come when the SPX wave 4 low of 2595 has been broken. This would require extending the current decline by another 120 points.
Chart Analysis (The charts that are shown below are courtesy of QCharts)
SPX daily chart
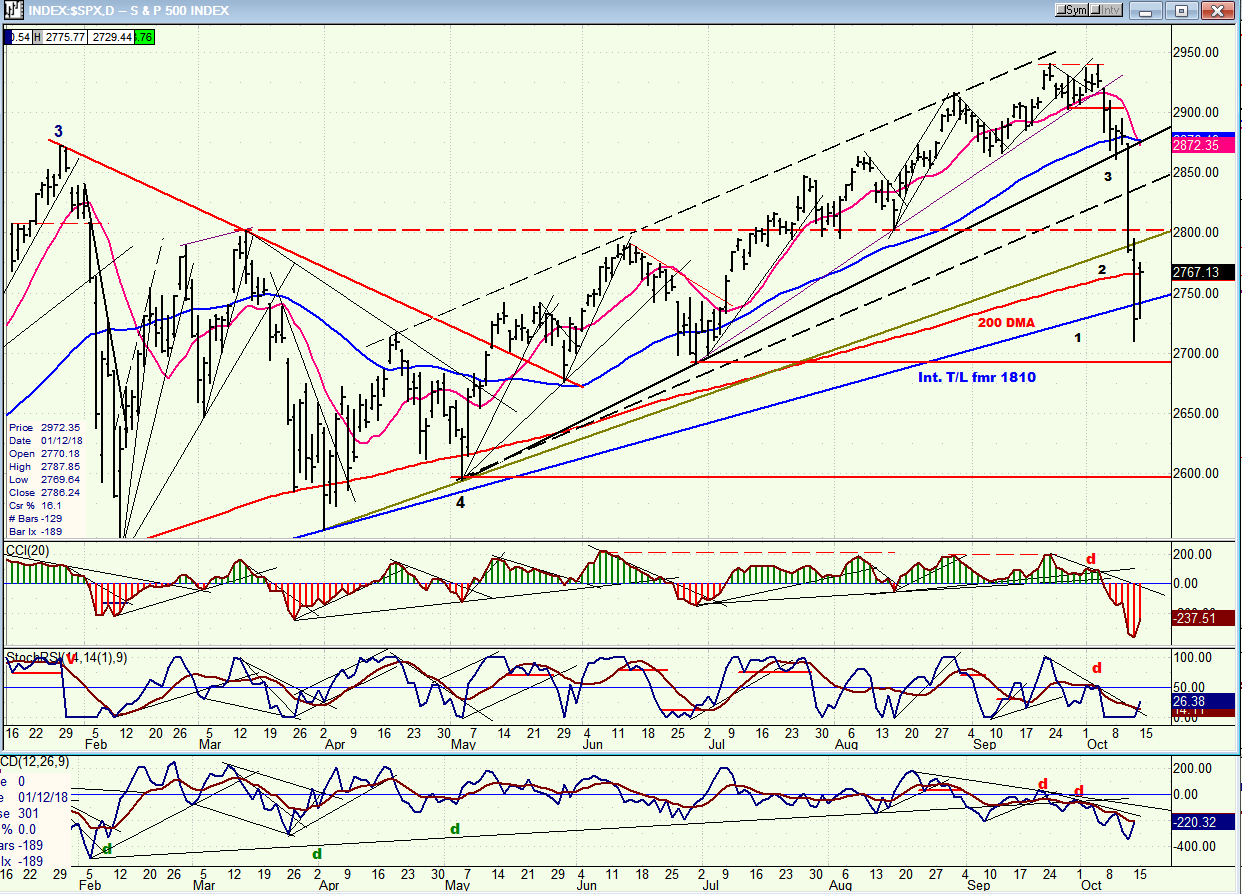
A week ago Friday, SPX came to rest on trend line #3 and I mentioned that, so far, the correction was not a very big deal. After this week, I certainly can no longer make that claim! I had also mentioned that before the index gave us a serious warning that the bull market had ended, it would have to break all three trend lines, with #1 giving us the final clue. As you can see, it was breached on Thursday but Friday’s price closed well above it. Similarly, the 200-dma was also breached but not broken. 2700 should be the first important former low to break after the trend line. Closing below it would be a minimal expectation for a major sell signal to be given. Until it is, we should give the market the benefit of the doubt that it remains in a bull phase, and “doubt” is probably the correct word to use.
To prove that it is still capable of reaching the 3000 price projection, the index would have to jump through several hoops! The most immediate one will be to overcome the resistance level which starts at about 2800. That resistance essentially continues all the way to the top. I believe that the only way the 2941 high could be overcome would be for SPX to create a congestion pattern capable of producing a count measuring nearly 300 points. Whether this phase of the correction completes at this level or lower, it will be followed by a countertrend rally which, if we have started a bear market, will fall short of the former high when it reverses.
As of Friday, the daily momentum and breadth oscillators were not giving the slightest hint that the correction is complete and that the index was ready to resume its uptrend. Consequently, the odds of seeing lower prices are very good.
SPX hourly chart
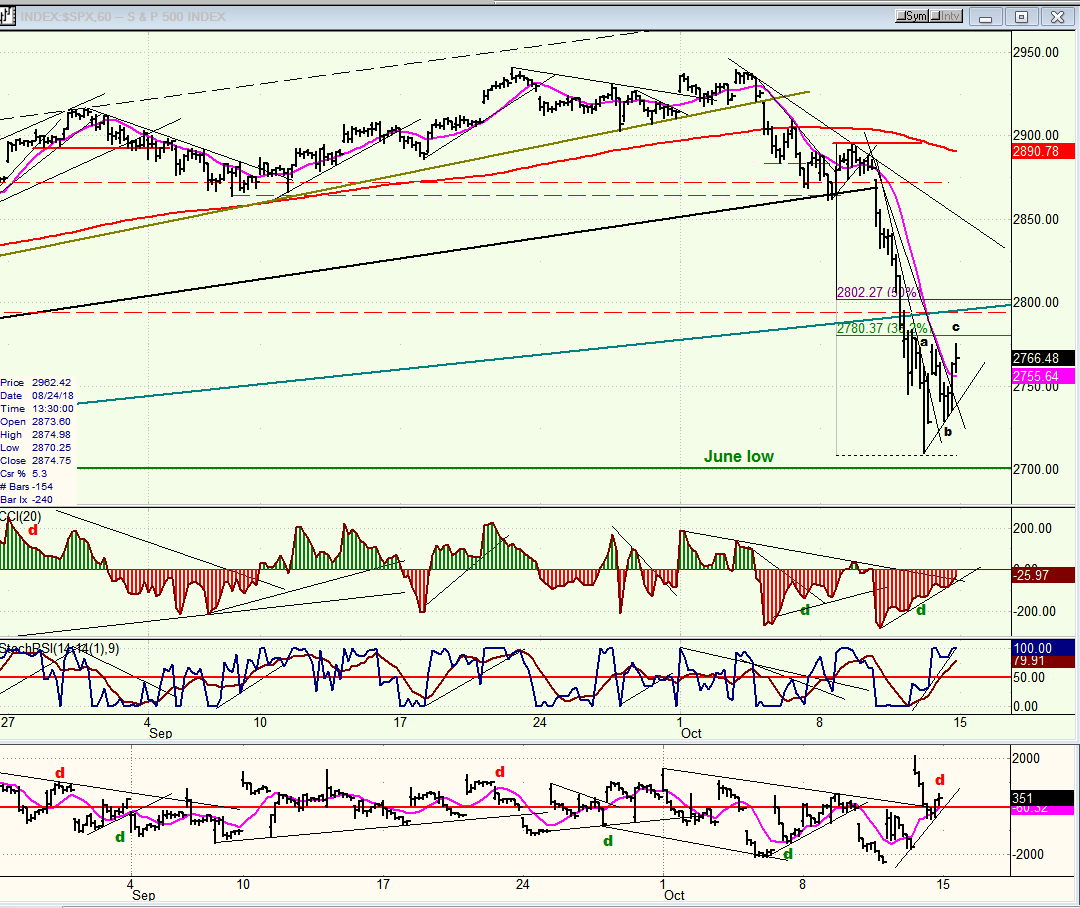
After a slight hesitation above trend line #3, prices literally fell out of bed, slicing through multiple support levels, and finally coming to rest just above the June low. The current market mood is associated with high volatility, e.g. when we found support on Thursday, the index rebounded 65 points in two hours, only to lose 45 points over the next four hours, and rebounding another 46 points three hours later. Enough to make you dizzy -- and likely to continue.
I have marked the bounce from the low as an a-b-c pattern, which means that, if correct, the oversold rally may already be complete, although a retracement of .382 of the decline from the 2895 level could take the index to 2780, first. With the strong resistance band overhead starting a few points higher, there could be an extension of the countertrend rally on Monday morning; and trend line #2, which was totally ignored by declining prices could be back-tested as well.
The top oscillator is still negative, in spite of the rally. The A/D index opened strongly positive as massive short-covering took place, but soon went negative again, finally closing slightly to the plus side. The second oscillator is already close to giving a sell signal. There is nothing here to suggest that the decline is over and that we are ready to continue the rally.
DJIA, SPX, NDX, IWM (daily)
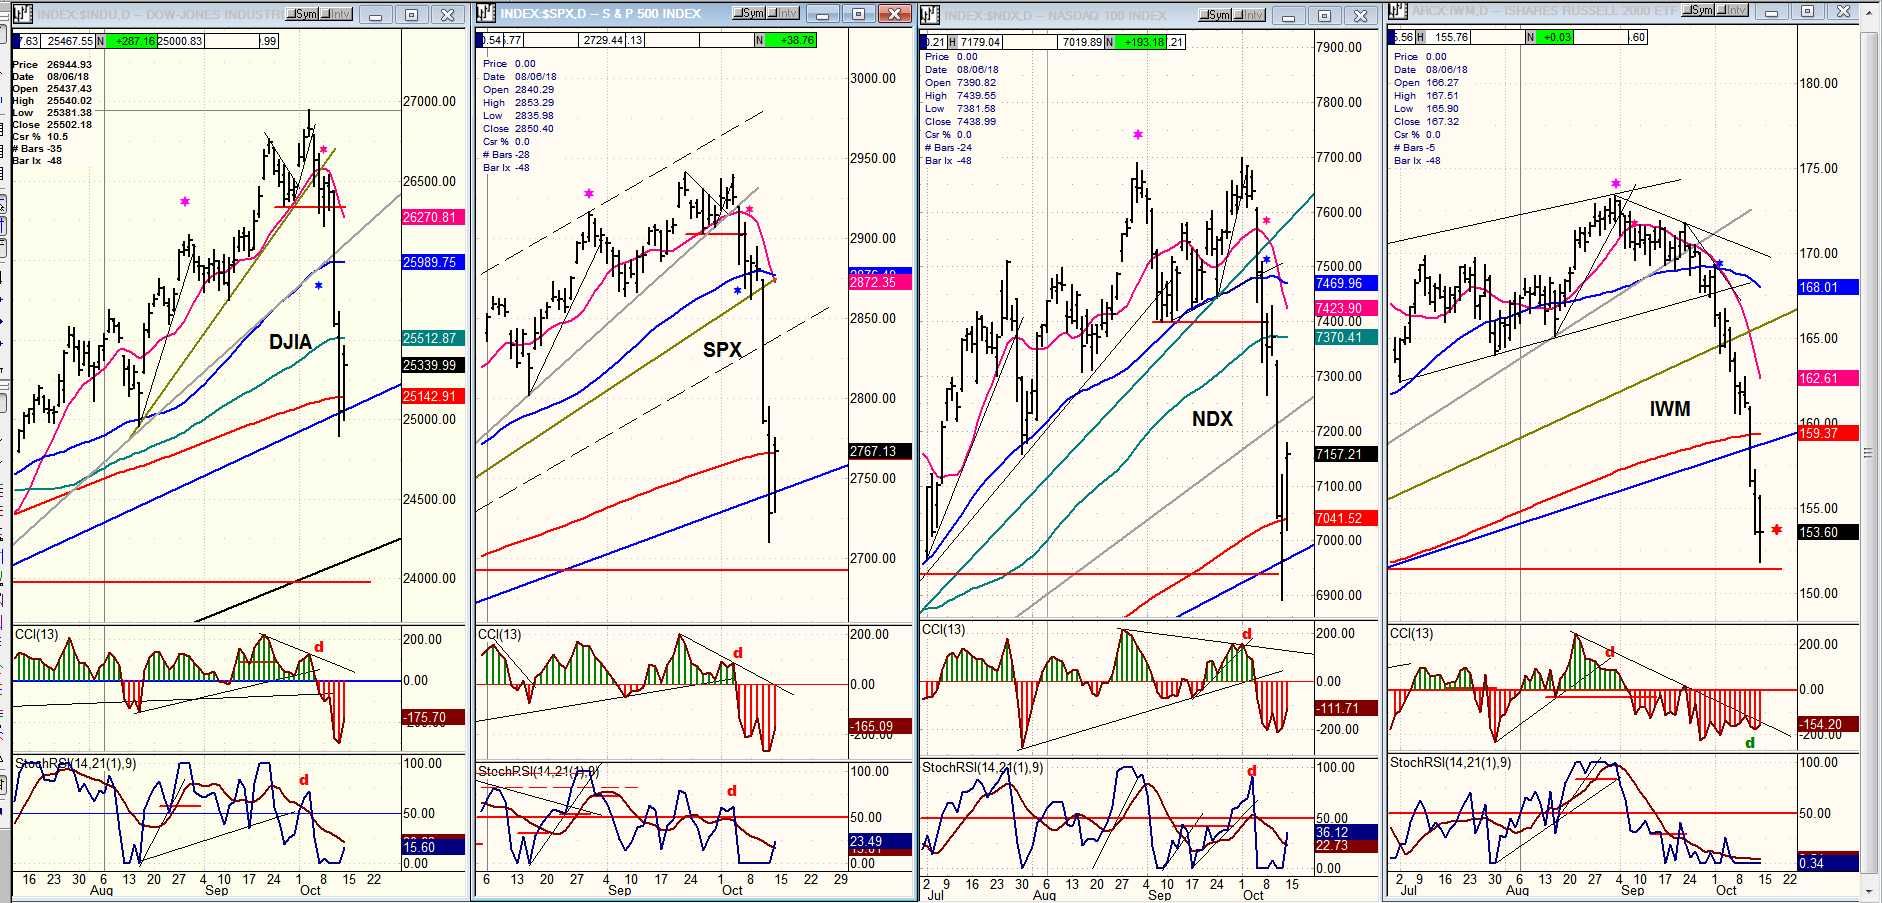
Of the four indexes followed for comparative purposes, DJIA remains the strongest and IWM the weakest (by far)! The red horizontal line at the bottom of each chart represents the level of the June low for the first three. For IWM, it indicates that of its May low.
Above, I spoke of lower trend lines for DJIA and NDX. The one for DJIA is shown, but the one for NDX is lower. Since the blue trend line spans the majority of the advance for each chart, this is the one which should be considered as the major trend line for all indexes. Only IWM has clearly broken it, as well as its 200-dma.
An important thing to note is the weak bounce from the low in IWM compared to the others, and where it closed. There was no rally to speak of in IWM. This kind of action suggests that this low is unlikely to hold for very long.
UUP (dollar ETF) weekly
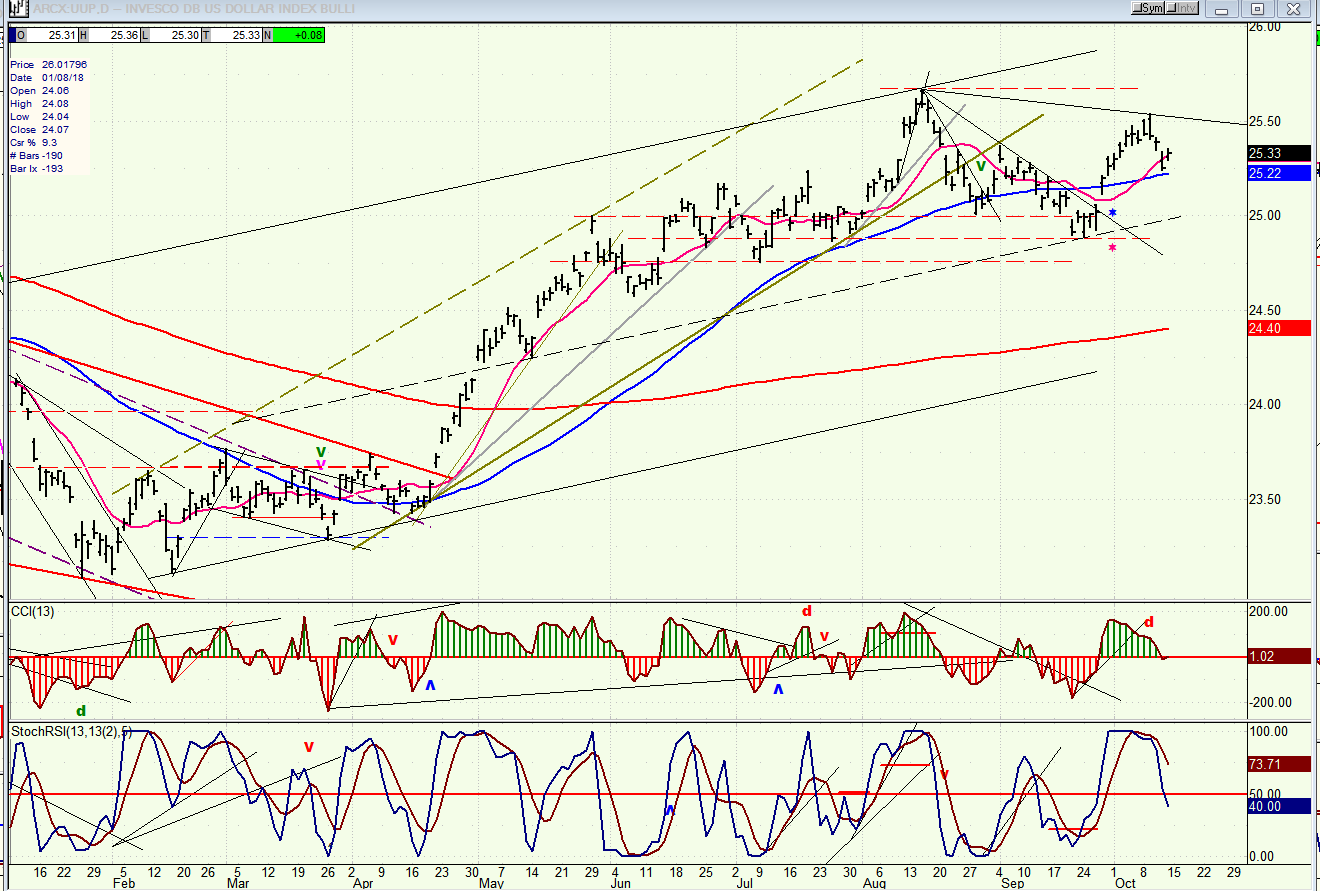
UUP has rallied just enough to get back above 25.50 and create an important reversal on its P&F chart. It should retrace at least back to 25.00 or a little under, but may consolidatefor a while above its blue 50-dma, first.
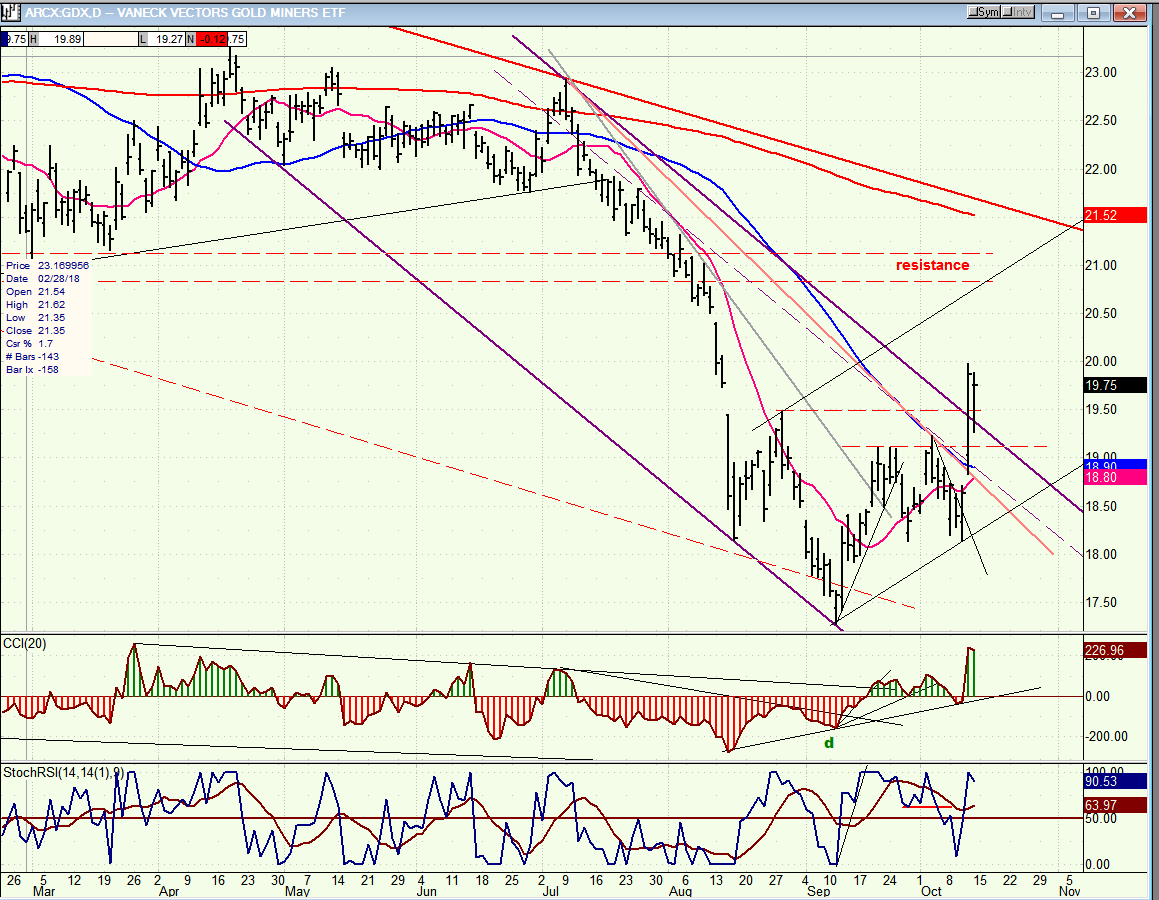
GDX (Gold miners ETF) weekly
GDX is now back in a confirmed short-term uptrend and probably on its way to 21.00+ which is both a P&F target and a resistance area. There could be a little more digesting of its recent rally if UUP holds up above its 50-dma a little longer. Also, gold bulls should be aware that upside potential is limited by the P&F chart count, as well as by the possibility that this is only a wave 4 rally which will eventually be followed by a wave 5 to a lower low.
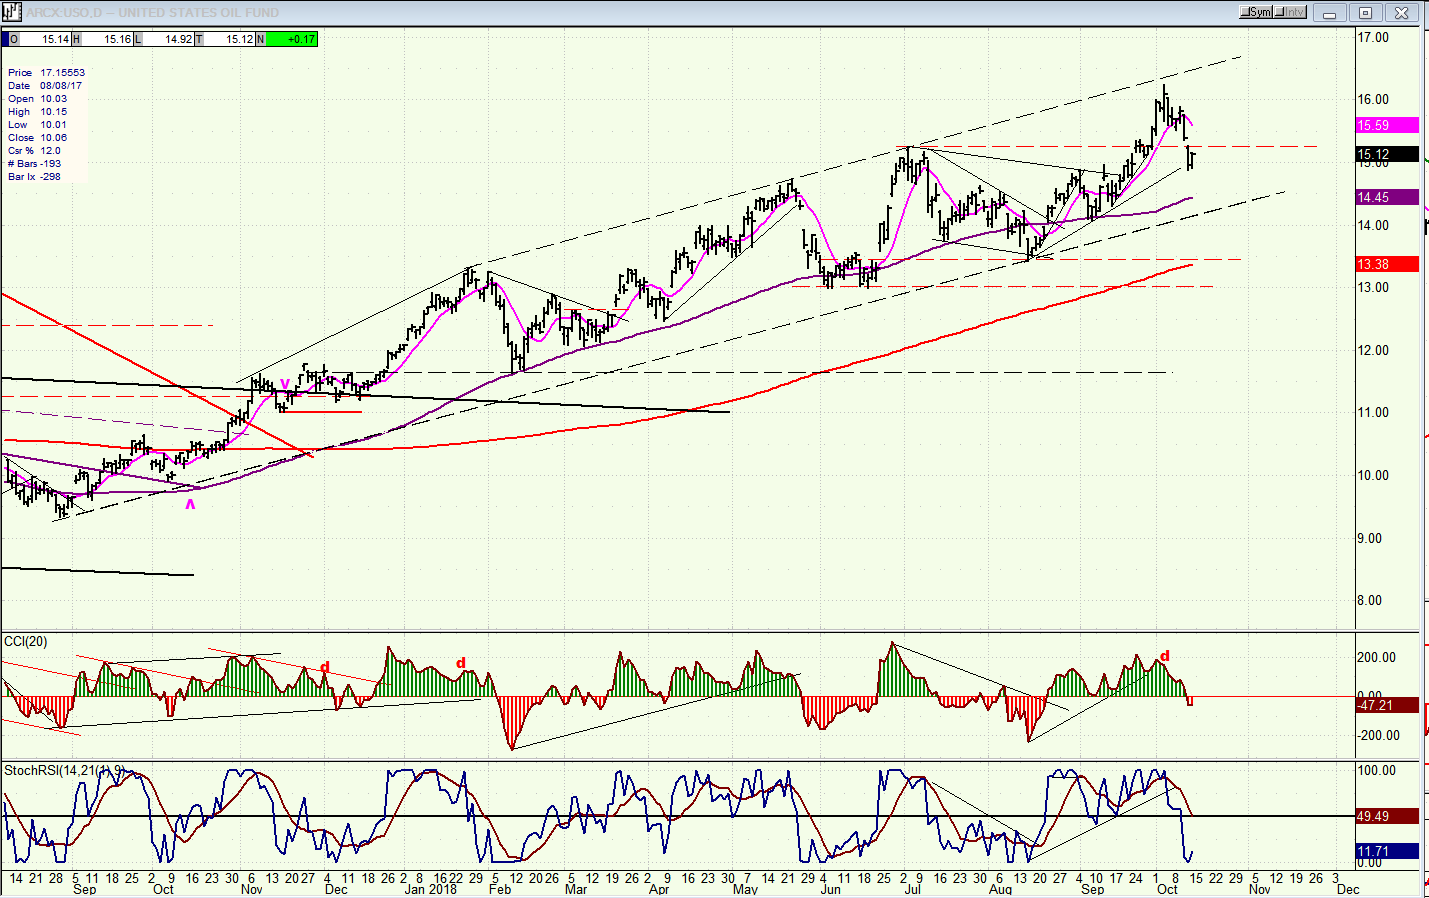
USO (United States Oil Fund)
USO is consolidating after reaching the top of its channel and completing what is probably wave 3 of its final move from the June low of 8.65. After filling its projection to 16.50-17.00, it should start a deeper correction.
Summary
Last week, SPX started on what very much looks like the first phase of a correction of the 1129-point uptrend from January 2016, i.e. wave 4 of the rally from the 2009 low. If so, this could count as a bear market in its own right since there could be a normal retracement of 431 to 565 points – and possibly more -- before wave 5 from 2009 gets underway. The current decline is likely to be followed by additional selling to 2670 or lower before a good countertrend rally takes hold .
FREE TRIAL SUBSCRIPTON
With a trial subscription, you will have access to the same information that is given to paid subscribers, but for a limited time period. I think you will find that knowing how far a move can carry is one of the most useful benefits of this service, whether you are a trader or an investor -- especially when this price target is confirmed by reliable indicators which give advance warning of a market top or bottom. Furthermore, cycle analysis adds the all- important time element to the above price projections.
For a FREE 4-week trial, further subscription options, payment plans, and for general information, I encourage you to visit my website at www.marketurningpoints.com.
The above comments about the financial markets are based purely on what I consider to be sound technical analysis principles. They represent my own opinion and are not meant to be construed as trading or investment advice, but are offered as an analytical point of view which might be of interest to those who follow stock market cycles and technical analysis.
*********

When Andre Gratian was a stock broker years ago, a friend introduced him to technical analysis of the market. Consequently, it is not an exaggeration to say that Andre fell in love with this approach! Ever since then, it has become an increasingly important part of his professional life. Gratian has studied the works of Wyckoff, Edwards & Magee, Edward J. Dewey (cycles) and many others. However, one of my most profitable undertaking has probably been to study Point & Figure charting, which he finds invaluable in analyzing stocks and indices. If he were restricted to one methodology, this is the one that he would choose. This well-rounded background has given him what he feels to be a special insight into the stock market, facilitating the recognition of meaningful patterns and the ‘turning points’ in all trends, whether they be short or long term. Andre feels very comfortable discussing the stock market and passing on meaningful information to others. His subscribers include individuals and money managers throughout the world. Moreover, his Newsletters are currently published on several financial sites, here and abroad.


