Technical Analysis Of The Markets


Current Position of the Market
SPX: Long-term trend – Bullish, but correcting within the long-term bull market trend.
Intermediate trend – A bearish correction has started which could retrace as low as 2200 before it is complete
Analysis of the short-term trend is done on a daily basis with the help of hourly charts. It is an important adjunct to the analysis of daily and weekly charts which discusses the course of longer market trends.
Counter-Trend Rally
Market Overview
“…the P&F chart … gives us three separate projections pointing to the 2360-2400 level. Based on this information, we should be looking for an important low in the near future.”
The above was written last week under our daily chart analysis. The low of the move came at 2346.58 (close enough) on 12/26 and produced a rally of 122 points by the end of the day. This should have told us that something more than a one or two-day low was struck on that date. Indeed, after correcting briefly, the index made a new recovery high on Friday which could be extended before the next reversal.
So where are we in this bear market? Not yet at the end! This is made clear by the reading of the weekly indicators which appear to be confirming our original suspicion that we could drop all the way to 2200 before the corrective move runs its course. We’ll get more specific about the exact turning point when the market permits.
Chart Analysis (The charts that are shown below are courtesy of QCharts)
SPX daily chart
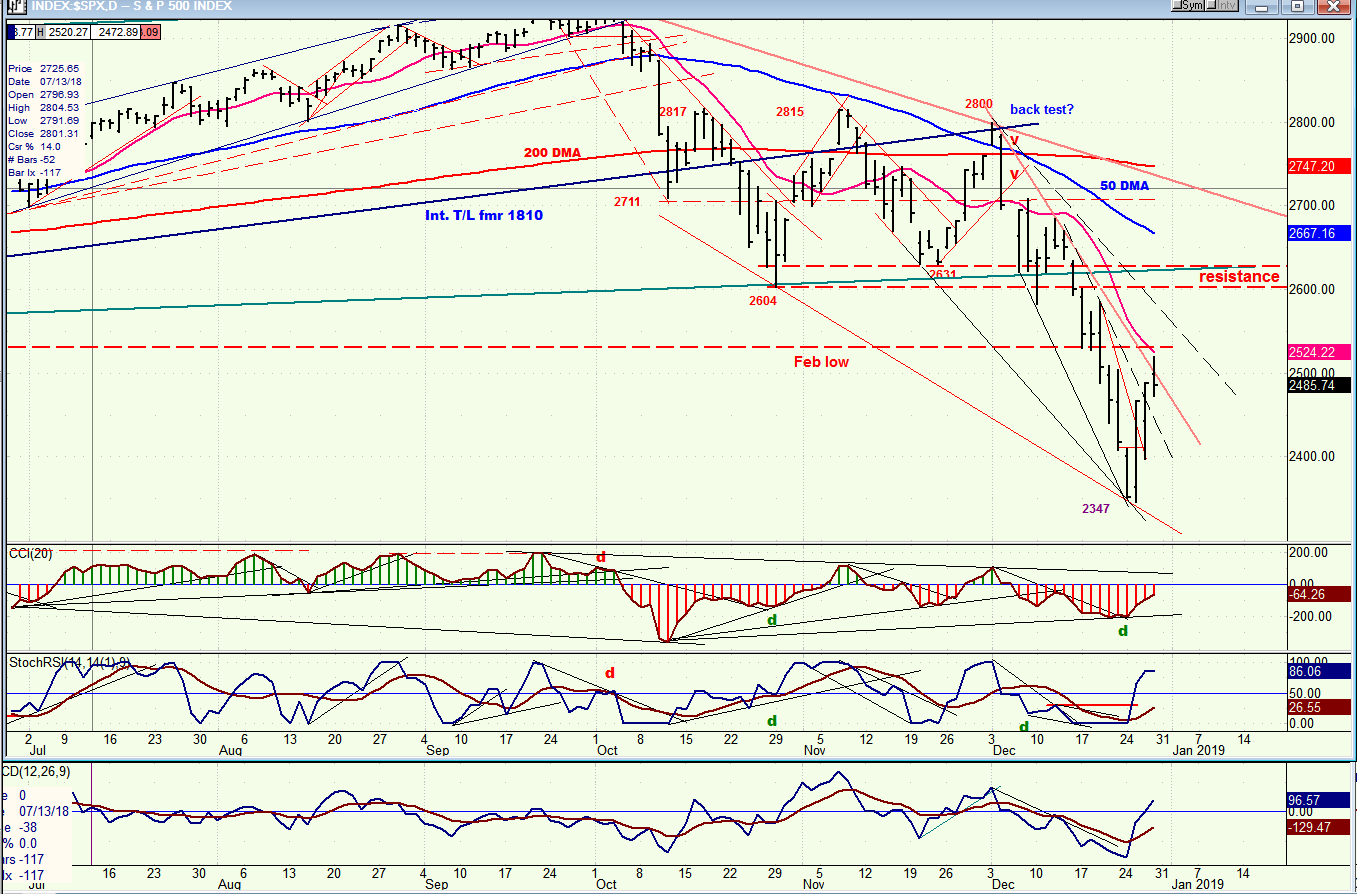
Besides the target suggested by the Point & Figure chart, another hint that we were approaching a low was given by the daily indicator readings which had been showing deceleration and finally divergence by the previous Friday. This is always a strong warning that a reversal is about to take place. And reverse it did, with 122-points in one day for SPX, and nearly 1200 points for the DJIA. Volatility persisted the next trading day with a range of 90+ points on SPX followed by a higher close. Everything indicates that this only a secondary move in a primary downtrend which is far from being over. It is made even more clear by the weekly chart, which is the best time frame to turn to for intermediate and long term signals.
There are standard Fibonacci measurements that are useful in establishing projections for any given market move and which work well in conjunction with the counts provided by Point & Figure charts. When a target is established by this process, verification of its accuracy is also obtained through the use of other market tools such as trend lines, moving averages, and oscillators. As of now, there is no sign that the 2346 low is the final low of this correction and we’ll continue to monitor the weekly chart for a warning that we are getting close to the end of this correction. The estimated target for the SPX is approximately 2200.
Our current focus is on the short-term to determine how far this countertrend move will carry. Many signs and projections point to the resistance band which has been outlined on the chart below -- roughly the 2625 level. After this target is reached we should be prepared for lower prices before we put an end to this intermediate correction. Only then will we be able to enjoy another bull market, which will actually be a continuation of the one which started in 2009.
SPX hourly chart
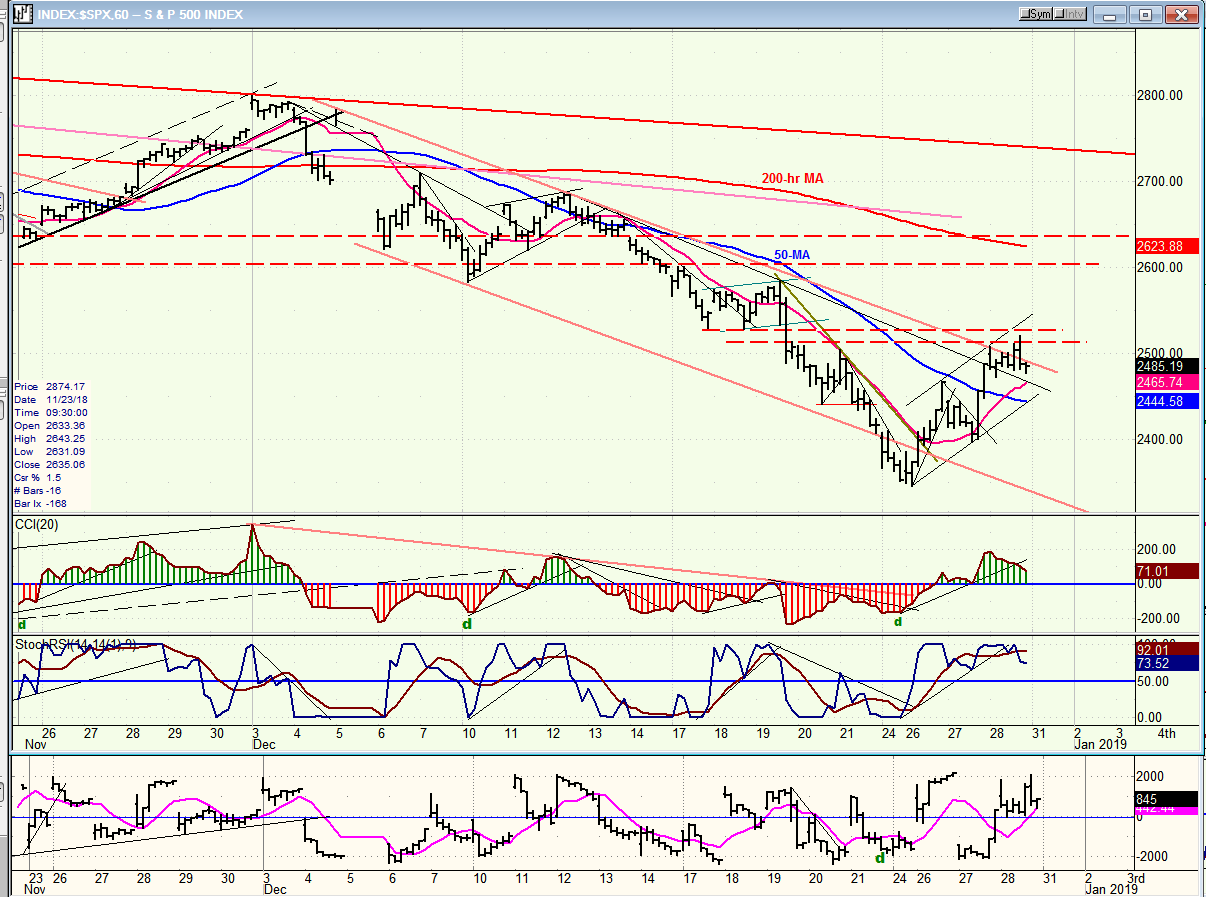
SPX gave us an even clearer signal that we were about to reverse by showing some positive divergence on the hourly indicators. Of course, no one could have anticipated that this reversal would translate into a 120-point, one-day move which, on the P&F chart, encompassed two successive phase counts (which could just as well have taken two or three days to complete). Most likely, the urgency to cover shorts added to bargain buying was a factor. After a sizeable -- but within normal parameters -- retracement, the second phase of the rally got underway reaching a short-term projection on Friday before the next minor correction started.
Although some negative divergence has begun to appear at the hourly level, there is no conclusive sign yet, either on the hourly or the daily indicators, that this upward correction is over. The rally stopped at a minor resistance level and began to pull back on Friday. If the next couple of days does not bring about signals that the rally has already come to an end, it could extend to the higher and more important resistance band which should then put an end to the entire counter-trend.
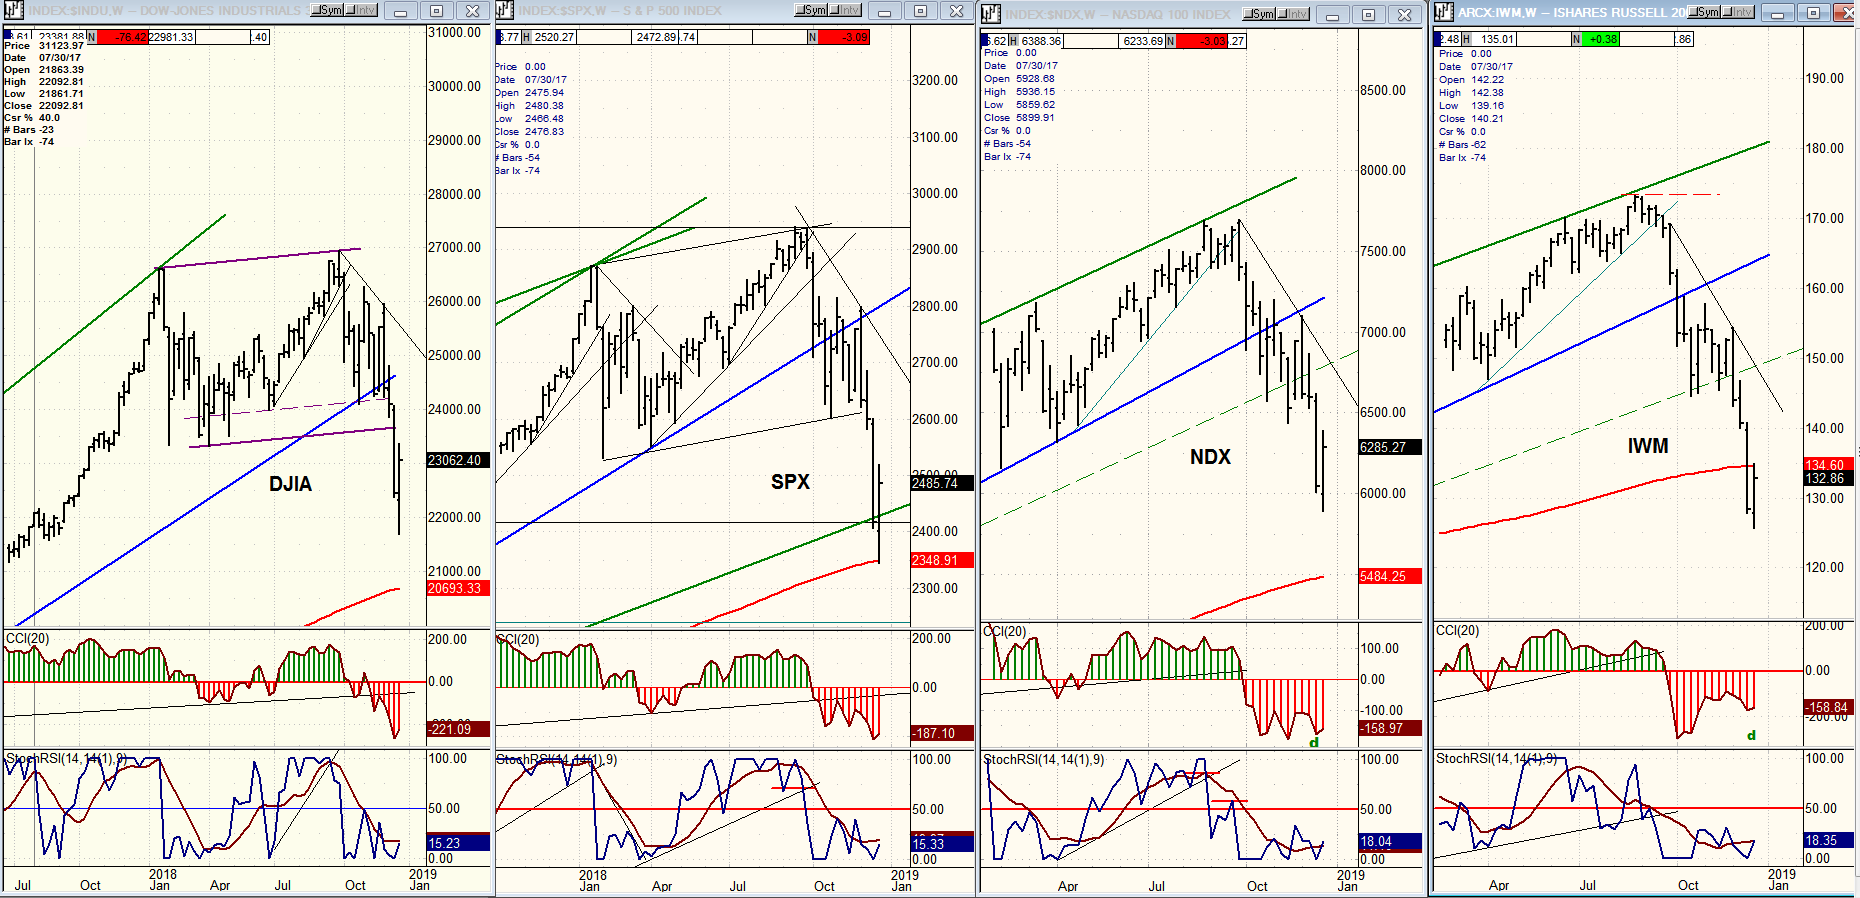
DJIA, SPX, IWM, NDX (weekly)
These are the weekly charts of the four indexes that we follow. Judged strictly on their relative position to the 200-week MA, IWM is still the weakest, followed by SPX. Some minor divergence has appeared in the CCI of NDX and IWM, but there is none in SPX or DJIA. It is not enough to suggest that we are close to a final low, but we’ll continue to watch for more conclusive signs that some deceleration is taking place.
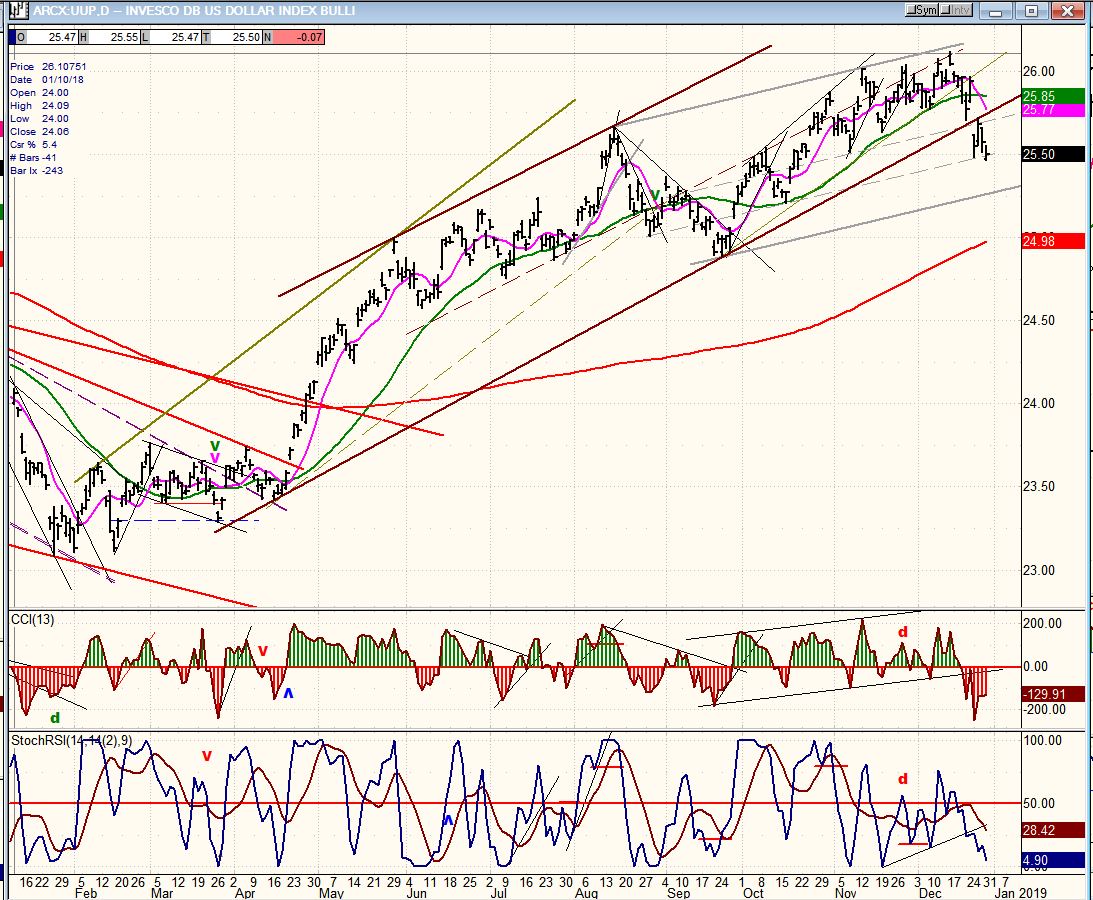
UUP (Dollar ETF)
UUP has broken the trend line to its eleven-month rally and has started to correct. The initial phase of the correction is not expected to be very deep and could stop at the grey trend line just below and bounce, before it proceeds down to the red 200-dma.
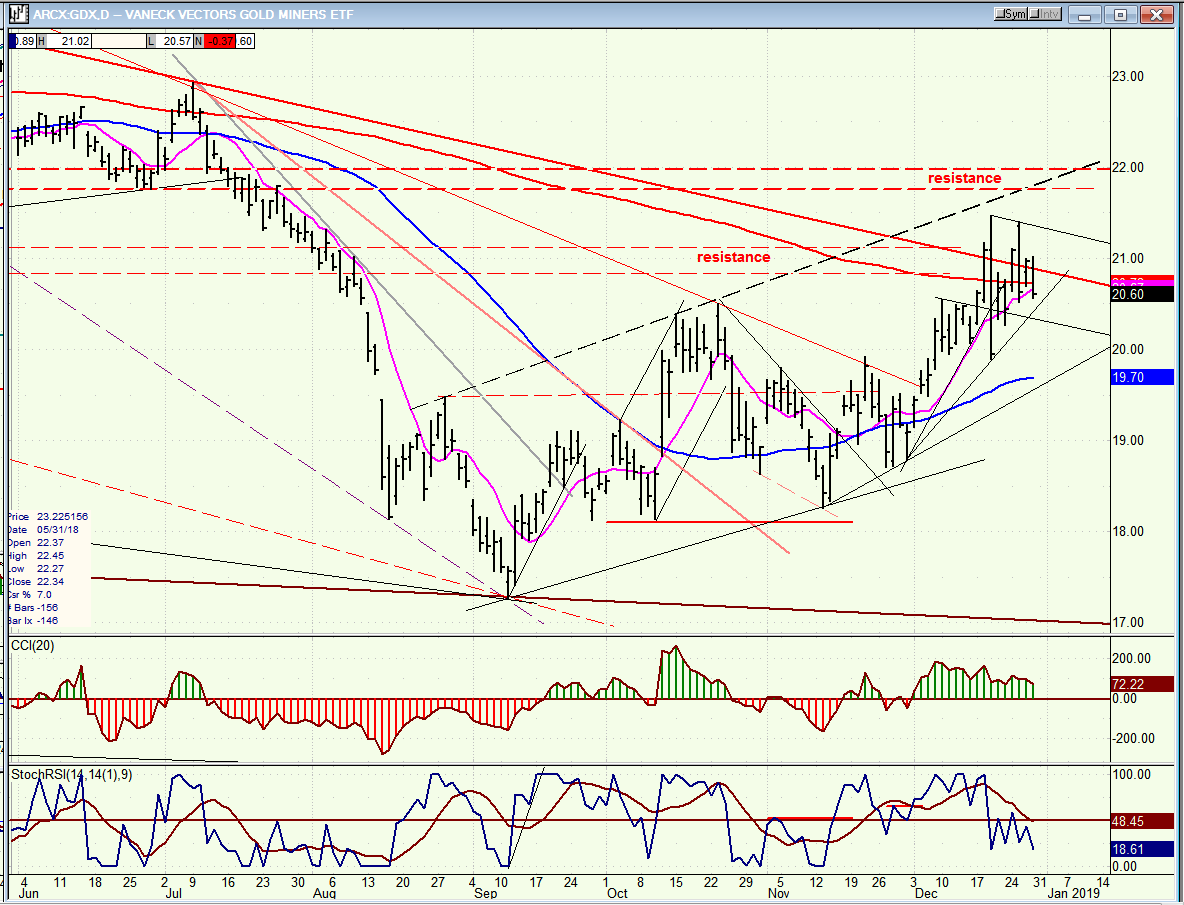
GDX (Gold miners ETF) daily
GDX reached its initial target of 21.00-21.50 which has been on the radar for several weeks, and is consolidating before making an attempt at pushing higher. To remain in an uptrend it needs to hold above its blue 200-dma (19.70). Even if it does, it may not be able to move above the higher band of resistance over the short-term.
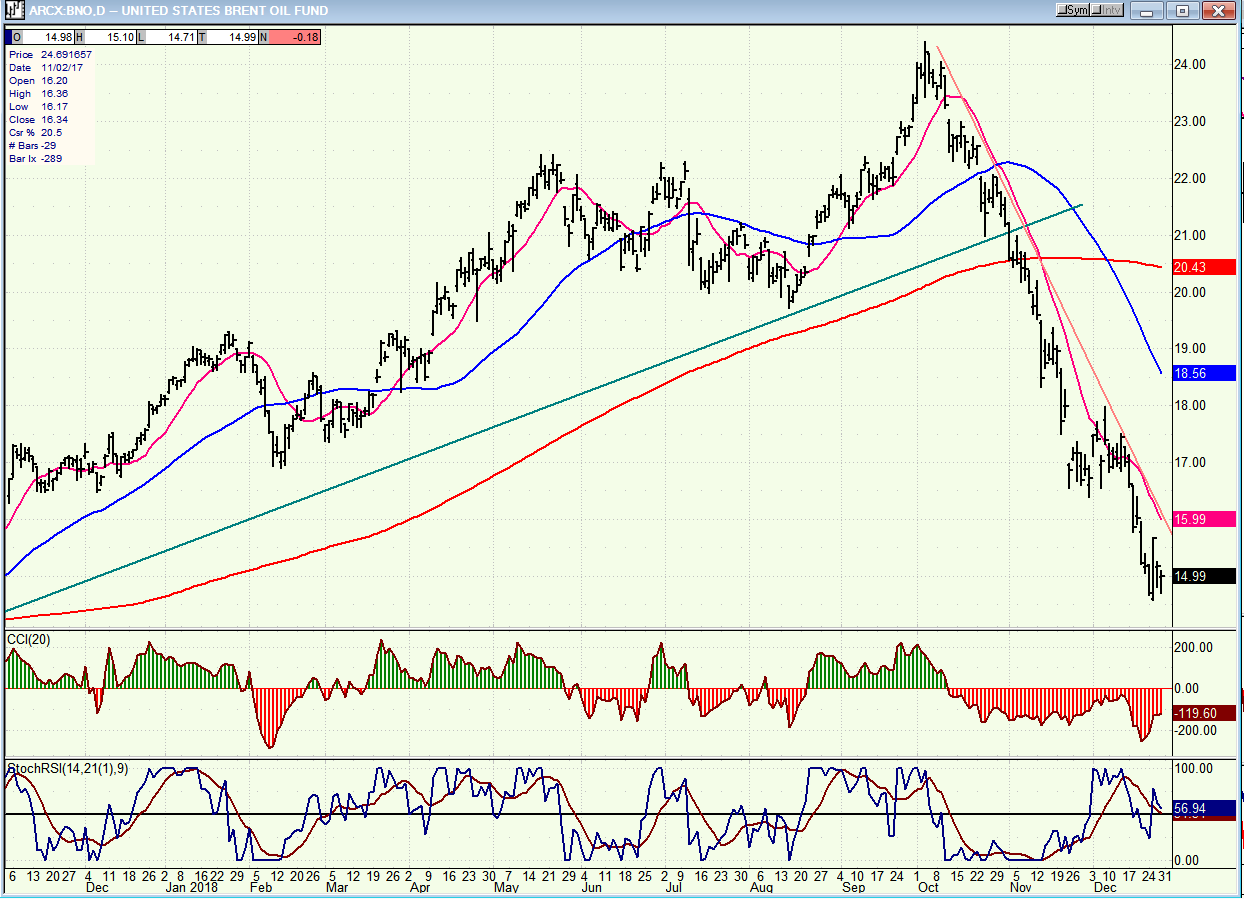
BNO (United States Brent Oil Fund)
I am substituting BNO for USO. It will serve the same purpose and is a little higher price; same action, and it will need to create a base before it can rally.
Summary
After a substantial and precipitous price drop of 450 points during the past two weeks, SPX has finally found a bottom and is rallying over the short-term. In keeping with the current volatile market nature it has already rallied 173 points in three days. More is possible over the next week or two, but at a much reduced ROC.
Happy & Prosperous New Year
FREE TRIAL SUBSCRIPTON
With a trial subscription, you will have access to the same information that is given to paid subscribers, but for a limited time period. I think you will find that knowing how far a move can carry is one of the most useful benefits of this service, whether you are a trader or an investor -- especially when this price target is confirmed by reliable indicators which give advance warning of a market top or bottom. Furthermore, cycle analysis adds the all- important time element to the above price projections.
For a FREE 4-week trial, further subscription options, payment plans, and for general information, I encourage you to visit my website at www.marketurningpoints.com.
The above comments about the financial markets are based purely on what I consider to be sound technical analysis principles. They represent my own opinion and are not meant to be construed as trading or investment advice, but are offered as an analytical point of view which might be of interest to those who follow stock market cycles and technical analysis.
*********

When Andre Gratian was a stock broker years ago, a friend introduced him to technical analysis of the market. Consequently, it is not an exaggeration to say that Andre fell in love with this approach! Ever since then, it has become an increasingly important part of his professional life. Gratian has studied the works of Wyckoff, Edwards & Magee, Edward J. Dewey (cycles) and many others. However, one of my most profitable undertaking has probably been to study Point & Figure charting, which he finds invaluable in analyzing stocks and indices. If he were restricted to one methodology, this is the one that he would choose. This well-rounded background has given him what he feels to be a special insight into the stock market, facilitating the recognition of meaningful patterns and the ‘turning points’ in all trends, whether they be short or long term. Andre feels very comfortable discussing the stock market and passing on meaningful information to others. His subscribers include individuals and money managers throughout the world. Moreover, his Newsletters are currently published on several financial sites, here and abroad.


