Technical Analysis Of The Markets


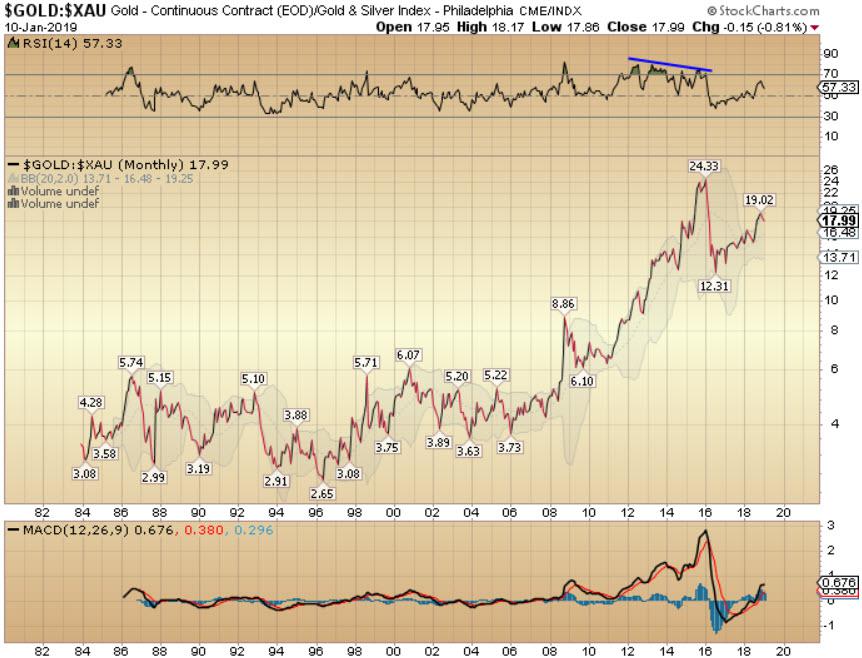
Miner Miracle - Gold has traded in a range of 3-6 times the $XAU, an index of gold mining companies, from the early 1980’s all the way up until the global financial crisis of 2008. Then something happened. For a host of reasons, over the next decade, the gold miners kept getting cheaper and cheaper relative to gold, even as the precious metal rallied from $700 in 2008 to $1,900 in 2011.
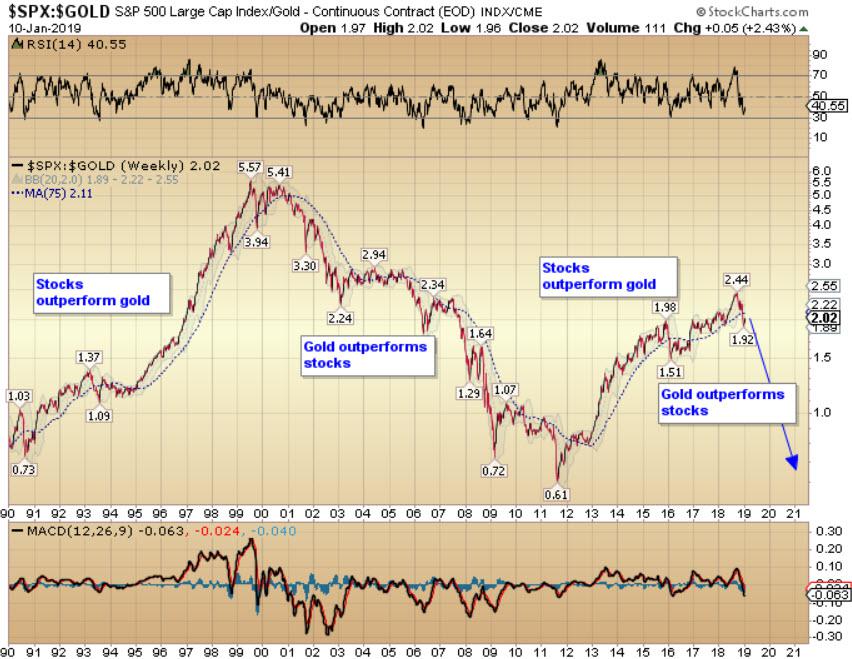
Time to Sell Stocks and Buy Gold - Gold moves in cycles. Gold also often tends to trade inversely to equities - not always, but often - as it is considered a safe haven asset. It is clear from the chart below, which shows the relative performance of US equities to gold, that US equities outperformed the precious metal pretty consistently from 1990 to 2000. Then it was gold’s turn. Despite the rally in equities from 2003-2007, gold consistently beat the stock market for a decade from 2000 until 2011, when gold surged to a bull market top at $1,923/ounce.
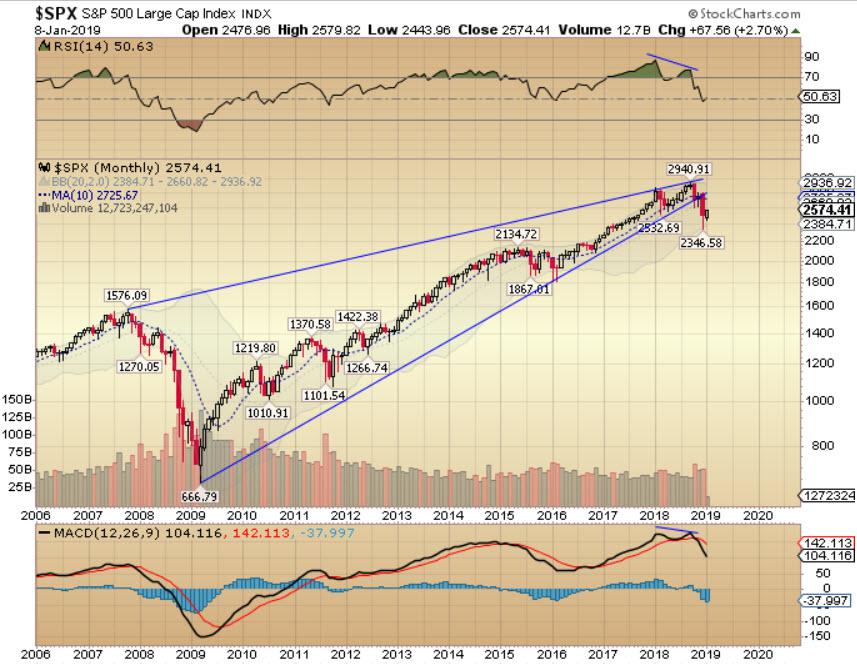
A Lot of Work to Do - Following the December 2018 rout in stocks, I have noticed quite a divergence in opinion about the future direction for equities - varying from ‘a multi-year bear market has begun’ to ‘simply a correction in an ongoing bull market’. You know my views but I am open to being proven wrong. For that to happen, equities have a lot of work to do to repair the recent damage to the charts.
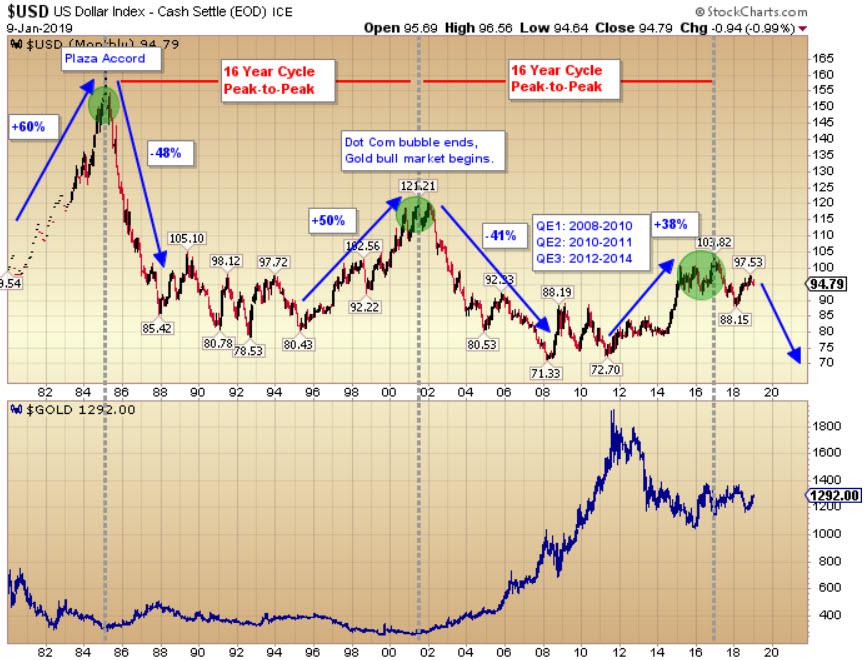
Breaking the Buck - The USD has suddenly started to sell off in the last four weeks on no significant news. It is down -3% versus the euro and a similar amount versus the Chinese yuan. Big trending moves often start on no ‘news’ and stories often break later explaining the change in trend. I think the break lower here is important and part of the reason that gold has refused to decline despite being late in its own investor cycle. Regular readers will know my views on USD. I think the greenback is headed a lot lower in the years ahead.
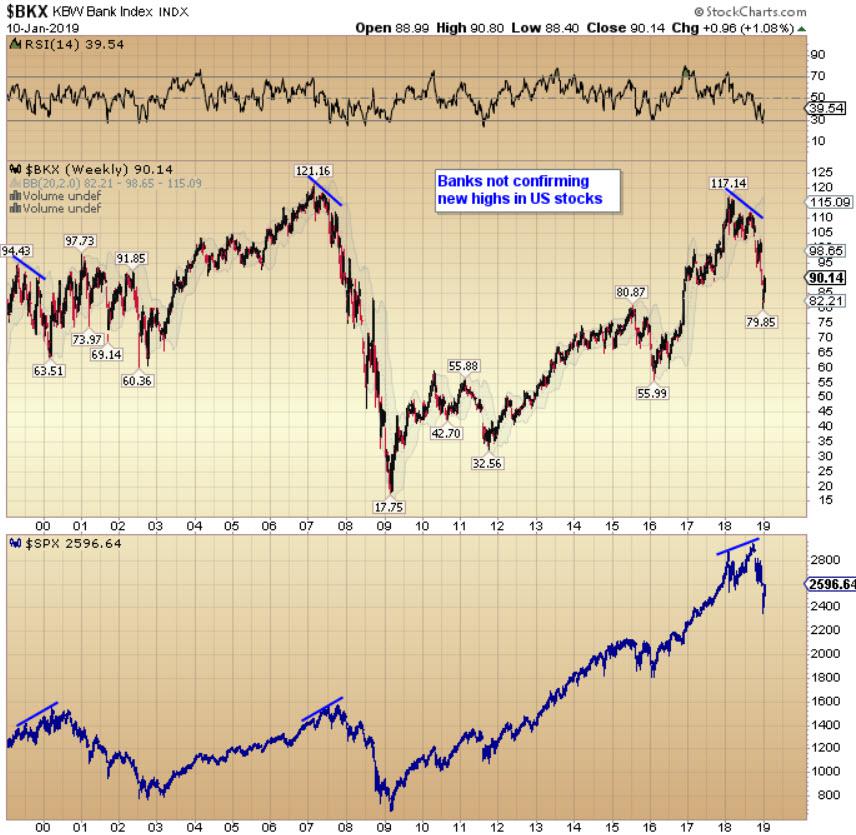
Banking on a Bounce - A healthy and profitable banking system is at the core of a well-functioning economy. We saw what happened in 2008 when the banks collapsed and the ramifications that were felt across the wider. Back in 2007, while the S&P 500 continued to make new highs (see chart below) the KBW Bank Index started to diverge, reversing trend and making a series of lower highs and lower lows. That was the tell that something wasn’t quite right in the banking system. Bank shares began to accelerate lower shortly thereafter and the S&P 500 soon followed.
Have a wonderful weekend everyone!
FORWARDED THIS MESSAGE? SIGN UP
Join a growing list of savvy readers and get exclusive content for free. No spam, ever. Just great stuff.
Brian Delaney, CFA
Director, Secure Investments
Tel: +353 86 821 5911
Website: www.secureinvestments.ie
Email: [email protected]
LinkedIn: Brian Delaney, CFA
Twitter: @briandelaney_
Delaney Investment Services Limited trading as Secure Investments is regulated by the Central Bank of Ireland. Delaney Investment Services Limited is registered in Ireland and is a limited liability company. Registration Number: 516058. Registered Office: 76B Northumberland Road, Ballsbridge, Dublin 4, Ireland.
More from Gold-Eagle


