Technical Analysis Of The Markets


SPX: Long-term trend – Final long-term phase on the way? How much longer, is the question.
Intermediate trend – The anticipated intermediate-term correction has started. C-wave likely.
Analysis of the short-term trend is done on a daily basis with the help of hourly charts. It is an important adjunct to the analysis of daily and weekly charts which discusses the course of longer market trends.
Correction Extends
Gold Breaking out?
Market Overview
Last week, I discussed simple criteria to determine if the market had shifted to an intermediate trend, and concluded that only IWM fitted the bill at that time! This week, all four indexes have now crossed and closed below their 50-wk MAs. Thus, the evidence is pointing more and more to the strong probability that we have started an intermediate downtrend which has farther to go, and which is increasingly likely to be the C-wave of a corrective move. We can also make a couple more assumptions: based on the distribution pattern which formed above 2800, we can surmise that there is enough of a count to extend this correction beyond the December low. The second assumption has been made before! When the corrective pattern which started in September 2018 is complete, the bull market which started in 2009 should make a new all-time high, but this will be its last hurrah. Although it would be possible by using Fibonacci calculations to arrive at a fairly accurate “ball park” estimate of what that final high will be, it is best to wait until the entire correction has concluded so that the Fibonacci number can be verified with a Point & figure count.
It is not yet clear if Gold has started a major up-move, or if it is simply preparing for one. This will be discussed in detail when we analyze GDX.
Chart Analysis (The charts that are shown below are courtesy of QCharts)
SPX daily chart
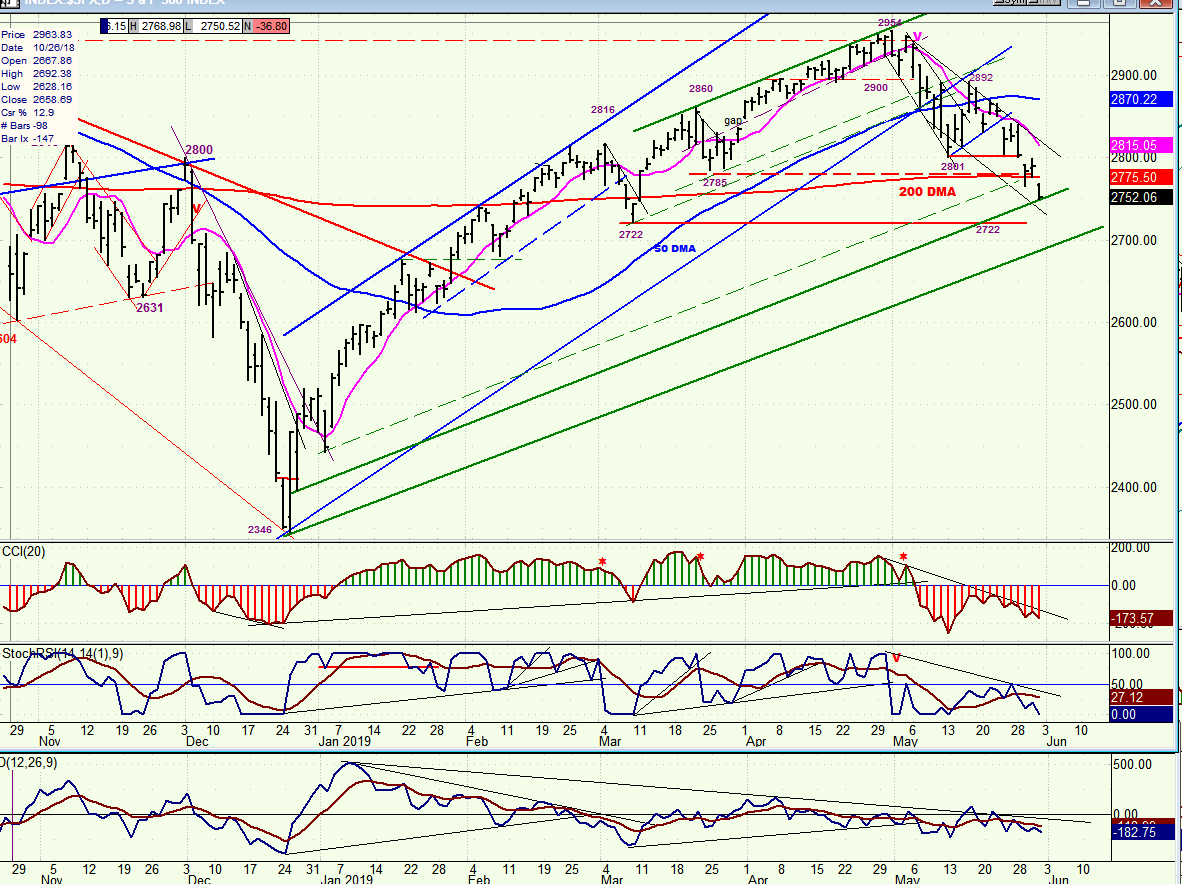
SPX extended its downtrend by another 60 points this past week, closing near its low of the week on Friday at 2752 (the low was 2751.01). I had estimated that this move could reach at least 2740 before completing this short-term phase but, since there are lower counts, how far we go will be dictated by a 45-day cycle which is nearly ready to reverse.
Friday’s price action showed some reluctance to move lower aggressively, and this resulted in some minor positive divergence developing in the hourly as well as the daily chart. The price pattern that we are making suggests that the decline is ready to take a breather and it would fit in with our expectation that a cycle is bottoming.
Also worth noting, IWM made a new low along with SPX in the opening hour; but while SPX managed to trade slightly lower by the end of the day, IWM remained higher until the close, and even showed a little buying interest in the last half-hour. The short-term relative strength on the part of IWM is deemed bullish for the market.
Whether we start up right away on Monday, or drop a little lower first, the market action suggests that we are very close to a short-term reversal.
SPX hourly chart
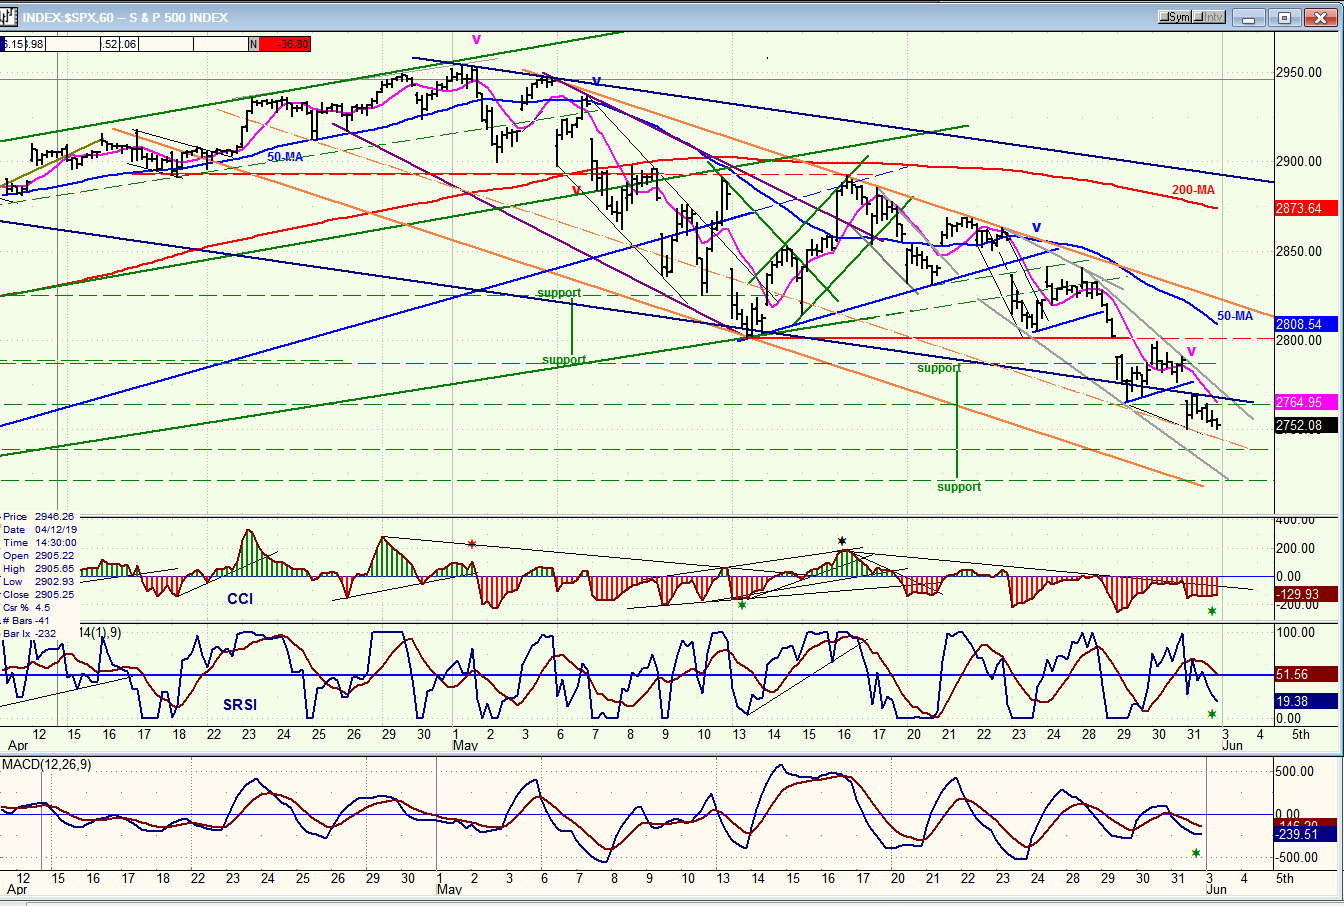
The SPX trend started as a fairly shallow purple channel, but upon completion of the first down phase to 2801, the ensuing rally failed to make it to the top of that channel before turning down. In fact, the rally stopped when it reached the extension of the blue trend line which is actually the lower channel line of the primary channel from 2346. The first time that this blue trend line was broken, prices continued lower until they found support on the bottom line of the secondary green channel which was illustrated and discussed two weeks ago. This provided the kiss-back rally to the blue channel line.
The reversal from the kiss-back point is the start of the second down phase of the larger correction and this has created a new, steeper red channel. Prices have already traded below the lower channel line of the original purple channel and they should ideally continue to the bottom of the new red channel before the next rally. However, as pointed out earlier, it is possible that the bottoming 45-d cycle which is creating some minor positive divergence in the oscillators will delay further downside action for a few days. In fact if, before going lower, we get enough of a rally to take SPX outside of the red trend line, it will mess up what was thought to be a developing impulsive structure and may cause the EWT analysts to revise their analysis. But let’s see what the next few days of trading bring. In spite of the obvious near-term deceleration taking place, we could still see a final, quick move down to about 2715-2725 before the cycle turns up, which would be ideal.
QQQ, SPX, DJIA, IWM (weekly)
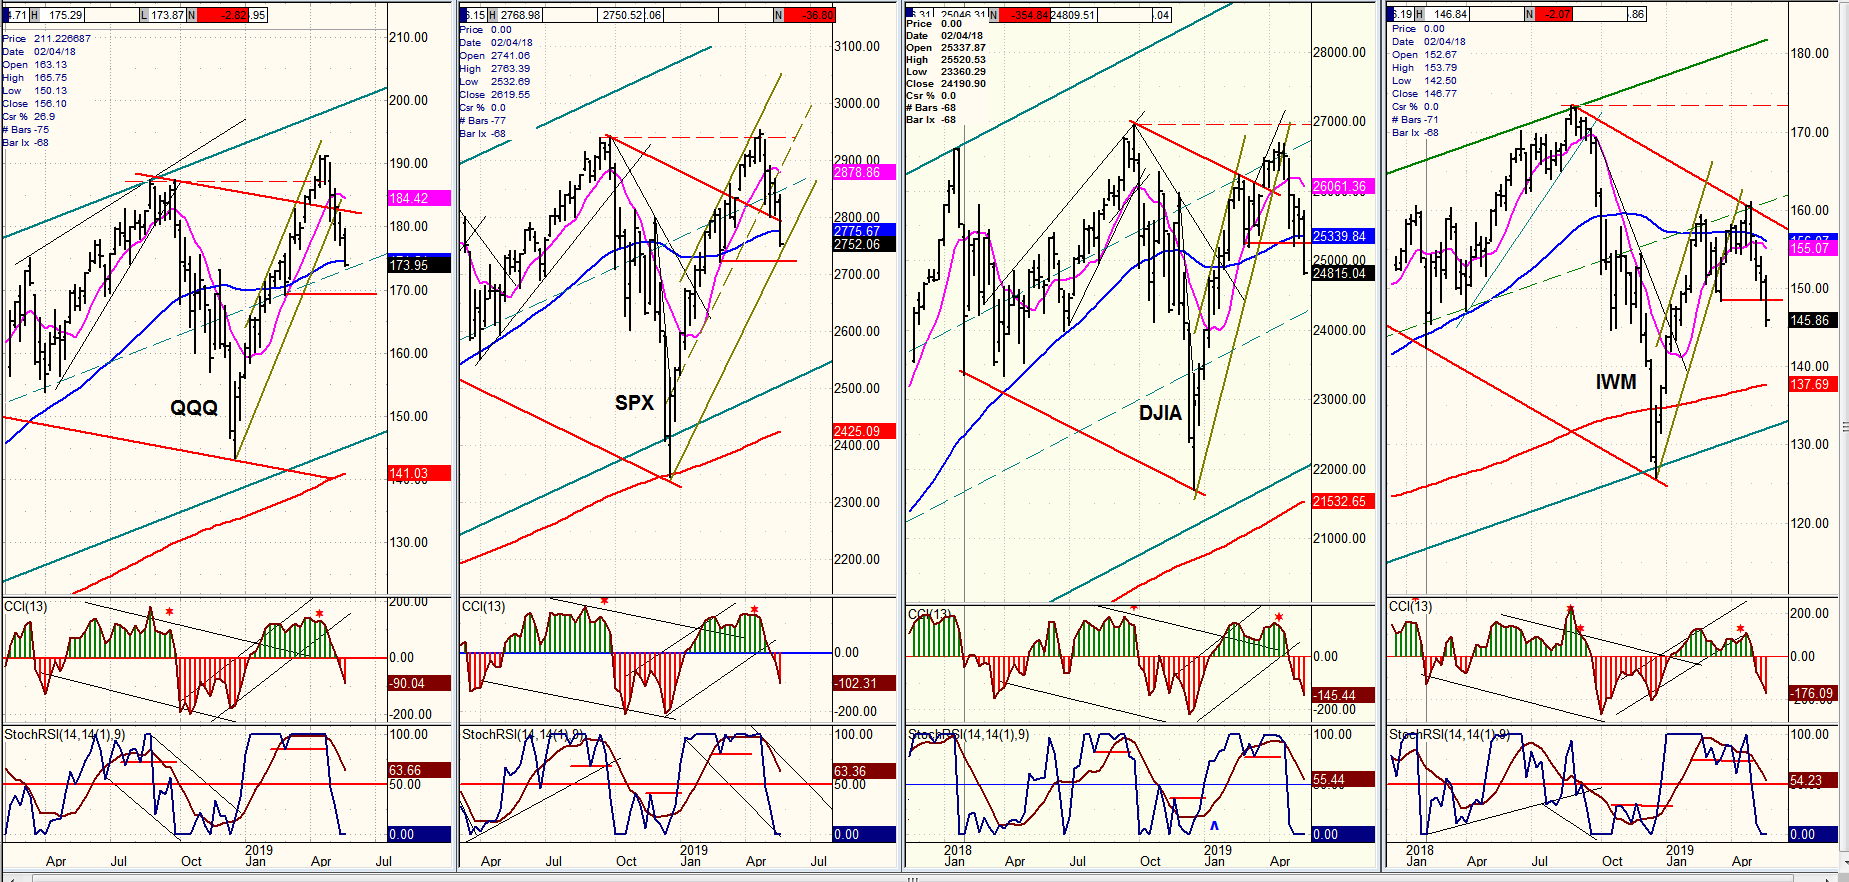
The RS ranking has not changed, but QQQ is now almost even with SPX while the other two are clearly weaker. The red horizontal line is drawn at the same phase low for each index. This shows clearly the RS contrast between the first two and the last two. One thing that I have not yet discussed is how much of a retracement it would take for SPX to give back .382 of its uptrend from 2346. In fact, it pretty much coincides with that red horizontal line, which would also be the ideal level for the second phase of the decline to reach before the 45-d cycle reverses. It would also satisfy a short-term count from the P&F chart.
UUP (dollar ETF)
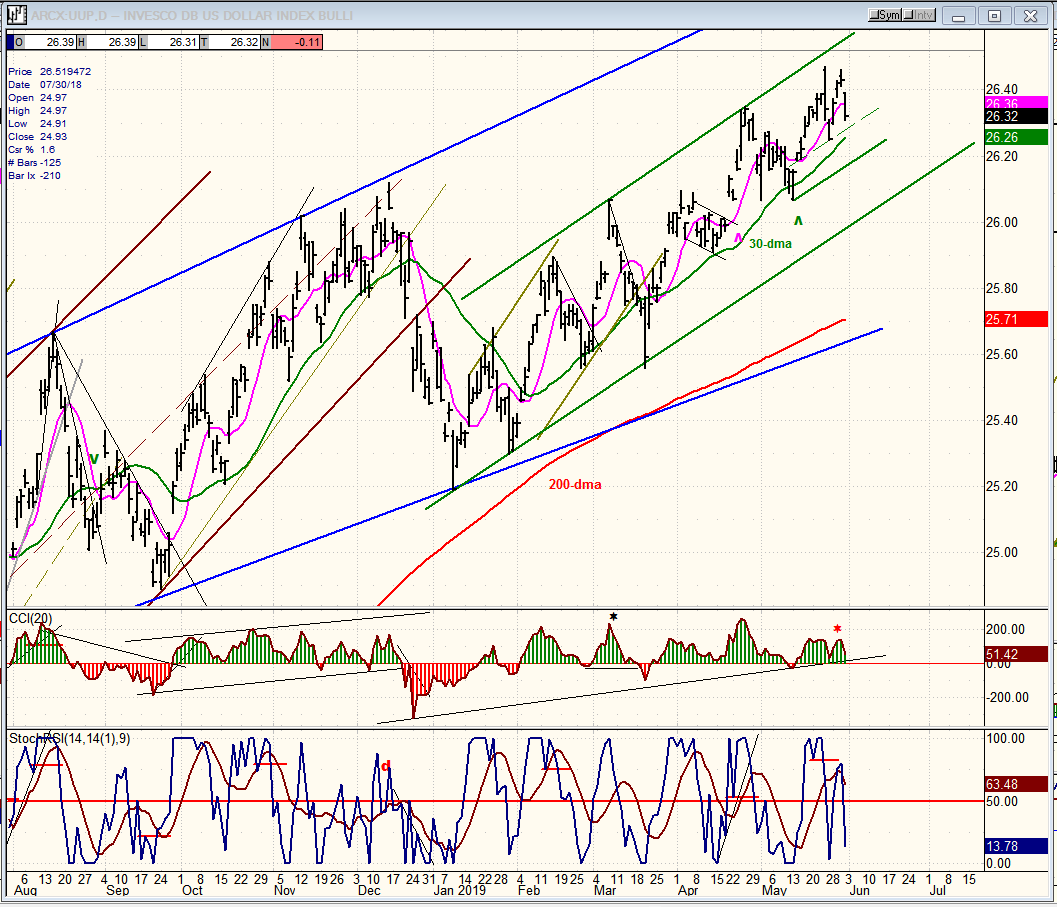
UUP is showing more signs of being ready for a correction. Last week, it dropped down a few cents before retesting the new high printed the week before. The fact that the test was successful and that the price turned down again on Friday suggests that the index may have made a short-term top, at least. But we will need confirmation. This will come with, at a minimum, a move below its 30-dma, and then later, by breaking the green bottom channel line. Only then can we be certain that UUP is finally starting to correct the uptrend which started nearly a year and a half ago.
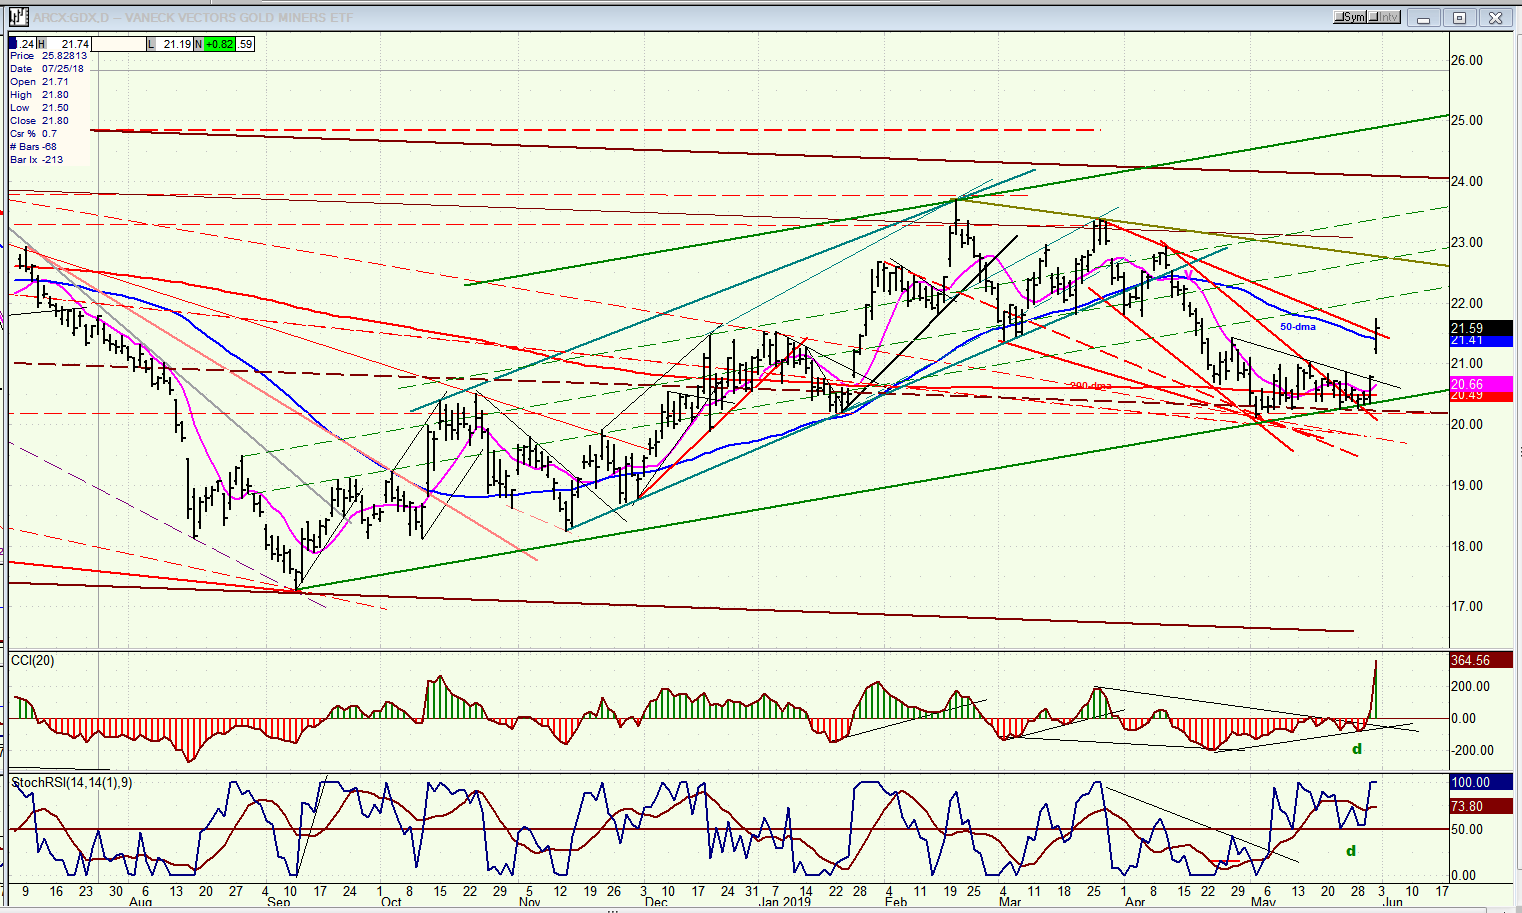
GDX (Gold miners ETF) daily
Last week, the sub-title of my Newsletter was “Is Gold Ready to Stir?” What do you think? Did GDX stir? By closing on Friday above its 200-dma , its 50-dma, and outside of its red channel line, GDX has given a break-out signal which only needs a little follow-through on Monday to be confirmed. Its immediate target should be about 22.00+, and after a little consolidation, it should be ready to challenge the green trend line, above.
Another confirmation would come from the beginning of a correction by UUP. Monday will be an important day for both of these indices.
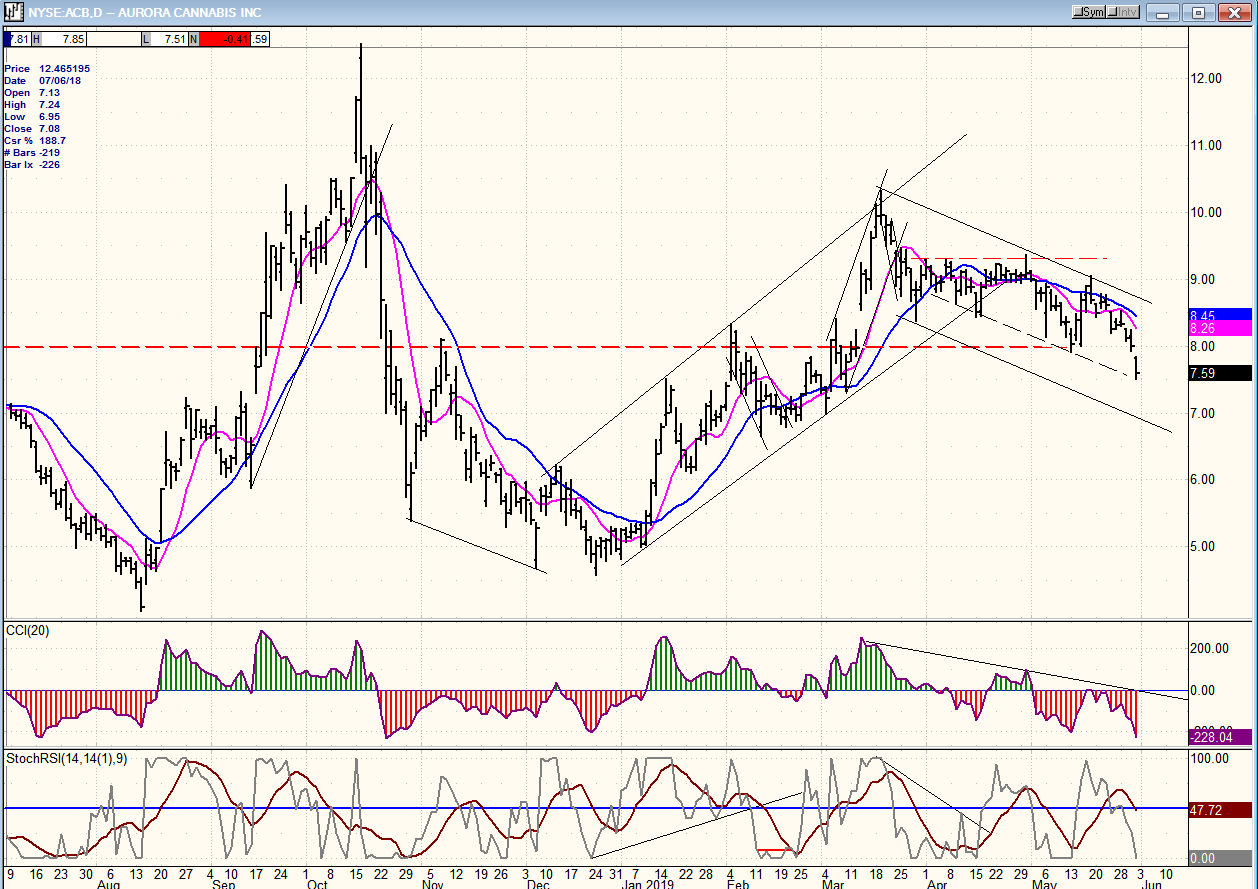
ACB (Aurora Cannabis) daily
ACB moves along with the market. So, unless there is some internal development to motivate buyers, we’ll have to wait for a rally in SPX before we get a rally in this stock.
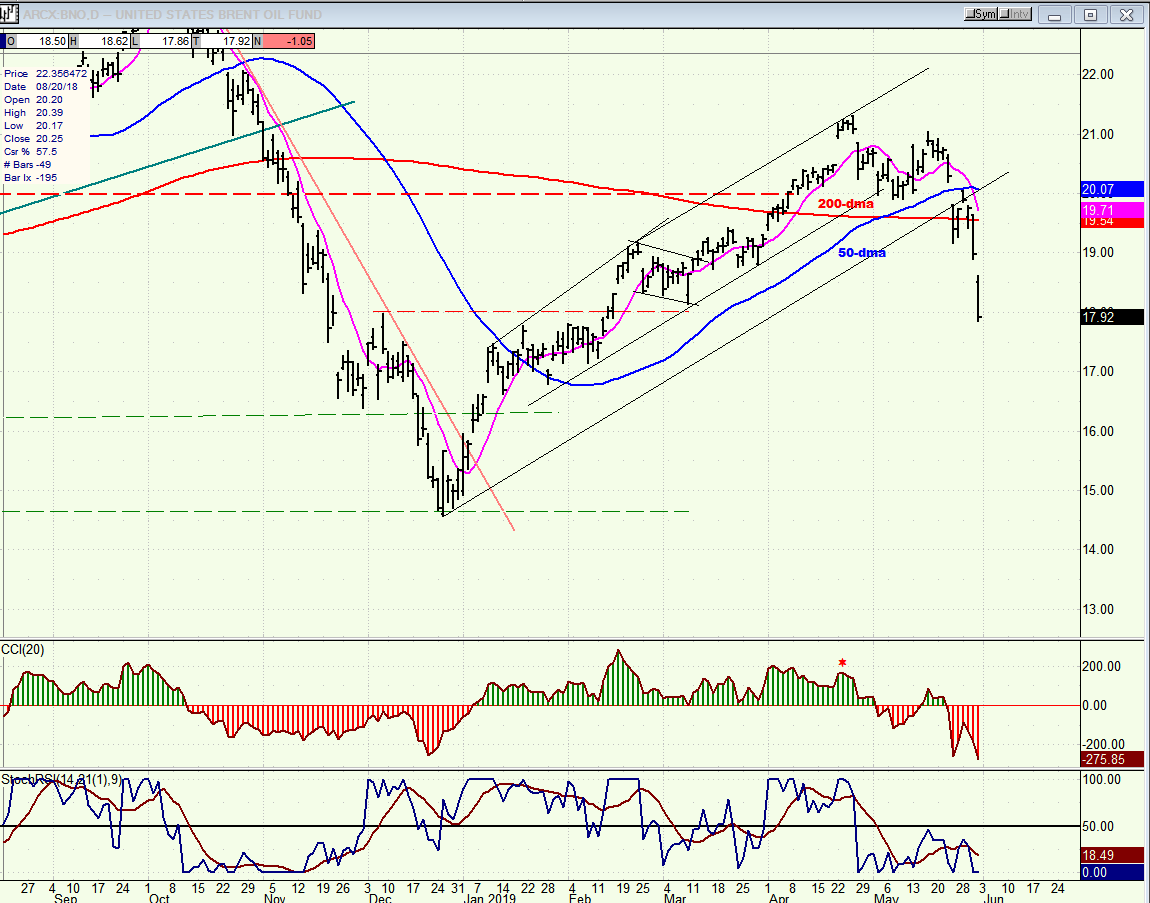
BNO (U.S. Brent oil fund) daily
Obviously, BNO also moves with the market, but even more so! It has already retraced 50% of its rally from its low of 14.58. Since it came all the way down from 46.00 in early 2014, it is more than likely that the fund is in the process of creating a large base from which it will be able to start a new uptrend when the market correction is over.
Summary
Last week, SPX made a new low in the downtrend which started at 2954. It should be just about ready for another rally, but ideally not before it reaches ~2715 -- in spite of positive divergence beginning to appear in the hourly indicators, and the probability that we are near the low of a 45-d cycle which could bring a reversal at any time.
FREE TRIAL SUBSCRIPTON
With a trial subscription, you will have access to the same information that is given to paid subscribers, but for a limited time period. I think you will find that knowing how far a move can carry is one of the most useful benefits of this service, whether you are a trader or an investor -- especially when this price target is confirmed by reliable indicators which give advance warning of a market top or bottom. Furthermore, cycle analysis adds the all- important time element to the above price projections.
For a FREE 4-week trial, further subscription options, payment plans, and for general information, I encourage you to visit my website at www.marketurningpoints.com.
The above comments about the financial markets are based purely on what I consider to be sound technical analysis principles. They represent my own opinion and are not meant to be construed as trading or investment advice, but are offered as an analytical point of view which might be of interest to those who follow stock market cycles and technical analysis.

When Andre Gratian was a stock broker years ago, a friend introduced him to technical analysis of the market. Consequently, it is not an exaggeration to say that Andre fell in love with this approach! Ever since then, it has become an increasingly important part of his professional life. Gratian has studied the works of Wyckoff, Edwards & Magee, Edward J. Dewey (cycles) and many others. However, one of my most profitable undertaking has probably been to study Point & Figure charting, which he finds invaluable in analyzing stocks and indices. If he were restricted to one methodology, this is the one that he would choose. This well-rounded background has given him what he feels to be a special insight into the stock market, facilitating the recognition of meaningful patterns and the ‘turning points’ in all trends, whether they be short or long term. Andre feels very comfortable discussing the stock market and passing on meaningful information to others. His subscribers include individuals and money managers throughout the world. Moreover, his Newsletters are currently published on several financial sites, here and abroad.
More from Gold-Eagle


