Technical Analysis Of The Markets


Current Position of the Market
SPX: Long-term trend – Final long-term phase on the way? How much longer, is the question.
Intermediate trend – The continued strength has muddied the water and we may have to wait until August before the intermediate trend becomes more clear.
Analysis of the short-term trend is done on a daily basis with the help of hourly charts. It is an important adjunct to the analysis of daily and weekly charts which discusses the course of longer market trends.
All Eyes on the Fed
Market Overview
Lately, the market trend has been reduced to a grinding move to new highs – or is it really “the market”? Inspired by a new high in the Nasdaq 100, SPX made a new high this past week! But the Dow did not! And the NYSE composite – the broadest exchange of all – did not! And, of course, the Dow transportation index and the Russell 2000 index have been laggards by a wide margin all year! So, how do we characterize this market trend? Even the most astute Elliot wave technicians are puzzled by this market action. How long can it go on this way? Perhaps we can draw some wisdom from Yogi Berra: “It ain’t over till it’s over!” Next week, at its next FOMC meeting, the Fed is widely expected to cut interest rates by a quarter point. Is that what the market is waiting for, to roll over and acknowledge a weakening economy? We shall see!
There is no question that we have the kind of technical underpinning which suggests that a reversal is imminent. And we know from experience that a reversal trend is often initiated by a catalyst of sorts. Perhaps the widely anticipated rate cut will provide it. In any case, it’s probably futile to speculate on when the turn will arrive. It’s enough to know that the conditions are ripe for one and that we should be prepared.
Technical Analysis (Charts appearing below are courtesy of QCharts.)
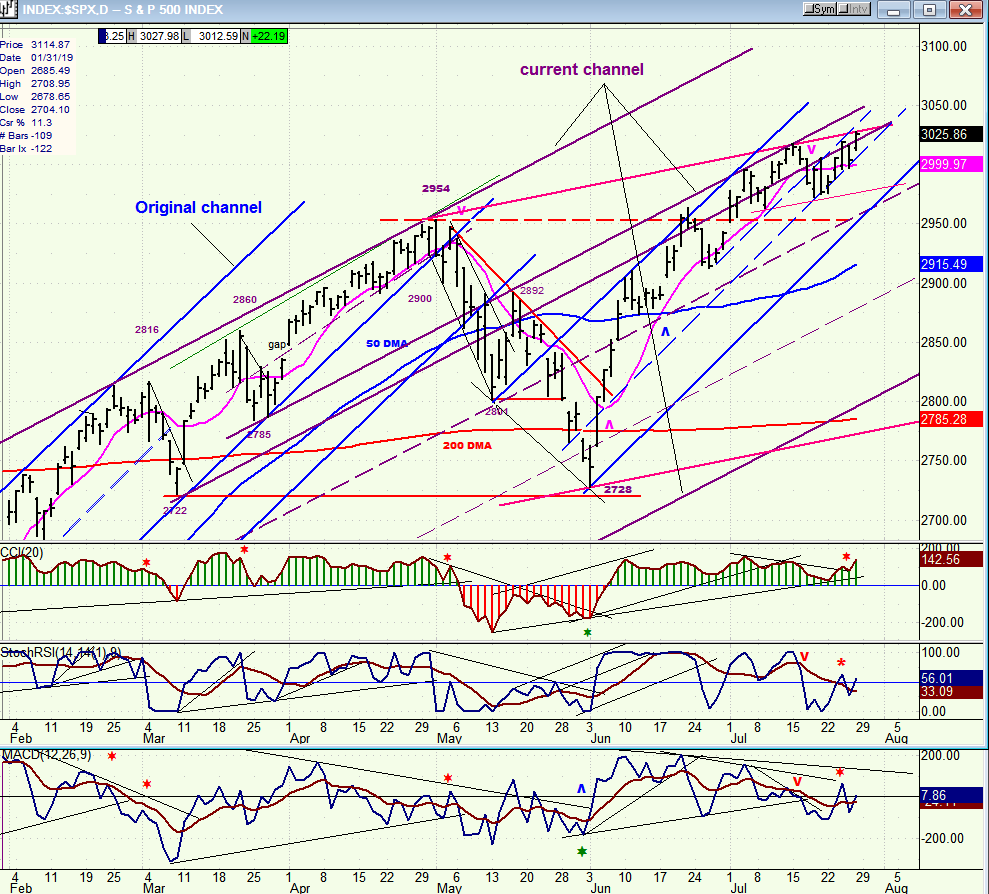
SPX daily chart
The original trend channel from 2346 has already given way to another and current channel which, itself, also looks ready to roll over but is in no hurry to do so. Within the new, wide current channel, the index is moving in a short-term blue channel which is running parallel to the original blue channel. Focusing on that shorter channel, within it prices have already decelerated and are moving closer to its bottom channel line. It’s therefore obvious that the SPX is being subjected to a broad deceleration pattern which has not yet succeeded in reversing the trend completely, but appears to be getting closer and closer to it. When it does, how will it do it, in slow motion, or all at once? The latter is more likely since traders and fund managers tend to act in concert. Next week, there are two potential catalysts that can act as a trigger for a trend reversal: the FOMC meeting on Wednesday, and the jobs report on Friday. But we cannot ignore the possibility that one, or both, will ingest new life into the market, at least temporarily. This is why we must wait and see how the market reacts. Either way, we won’t have much longer to wait
A move outside the small blue channel and below the 50-dma would likely be followed by additional selling which might not subside until we get to the lower trend line of the larger purple channel. Two weeks ago, combined negative divergence in the hourly and daily indicators suggested that the index could be vulnerable to a decline as early as last Monday or Tuesday. The fact that this did not materialize is most likely due to the fact that the FOMC meeting and rate cut was still ahead. We have the same situation this week with only the top oscillator pushing a little higher; the other two did not, and we are still waiting for that fateful meeting. But conditions will be substantially different by the end of next week, and I suspect that the technical condition of the market will have changed materially as well.
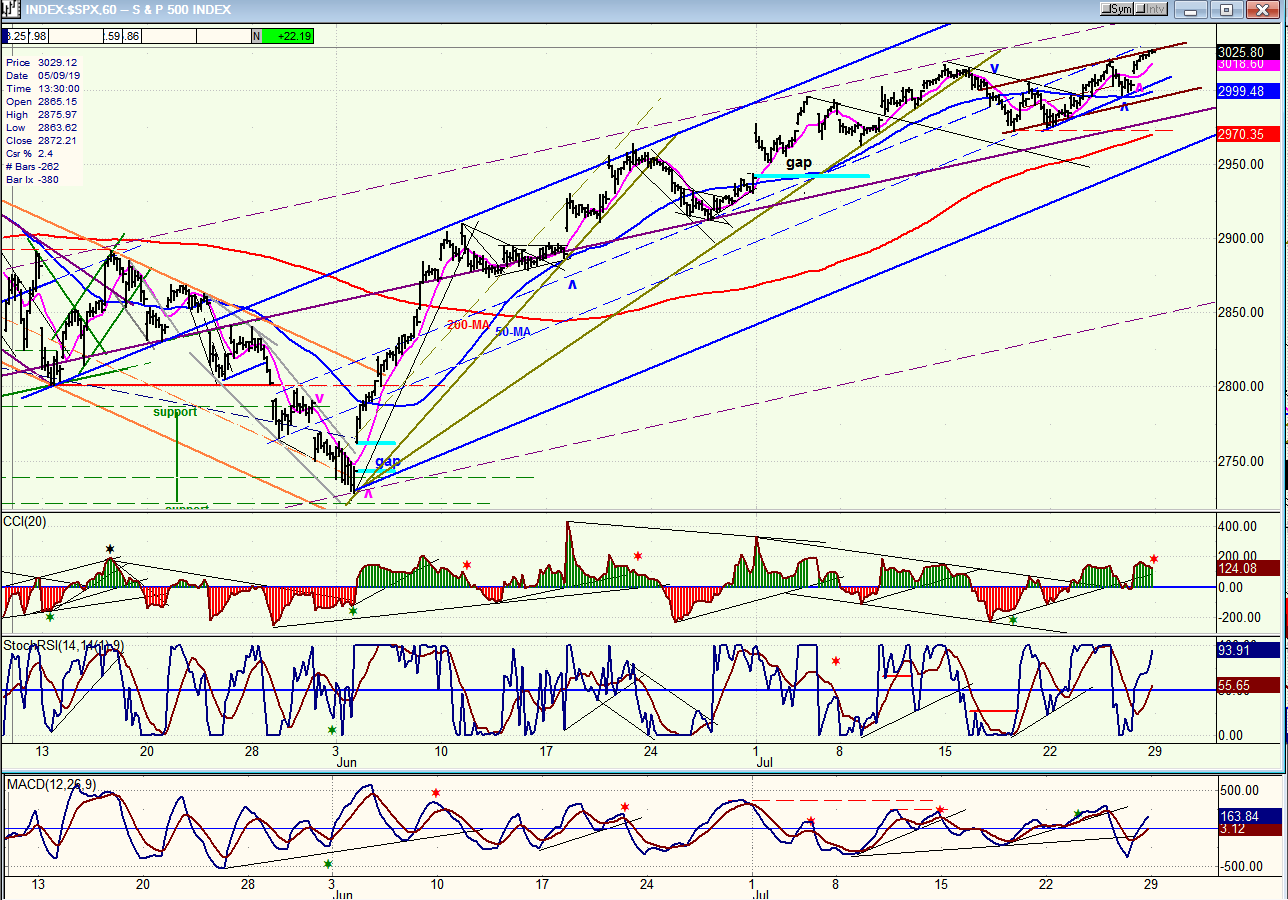
SPX hourly chart
The cycle which caused the last minor pull-back to 2975 on the 22nd was a disappointment for the bears, since it fell at least 25 points shy of its intended target; all the more, because it was a cycle of about the same length as the one which made its low at 2729 on 6/03 and caused a much greater retracement. Rather than being an indication of strength -- which is negated by the fact that it has not caused much of a rally since -- this lack of weakness was most likely due to traders waiting with bated breath to see what the Fed is going to do next Wednesday, i.e. their decision to hold up the market. One reason why I believe that there could be a good sell-off in the index after next week is because the cycle which bottomed on 6/03 is due to make its next low on 8/12! That does not guarantee a sharp sell-off into that date but, considering how things are stacked currently, it’s certainly a possibility; and it’s better to go into that date with a cautious attitude. Especially since there is also an 80-day Hurst cycle due to make its low on 8/26. Clearly, if you are trading the market, you are better off for knowing that these two dates can have important ramifications for prices. Any worthwhile retracement would at least take us out of the blue channel shown on the chart and, possibly continue the decline down to about 2800 -- the area of the bottom trend line of the purple “current” channel. After Wednesday, assuming that the FOMC statement engineers a decline and not a rally, I should not have too much trouble coming up with a projection target down to that level in my P&F chart. This would also be about a 70% retracement in the rally from 2789. Granted, this scenario is only speculative, but it is not totally out of the realm of logic and therefore deserves consideration.
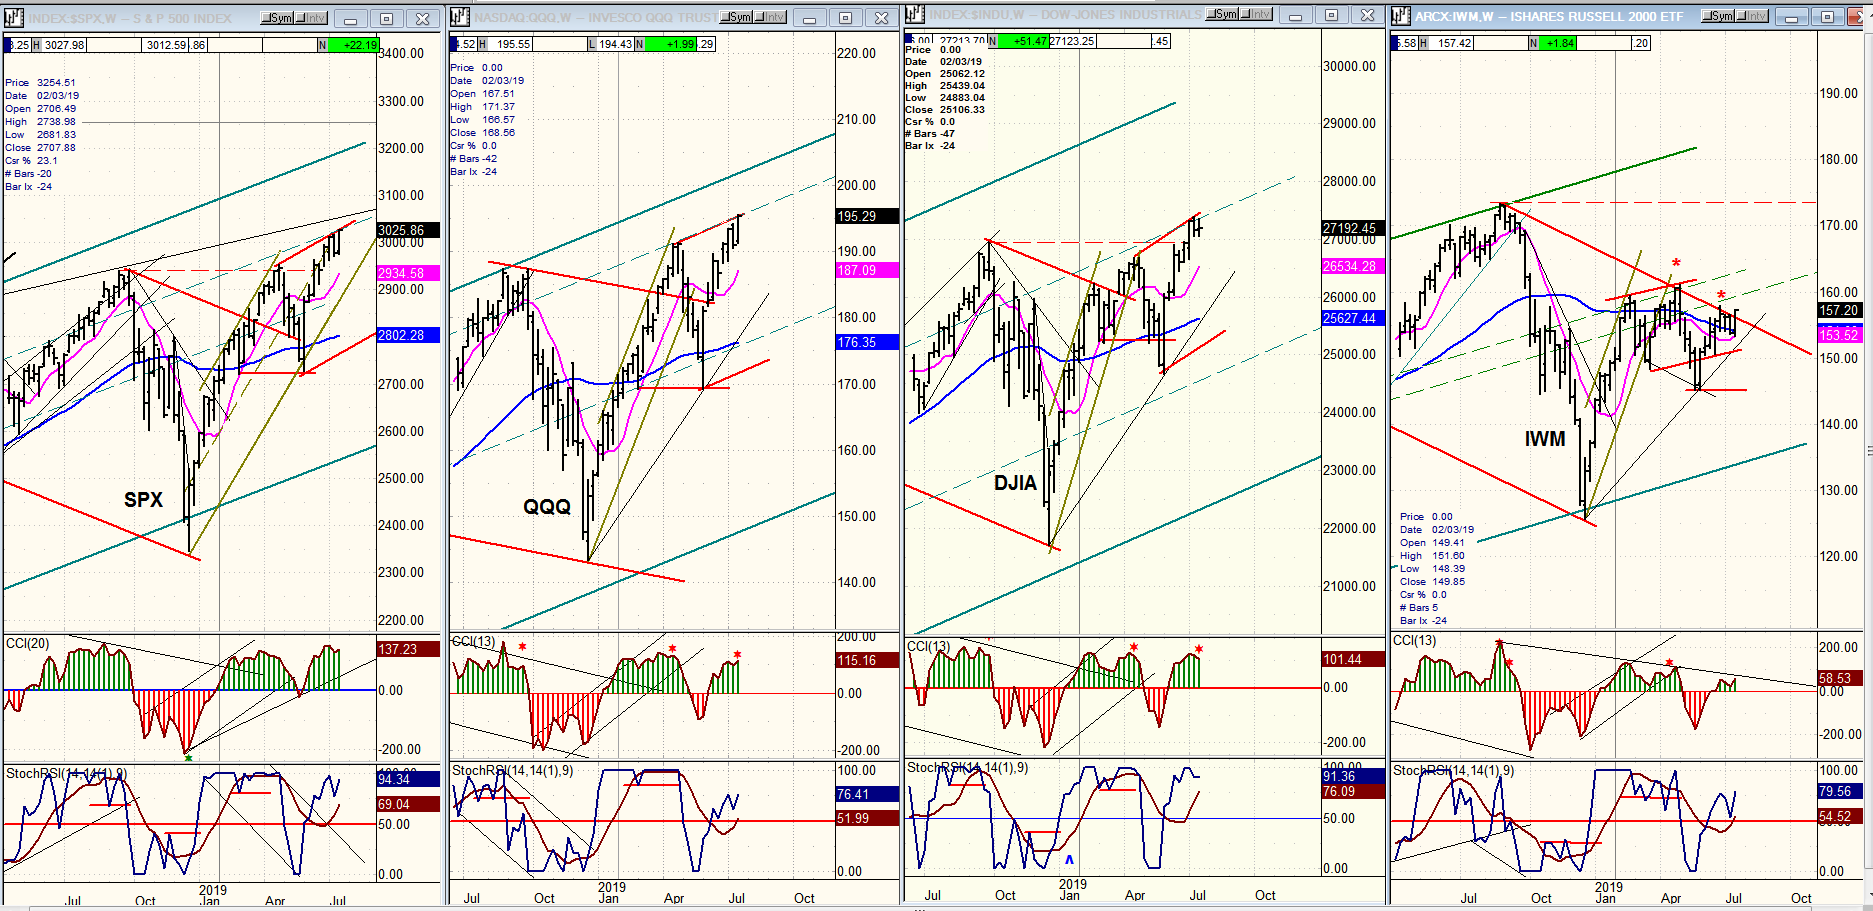
QQQ, SPX, DJIA, IWM (weekly)
There is not much to add to last week. QQQ was a little stronger than SPX and they both made new highs. DJIA did not! IWM tried to do some catching up at the beginning of the week, but was running out of steam by the end.
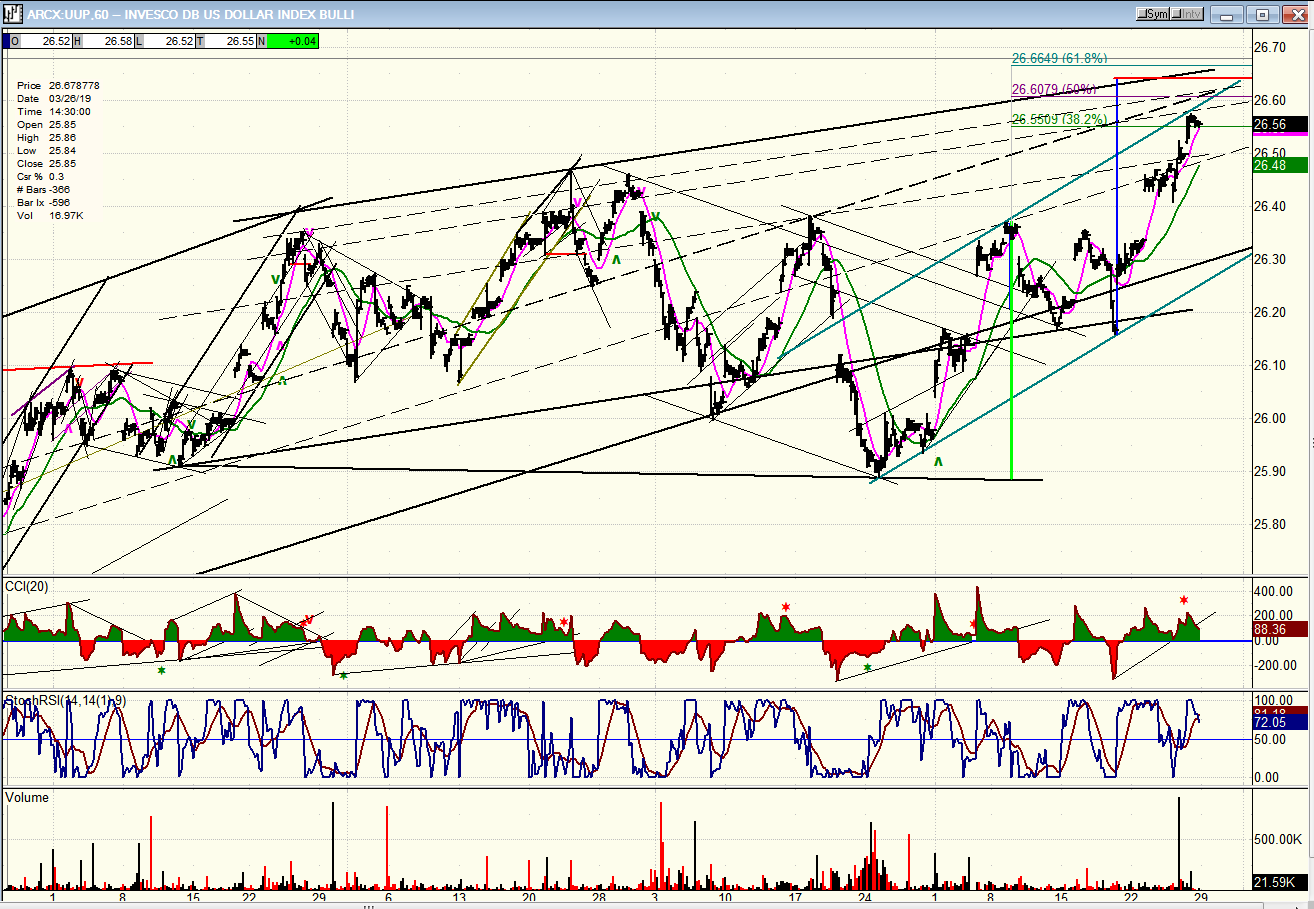
UUP (dollar ETF) daily
This week I am posting an hourly chart of UUP as a result of last week’s action which sent it to a new high. Several months ago, when its price was much lower, I suggested that UUP could reach 26.50 based on its half-point P&F chart. After it started backing off from the 26+ level without touching 26.50, I assumed that it had fallen a little short of its target. Obviously, that was a mistake. Last week, UUP kept right on going and went a little past 26.50; and it does not look quite finished! A measured move (blue line) would take it to 26.64; a 50% Fib extension of the first wave from 25.90 gives us 26.61, and there are several lines slightly higher which could bring about final resistance. There is also the suggestion of one more little wave higher to complete the structure and bring the oscillators into a selling position. One more thing! The huge one day volume which occurred last week looks climactic This action is suggestive of a final high and therefore significant not just for the dollar, but for gold as well.
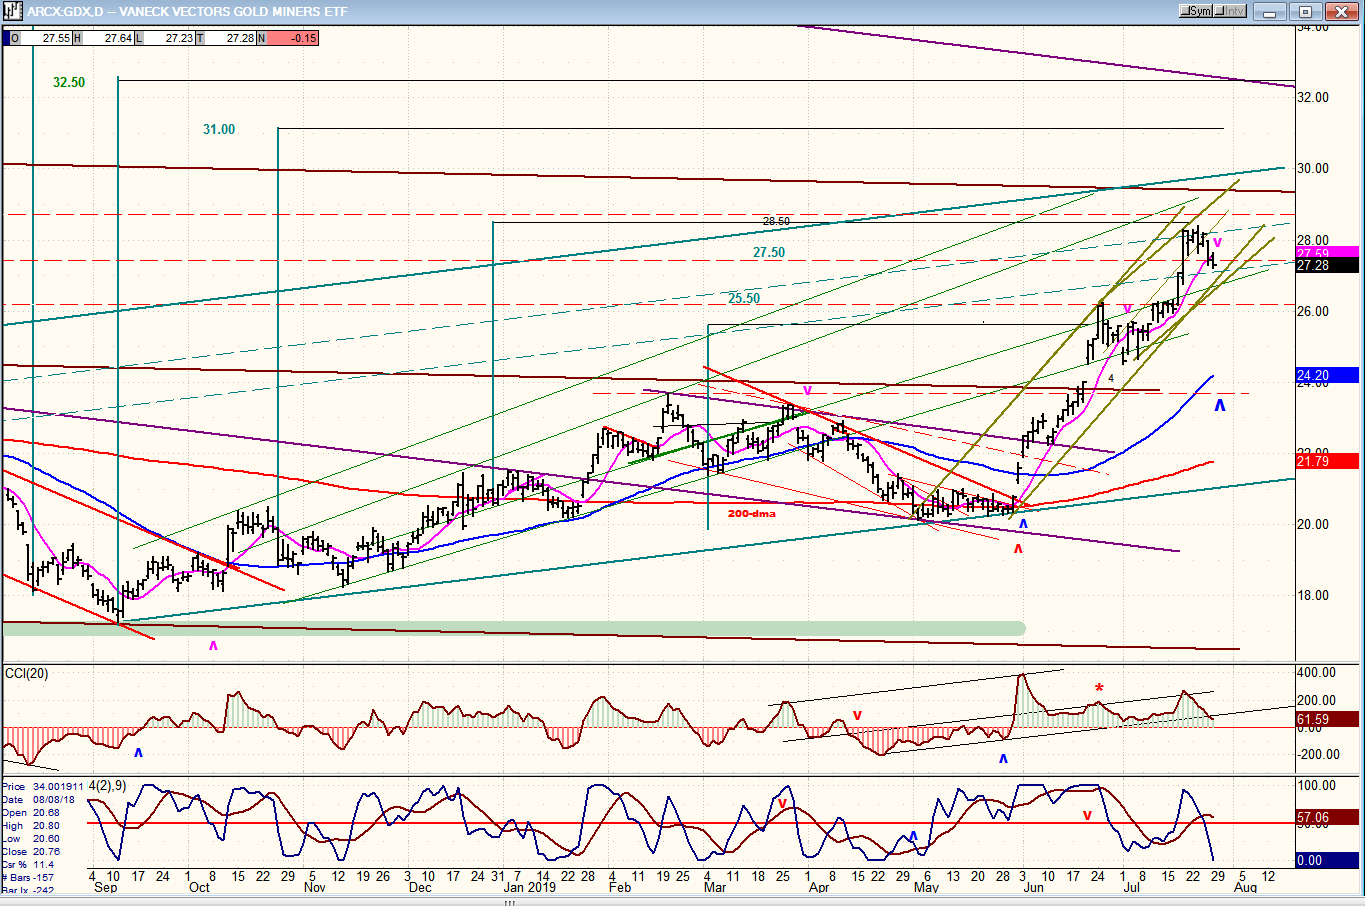
GDX (Gold miners ETF) daily
Since meeting its 28+ target, GDX has started a consolidation pattern which could turn into something more, or remain only that depending on what the dollar does next. Its indicators do not look quite ready to turn the index around, but by the time UUP finishes its move, they could be. Let’s keep a close watch.
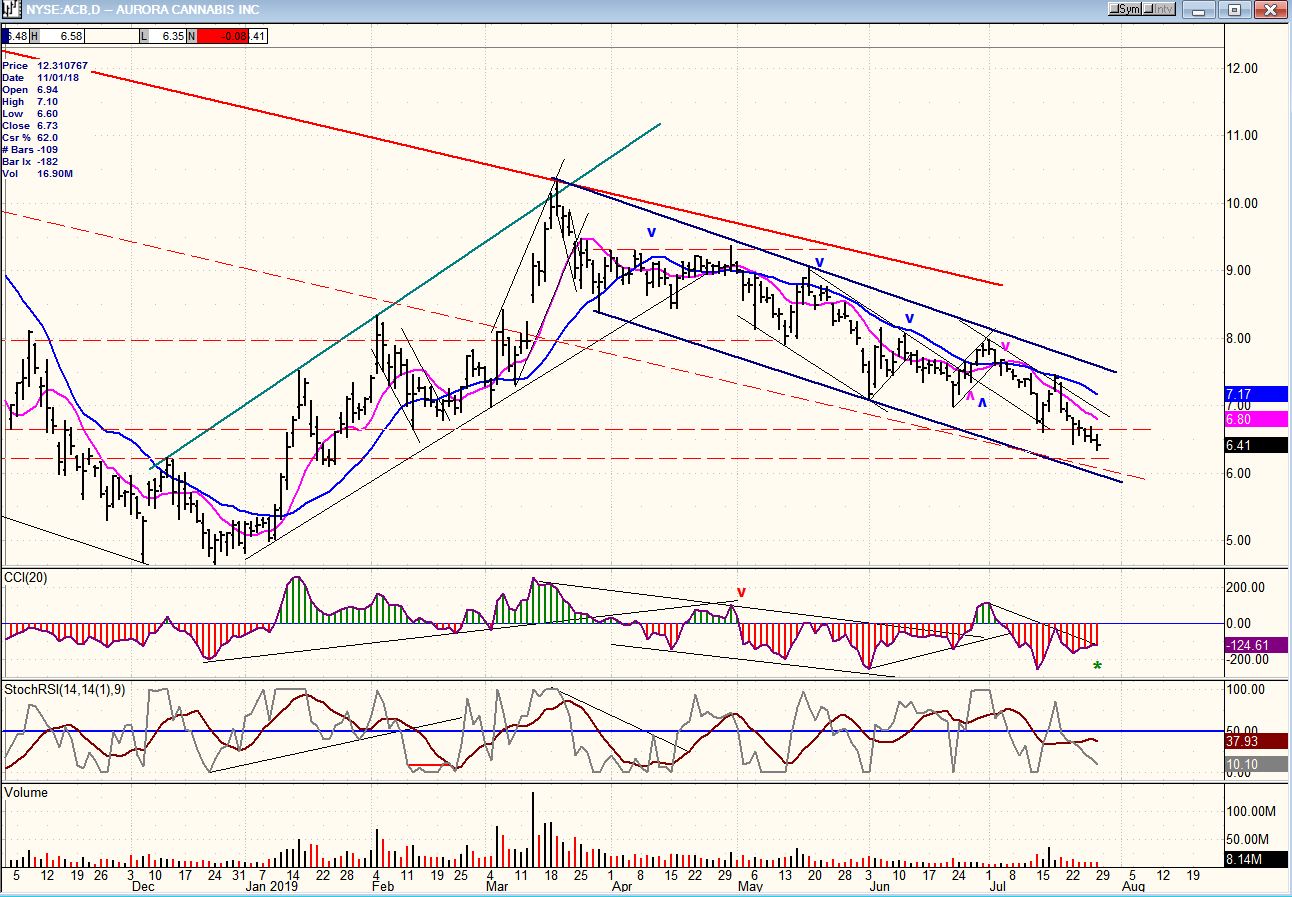
ACB (Aurora Cannabis) daily
Aurora continues its correction in a well-organized manner within a descending channel. Some positive divergence is beginning to show, but SRSI is not ready. There is also a good chance that this consolidation pattern will end with a climactic price and volume pattern.
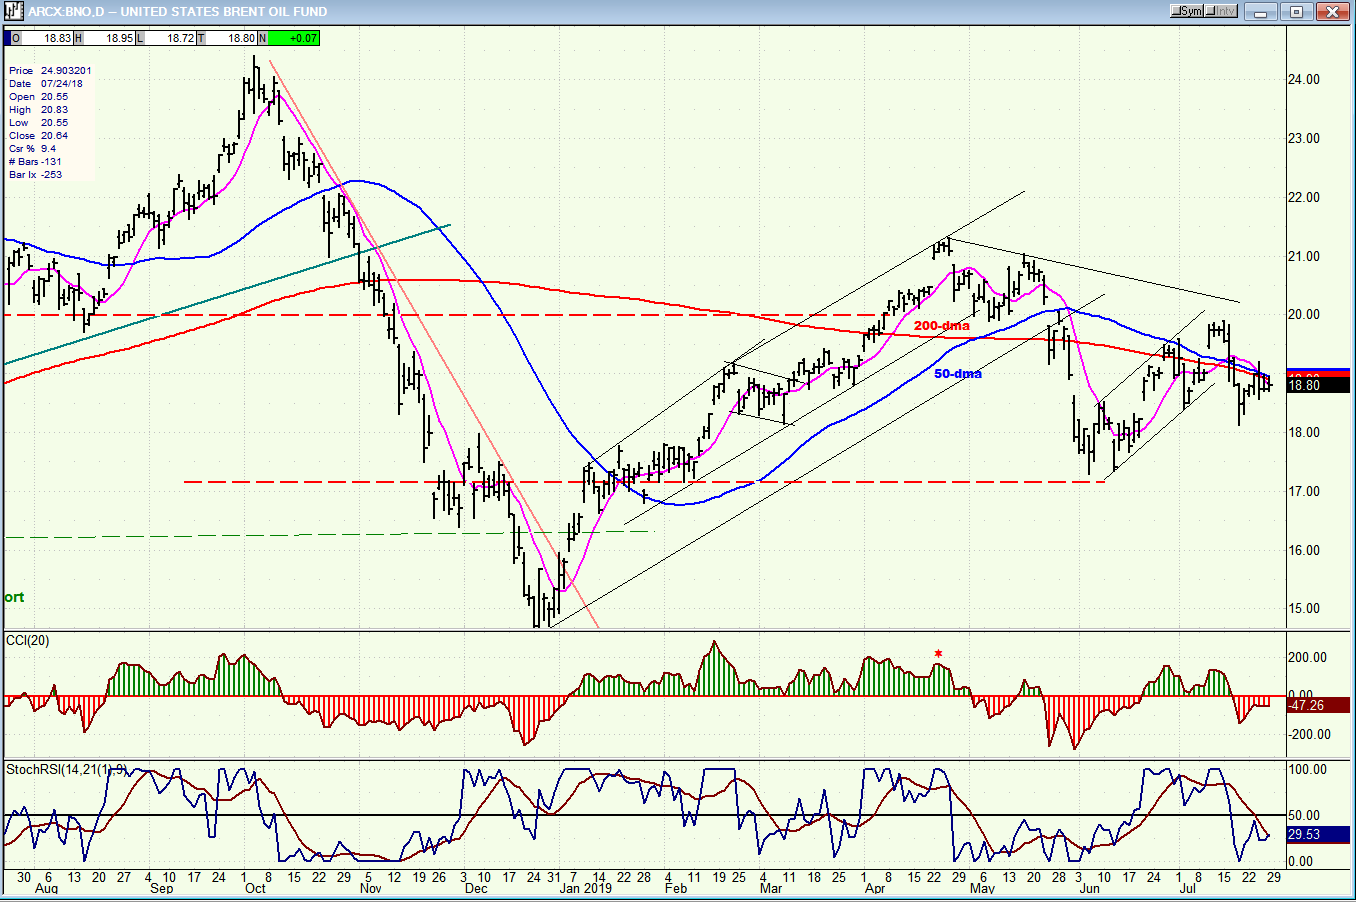
BNO (U.S. Brent oil fund) daily
BNO is hanging just below the various MA cluster. Should the market start to correct next week, it would most likely go along with it.
Summary
Next week could be a game changer for SPX. It will BEAR watching!
FREE TRIAL SUBSCRIPTON
With a trial subscription, you will have access to the same information that is given to paid subscribers, but for a limited time period. I think you will find that knowing how far a move can carry is one of the most useful benefits of this service, whether you are a trader or an investor -- especially when this price target is confirmed by reliable indicators which give advance warning of a market top or bottom. Furthermore, cycle analysis adds the all- important time element to the above price projections.
For a FREE 4-week trial, further subscription options, payment plans, and for general information, I encourage you to visit my website at www.marketurningpoints.com.
The above comments about the financial markets are based purely on what I consider to be sound technical analysis principles. They represent my own opinion and are not meant to be construed as trading or investment advice, but are offered as an analytical point of view which might be of interest to those who follow stock market cycles and technical analysis.
********

When Andre Gratian was a stock broker years ago, a friend introduced him to technical analysis of the market. Consequently, it is not an exaggeration to say that Andre fell in love with this approach! Ever since then, it has become an increasingly important part of his professional life. Gratian has studied the works of Wyckoff, Edwards & Magee, Edward J. Dewey (cycles) and many others. However, one of my most profitable undertaking has probably been to study Point & Figure charting, which he finds invaluable in analyzing stocks and indices. If he were restricted to one methodology, this is the one that he would choose. This well-rounded background has given him what he feels to be a special insight into the stock market, facilitating the recognition of meaningful patterns and the ‘turning points’ in all trends, whether they be short or long term. Andre feels very comfortable discussing the stock market and passing on meaningful information to others. His subscribers include individuals and money managers throughout the world. Moreover, his Newsletters are currently published on several financial sites, here and abroad.


