Technical Analysis Of The Markets


Current Position of the Market
SPX: Long-term trend – There are no clear signs that the bull market is over.
Intermediate trend – Most likely building intermediate top.
Analysis of the short-term trend is done on a daily basis with the help of hourly charts. It is an important adjunct to the analysis of daily and weekly charts which discusses the course of longer market trends.
More Congestion (Distribution)
Market Overview
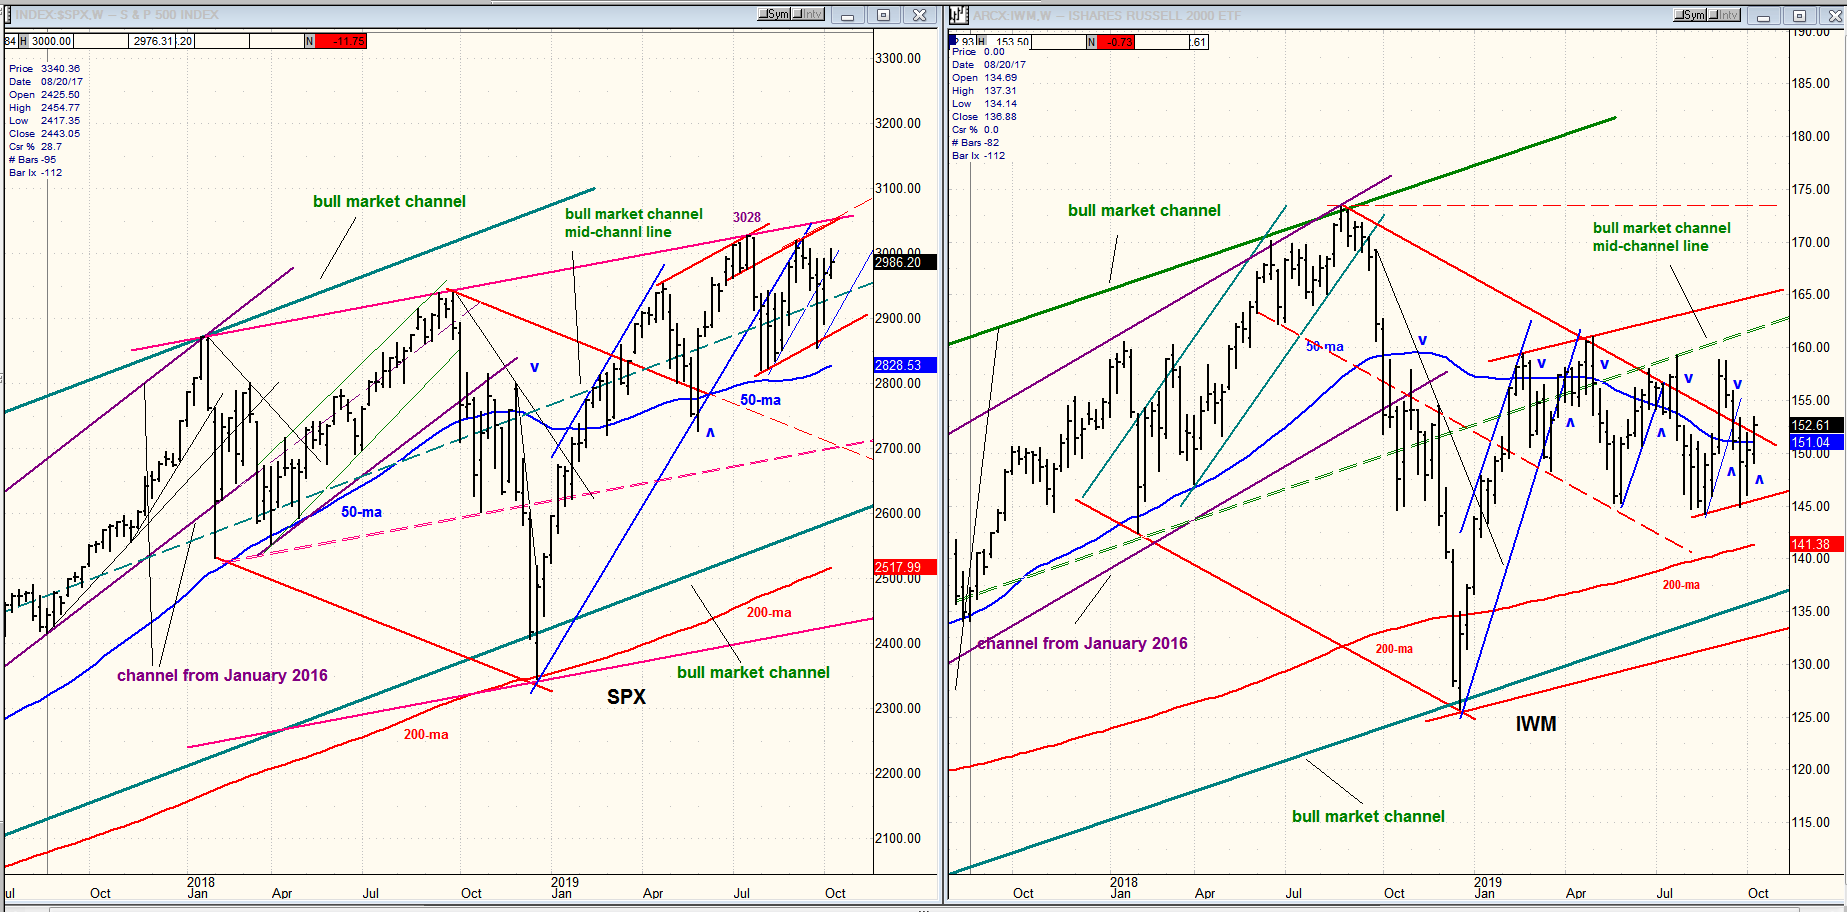
SPX traded in a less than 50-point range last week, continuing what appears to be the formation of an intermediate distribution top which could bring a sizeable correction when complete. IWM, which has done a good job of acting as a barometer for SPX still provides the same reading of relative weakness, thereby advising caution to those who have bullish inclinations. Last week has brought us one week closer to resolving this stalemate which is now 12 weeks old, but a little more patience is still required, and a slightly higher high cannot be discounted.
Market Analysis (All charts are courtesy of QChart)
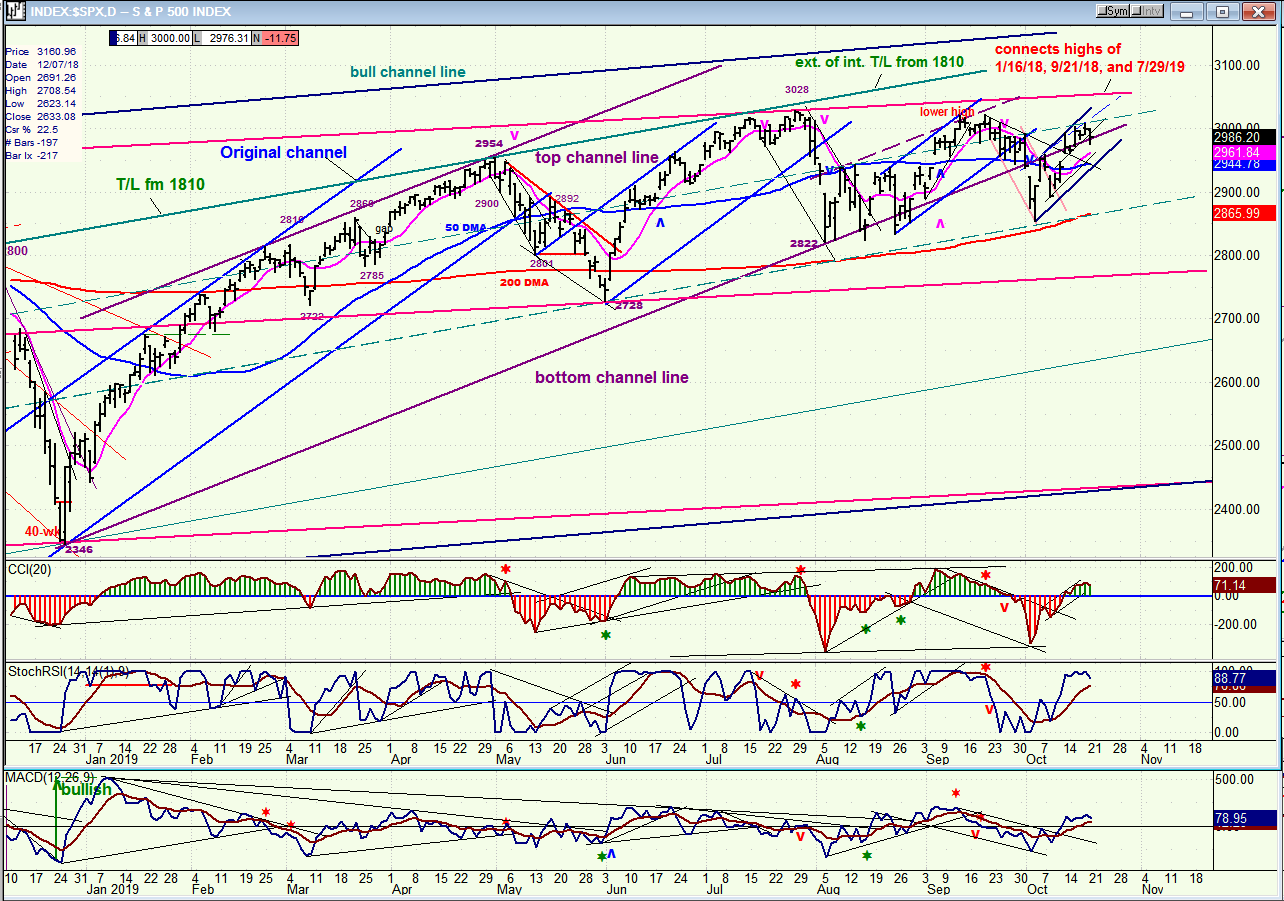
SPX daily chart
My analysis suggests that the resolution will be to the downside. Beyond the relative weakness of IWM, the weekly SPX chart above shows a clear loss of upside momentum. The top of its long-term bull channel was last touched in January 2018. After a pull-back, a new high was made in September 2018 which fell short of the channel top by about 75 points. This was followed by a sharp correction and another new high in July 2019 which, this time, failed to reach the top of the channel by almost 200 points. And here we are, in October, and that last high of 3028 remains intact.
Another point! The intermediate trend line from 1810 (January 2016) was broken by the correction of late 2018. I have extended the trend line on the chart and, as you can see, the index has remained below it. It also remains below the red trend line which connects the last three intermediate highs. I believe that the only rational way to interpret the market action of the past year or so, is by seeing that structure as a large rounding top which, sooner rather than later, will result in a correction that could be even more substantial than the 623-point decline which occurred late last year -- although it could take longer to complete.
The market can avoid this intermediate-term correction (also implied by other analytic points not discussed here) by starting to engage in decisive bullish behavior, beginning with IWM leading on the upside! If, instead it declines below 2820, and then 2720, the odds are pretty good that the correction will not be over until we see the likes of 2200! After that SPX can rise to a new high!
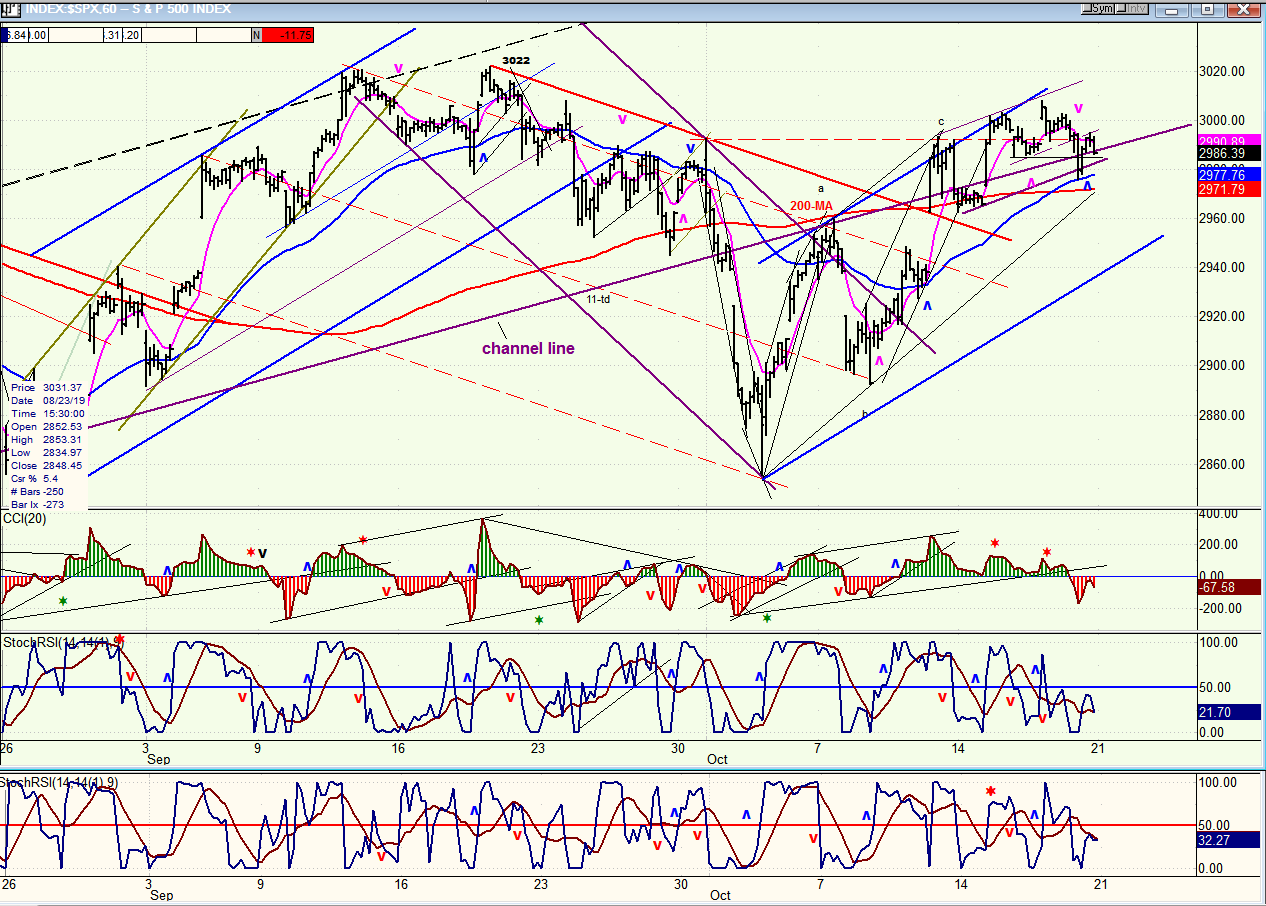
SPX hourly chart
On 7/26, SPX made a new all-time high of 3028. After a correction, it went up again, but could only reach 3022 before correcting again. Last week, the index looked like it was beginning to struggle just above 3000. On Friday, after showing some negative divergence, CCI gave a sell signal along with the other two short-term oscillators which was not voided by a subsequent rally.
The daily channel line was first breached in early September, and more decisively broken after the rally to 3022. Still, there were enough buyers at 2860 to rally the index inside the channel one more time, last week. But by Friday, all it could do was hold on the line at the close while all the oscillators remained in a sell mode. It will take some good news over the week-end to keep SPX in a short-term uptrend!
This is not a good looking pattern, short-term. It looks as if the index has already made a top and wants to reverse. But it will take a break below 2860 (minimum) to get the daily and weekly oscillators in a solid downtrend.
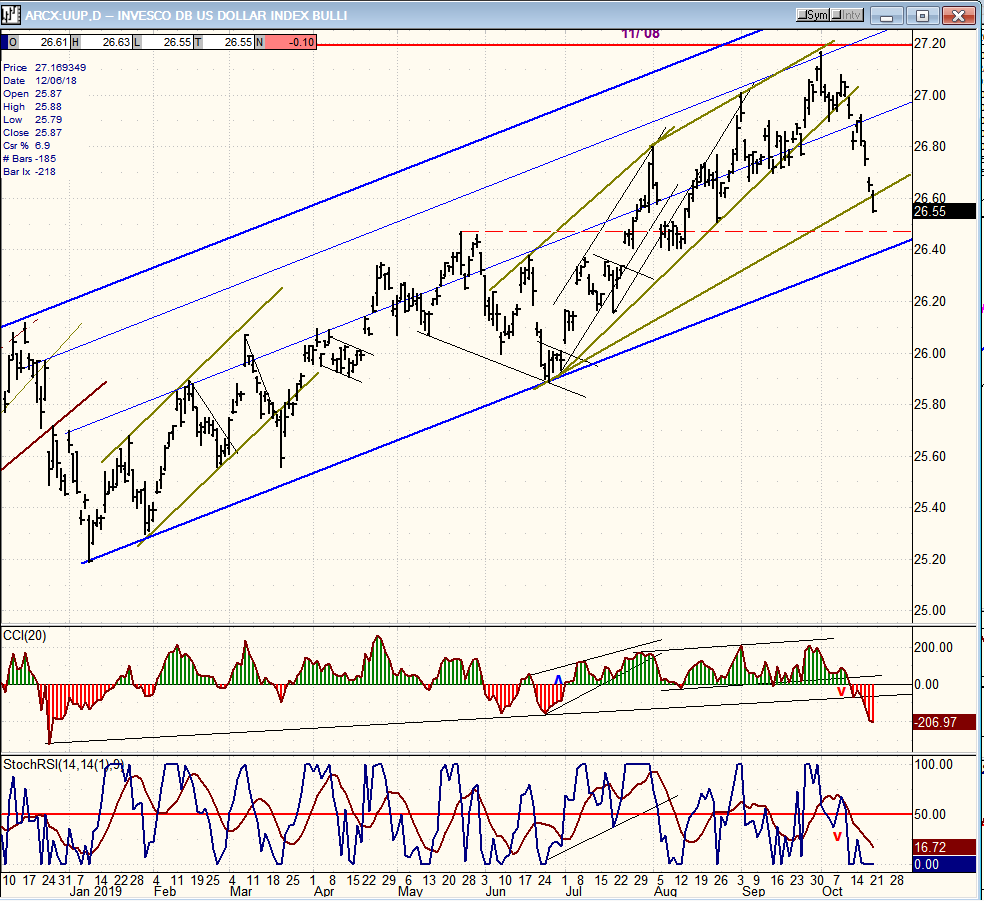
UUP (dollar ETF) daily
UUP has started to correct, and nearly reached the bottom of the blue daily channel. This is partly due to the rally in the British pound and may not be long-lasting. In any case, it would take a break outside of the blue channel to suggest that the dollar has made a substantial trend reversal.
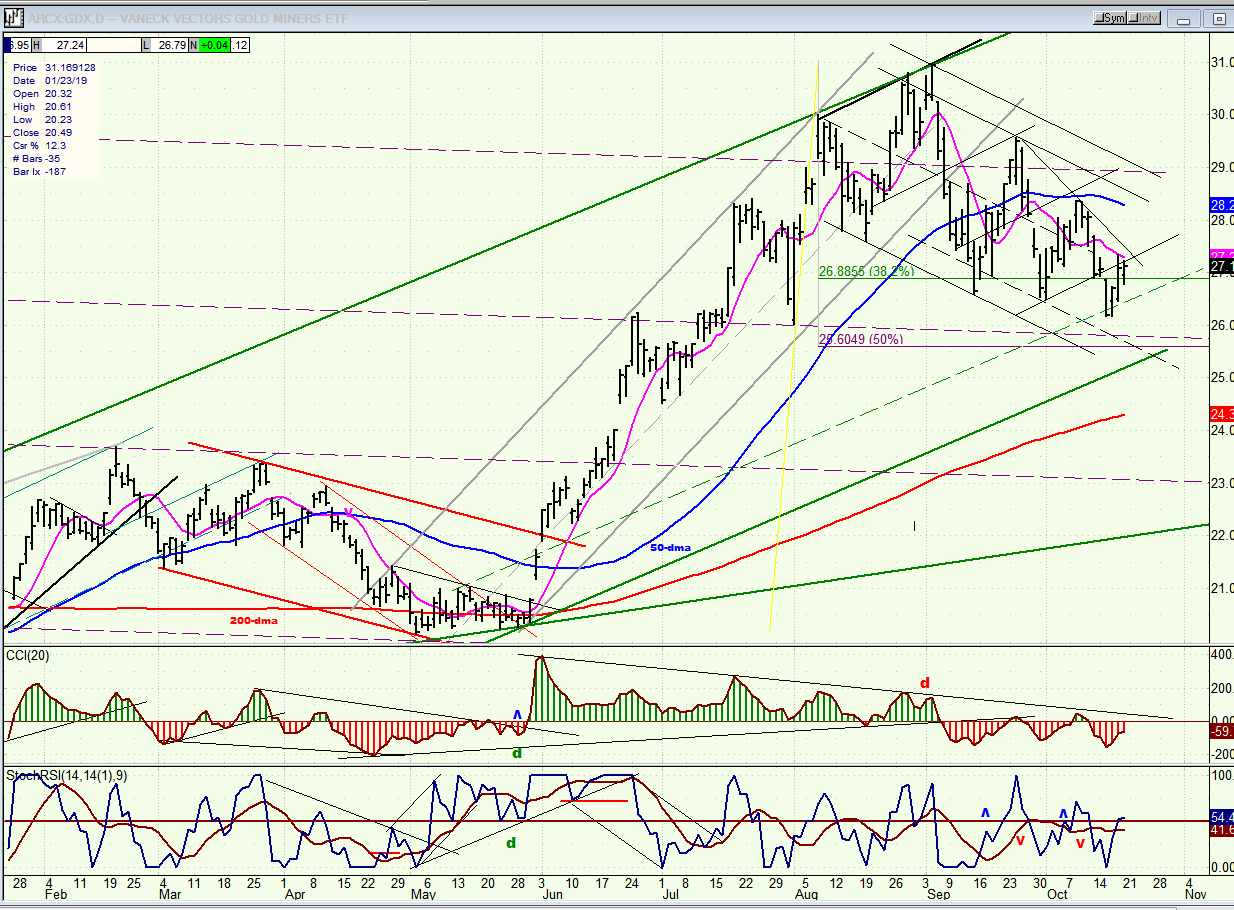
GDX (Gold miners ETF) weekly
After making a new low, GDX has bounced to the mid-point of its current corrective channel. This could be all we get for now, especially if the dollar rallies. The pattern as well as the oscillators suggest that more work (and perhaps reaching 25.50-26.00) is needed before a reversal capable of leading to a new high takes place.
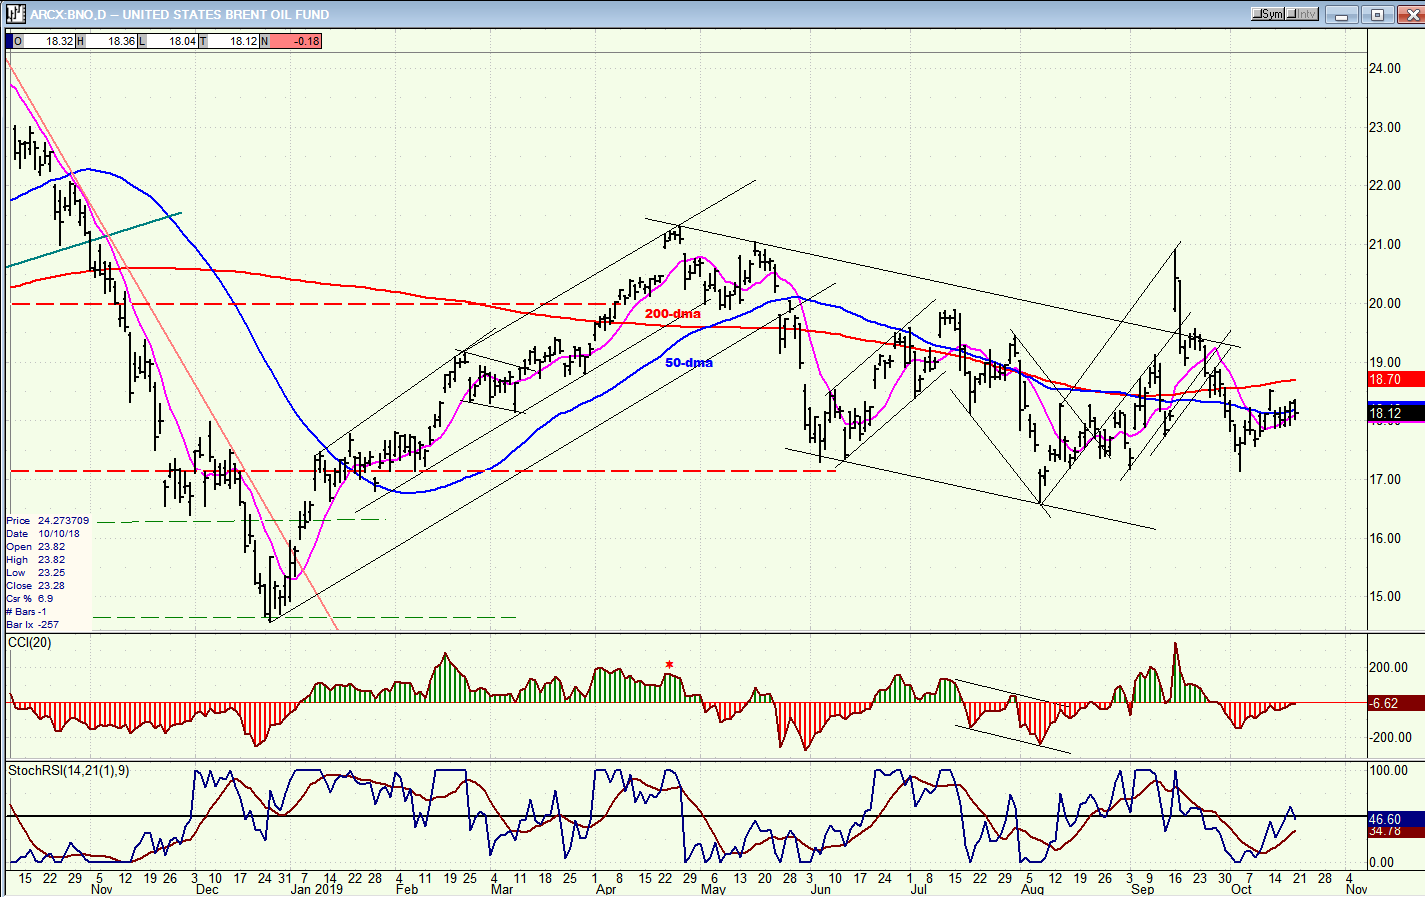
BNO (U.S. Brent oil fund) daily
BNO looks vulnerable to additional decline from this level.
Summary
SPX may not be very far from starting a correction which could rival if not surpass the one which occurred at the end of last year. Only an immediate and obvious resurgence of buying could alter this perception.
FREE TRIAL SUBSCRIPTON
With a trial subscription, you will have access to the same information that is given to paid subscribers, but for a limited time period. I think you will find that knowing how far a move can carry is one of the most useful benefits of this service, whether you are a trader or an investor -- especially when this price target is confirmed by reliable indicators which give advance warning of a market top or bottom. Furthermore, cycle analysis adds the all- important time element to the above price projections. For a FREE 4-week trial, further subscription options, payment plans, and for general information, I encourage you to visit my website at www.marketurningpoints.com.
The above comments about the financial markets are based purely on what I consider to be sound technical analysis principles. They represent my own opinion and are not meant to be construed as trading or investment advice, but are offered as an analytical point of view which might be of interest to those who follow stock market cycles and technical analysis.
********

When Andre Gratian was a stock broker years ago, a friend introduced him to technical analysis of the market. Consequently, it is not an exaggeration to say that Andre fell in love with this approach! Ever since then, it has become an increasingly important part of his professional life. Gratian has studied the works of Wyckoff, Edwards & Magee, Edward J. Dewey (cycles) and many others. However, one of my most profitable undertaking has probably been to study Point & Figure charting, which he finds invaluable in analyzing stocks and indices. If he were restricted to one methodology, this is the one that he would choose. This well-rounded background has given him what he feels to be a special insight into the stock market, facilitating the recognition of meaningful patterns and the ‘turning points’ in all trends, whether they be short or long term. Andre feels very comfortable discussing the stock market and passing on meaningful information to others. His subscribers include individuals and money managers throughout the world. Moreover, his Newsletters are currently published on several financial sites, here and abroad.
More from Gold-Eagle


