Technical Analysis Of The Markets


Current Position of the Market
SPX: Long-term trend – There are no signs that the bull market is over.
Intermediate trend – Most likely approaching an intermediate top.
Analysis of the short-term trend is done on a daily basis with the help of hourly charts. It is an important adjunct to the analysis of daily and weekly charts which discusses the course of longer market trends.
Market Review
Point & Figure Overview of SPX
Correctly predicting the market trend requires an objective analysis of the supply and demand forces which are constantly in play. In my opinion, the methodology of P&F is one of the best ways to demonstrate graphically this perennial struggle.
Long-term trend: The bull market which started in 03/09 shows no sign of having run its course. A rough count taken on the long-term Point & Figure chart gives us a potential target to as high as 4080.
Intermediate trend: Based again on the long-term P&F chart, if 3160-3180 fails to bring about an intermediate top, we could see the index run up to ~3240 after a minor correction has taken place. The 3180 target has been met!
Short-term trend: SPX pushed to the 3180 projection and is forming a congestion pattern which may not be complete. Short-term high could see max 3190-95.
Market Analysis (All charts are courtesy of QChart)
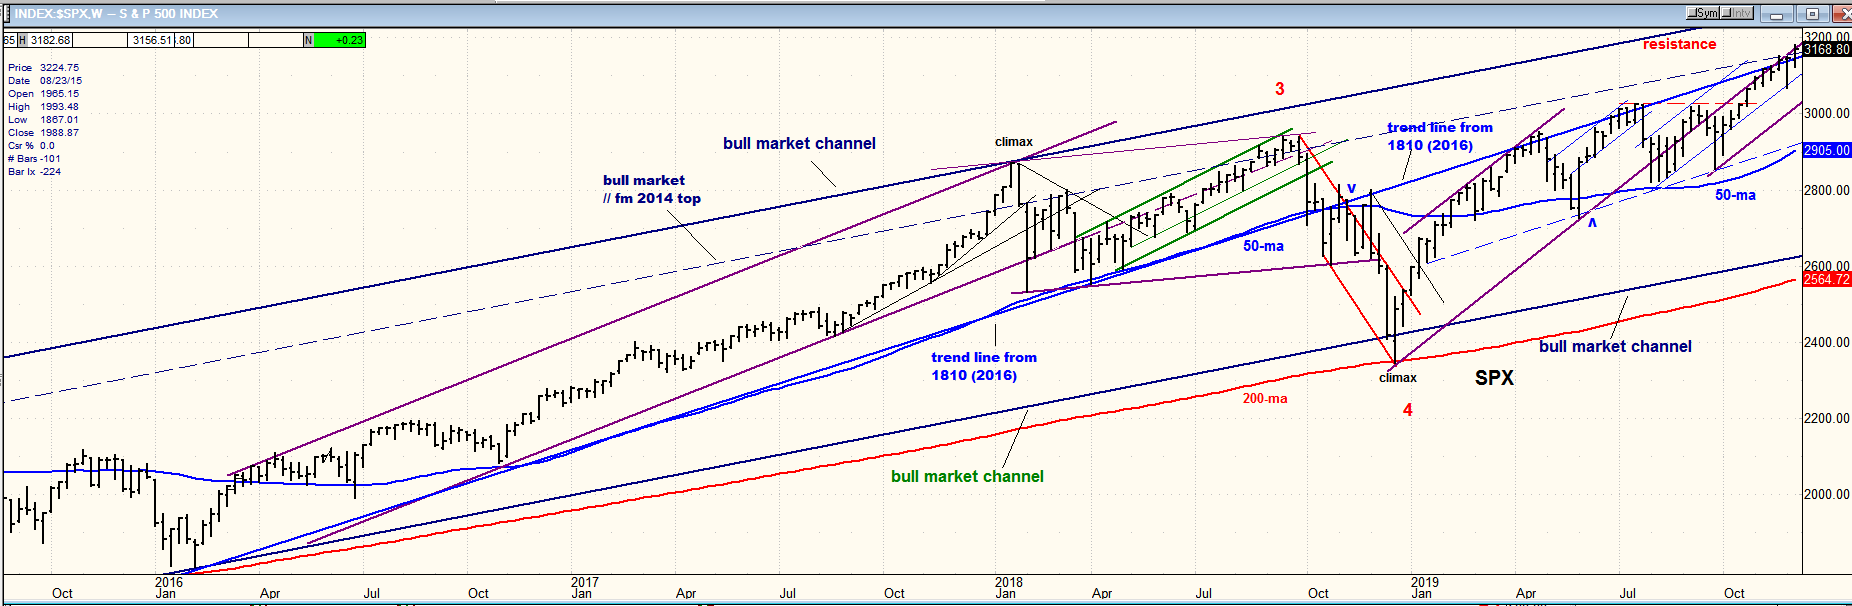
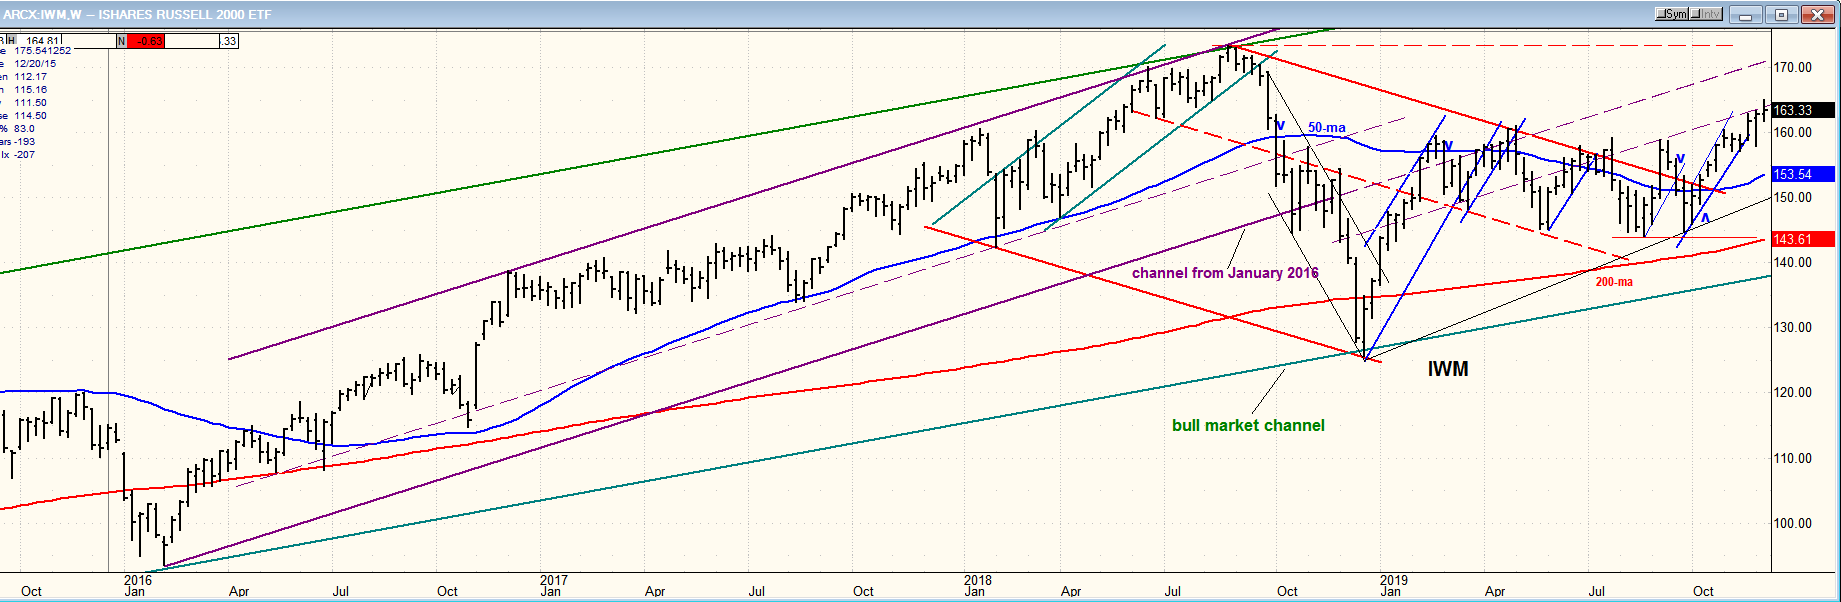
SPX-IWM weekly charts
Both indexes made a new weekly high and closed higher, persisting in their intermediate uptrend with no significant alteration of their relative strength. SPX did reach 3180, which could turn out to be an intermediate high if it cannot be exceeded, but this would require that a more important congestion (distribution) formation be built in this general area before the start of a correction.
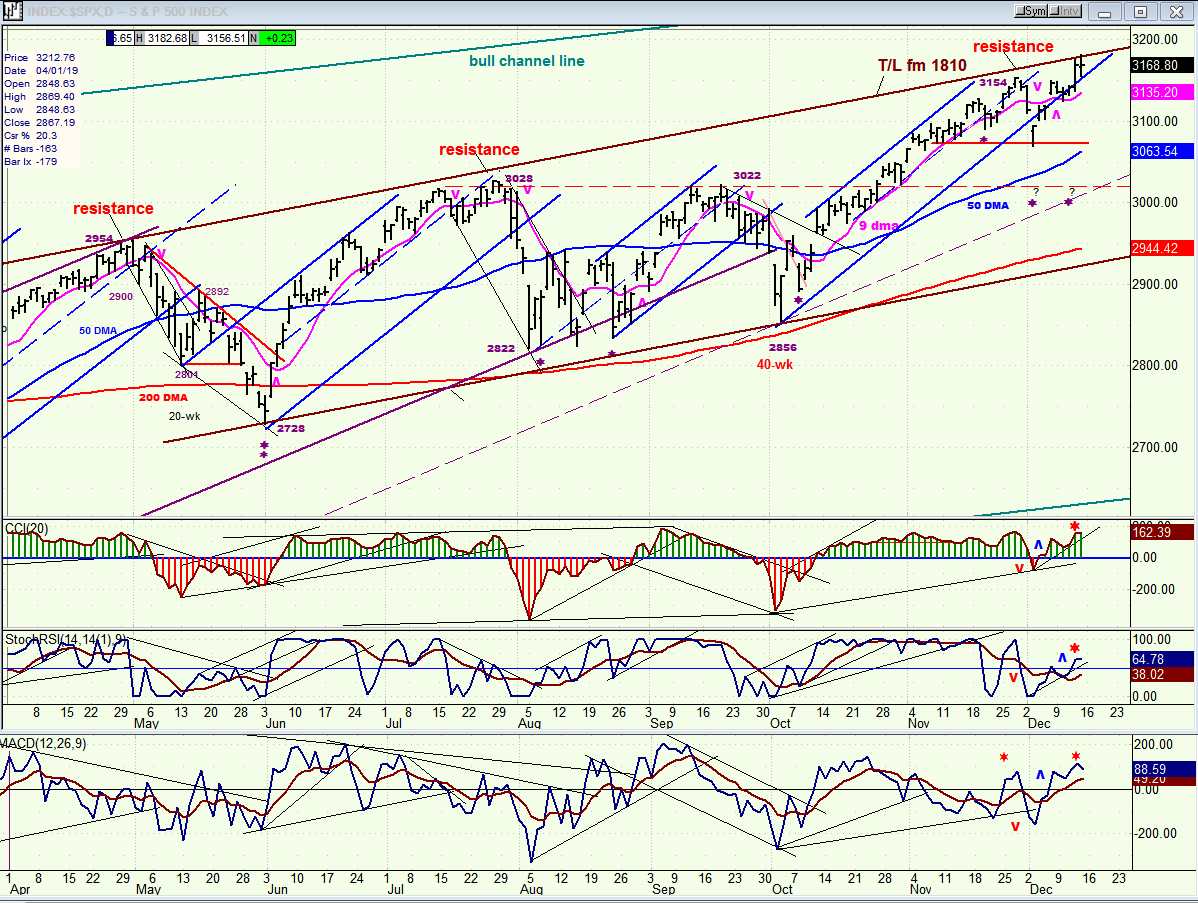
SPX daily chart
On Friday, buoyed by bullish news, SPX poked its head slightly above the trend line from 1810 which has proven to offer major resistance to all uptrends since the 2346 low of a year ago. On Friday, it was challenged once again, but the move was repulsed and the index closed practically unchanged.
The trend line from 1810 has now formed the top of an intermediate channel. The bottom channel line has been drawn as a parallel at the 2728 level and it has already arrested three short-term declines. The index appears to be trading comfortably within the confines of that channel and does not seem ready to come out of it on either side.
Considering the negative divergence which has formed in the oscillators at the bottom of the chart and the resistance just above Friday’s close, it is likely that we are about ready to put an end to the trend from 2856. Furthermore, the important 3180 projection has now been met, which is an additional warning that the odds favor a price reversal from this level. It would take a daily close below 3135 to create a sell signal.
SPX hourly chart
It’s highly probable that SPX’s run from 2856 (326 points) is coming to an end. Besides filling the P&F projection to 3180, negative divergence has also formed on the hourly oscillators, and two of the three have already given a sell signal.
To begin a correction of intermediate nature, the index would have to trade below 3070, but since there has not been enough distribution above that level to warrant this kind of a decline, this is unlikely to occur in the near future. The long-term P&F chart also suggests that SPX could push up to ~3240 before finding an intermediate top. Consequently, our best bet is to form only a short-term top around 3180 and then attempt to push a little higher before we are in a position to complete a top of intermediate proportion.
If we should start to correct immediately, it’s unlikely that we will see a decline totaling more that 30-50 points over the short term.

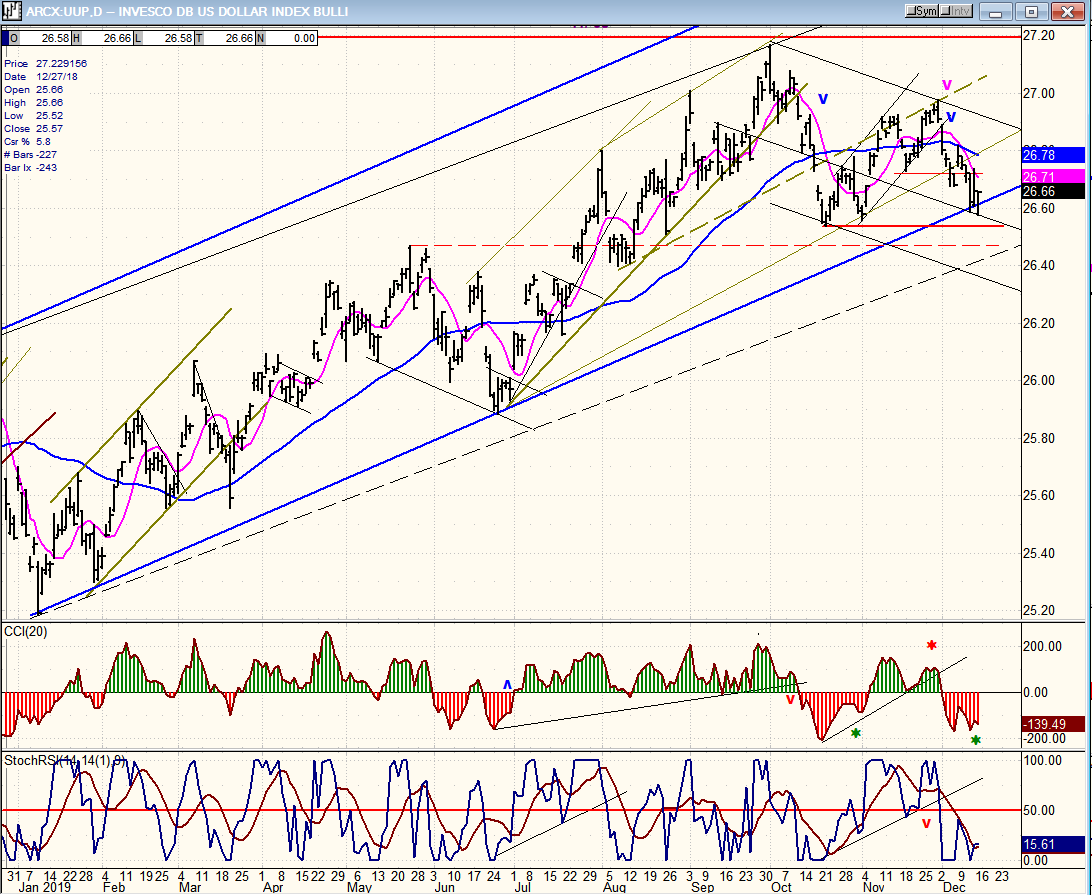
UUP (dollar ETF) daily
UUP has declined to the lower trend line of its blue channel, and this may be just about all we get for now although, for the sake of the P&F chart, I would prefer to see it touch 26.50 before reversing. This is entirely possible since the best support comes at the junction of the two dashed lines.
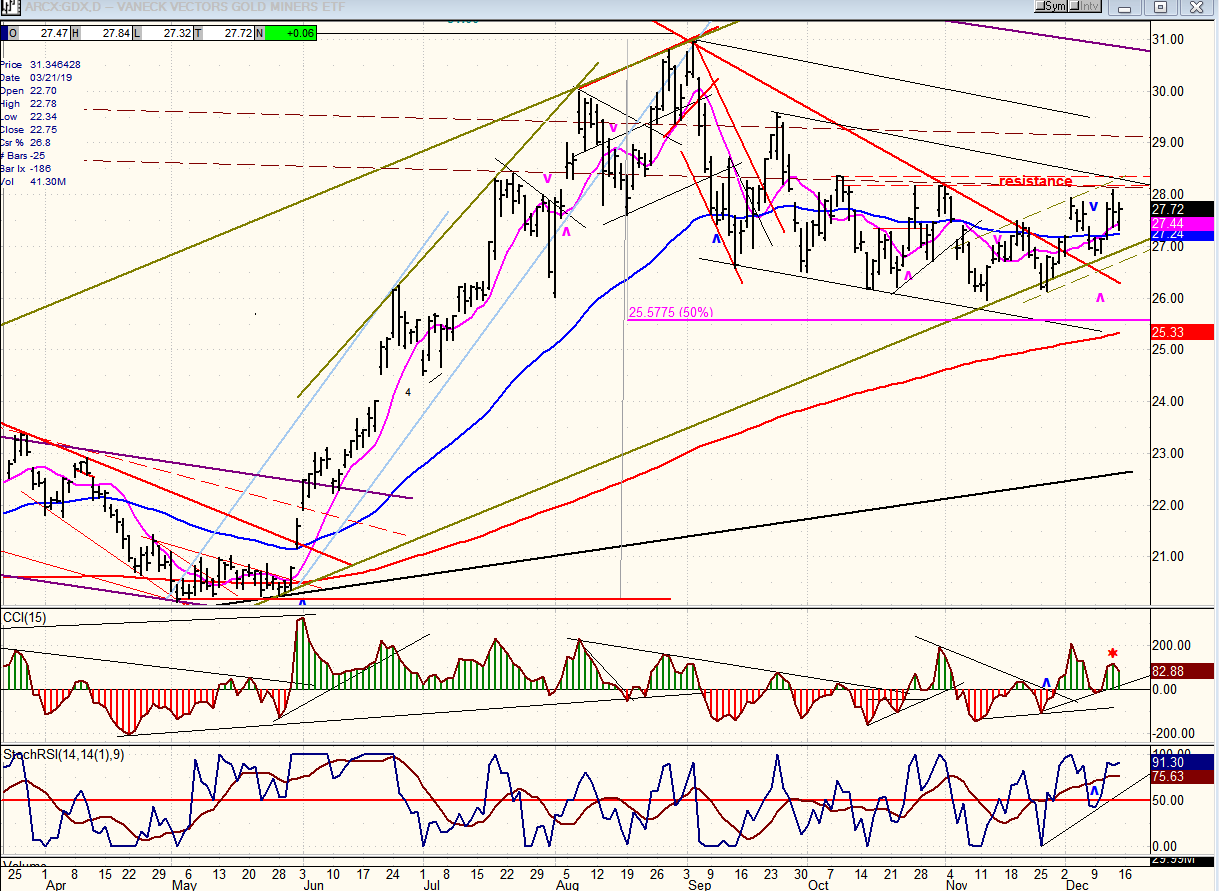
GDX (Gold miners ETF) weekly
GDX had another little spurt on the upside, but stopped short of overcoming the resistance created by former peaks. If it cannot get past that resistance before UUP completes its short-term correction, it will be pushed back, perhaps even to a new low before it ends its corrective move from the 31.00 peak. I had expected it to retrace 50% of the previous uptrend, but GDX found support a little above and bounced in a pattern which does not look very aggressive and which could easily be stopped and reversed by the resistance band where it now finds itself. Furthermore, the GDX oscillators are developing negative divergence, while UUP’s are doing the opposite. The technical picture does not look all that bullish and warrants caution.
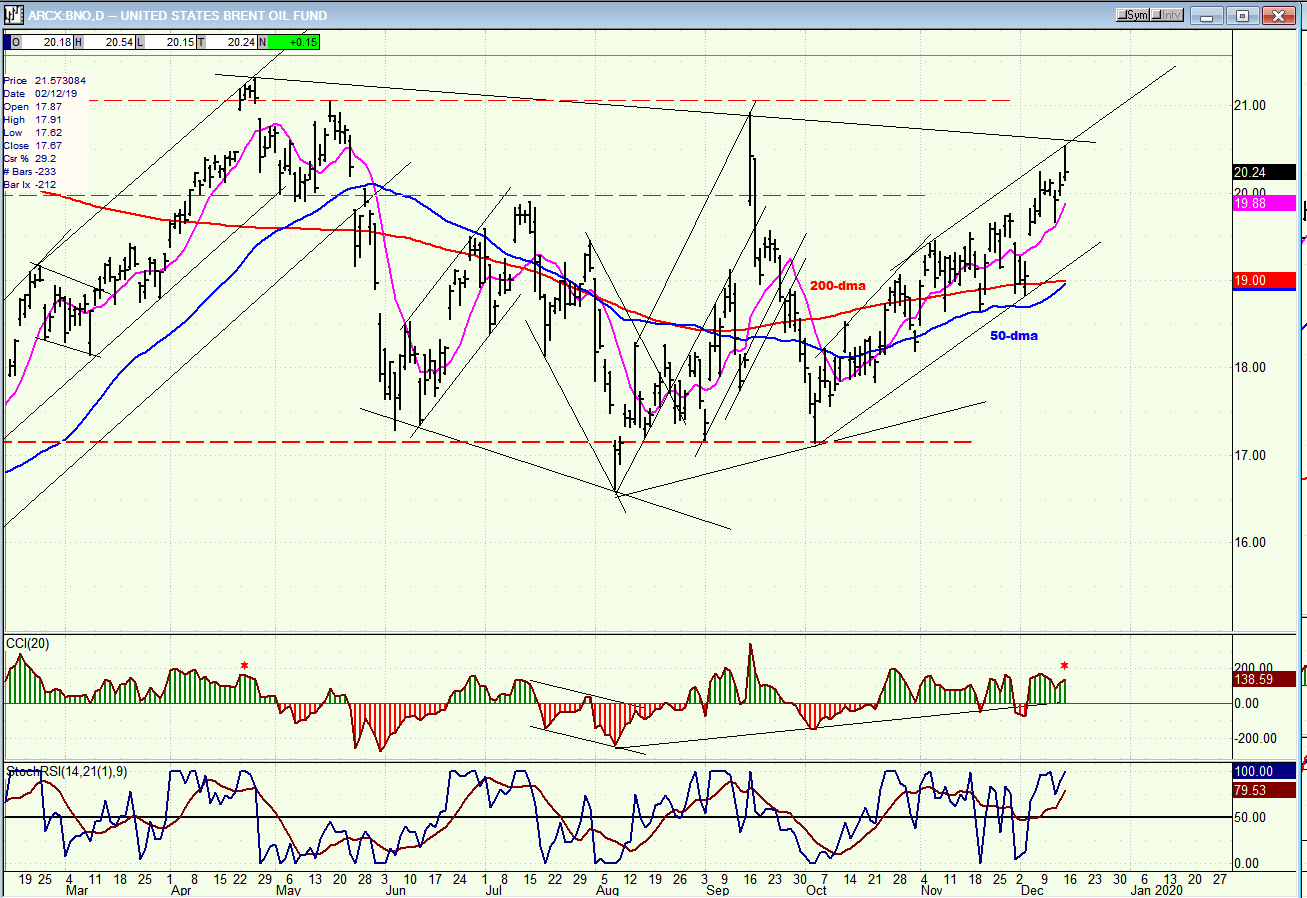
BNO (U.S. Brent oil fund) daily
BNO has reached the junction of two trend lines which should halt its advance, at least temporarily; but until it begins to trade below its lower channel line, it should remain in an uptrend.
Summary
Now that SPX has reached its 2180 projection at the same time that strong negative divergence has appeared at the hourly level, a short-term retracement of the uptrend from 2156 should be expected -- although Friday’s close has not yet brought a sell signal.
FREE TRIAL SUBSCRIPTON
With a trial subscription, you will have access to the same information that is given to paid subscribers, but for a limited time period. I think you will find that knowing how far a move can carry is one of the most useful benefits of this service, whether you are a trader or an investor -- especially when this price target is confirmed by reliable indicators which give advance warning of a market top or bottom. Furthermore, cycle analysis adds the all- important time element to the above price projections. For a FREE 4-week trial, further subscription options, payment plans, and for general information, I encourage you to visit my website at www.marketurningpoints.com.
The above comments about the financial markets are based purely on what I consider to be sound technical analysis principles. They represent my own opinion and are not meant to be construed as trading or investment advice, but are offered as an analytical point of view which might be of interest to those who follow stock market cycles and technical analysis.
********

When Andre Gratian was a stock broker years ago, a friend introduced him to technical analysis of the market. Consequently, it is not an exaggeration to say that Andre fell in love with this approach! Ever since then, it has become an increasingly important part of his professional life. Gratian has studied the works of Wyckoff, Edwards & Magee, Edward J. Dewey (cycles) and many others. However, one of my most profitable undertaking has probably been to study Point & Figure charting, which he finds invaluable in analyzing stocks and indices. If he were restricted to one methodology, this is the one that he would choose. This well-rounded background has given him what he feels to be a special insight into the stock market, facilitating the recognition of meaningful patterns and the ‘turning points’ in all trends, whether they be short or long term. Andre feels very comfortable discussing the stock market and passing on meaningful information to others. His subscribers include individuals and money managers throughout the world. Moreover, his Newsletters are currently published on several financial sites, here and abroad.


