Technical Analysis Of The Markets


Current Position of the Market
SPX: Long-term trend – There are no signs that the bull market is over.
Intermediate trend – Limited correction underway.
Analysis of the short-term trend is done on a daily basis with the help of hourly charts. It is an important adjunct to the analysis of daily and weekly charts which discusses the course of longer market trends.
Market Review
Point & Figure Overview of SPX
Long-term trend: The bull market which started in 03/09 shows no sign of having run its course. A rough count taken on the long-term Point & Figure chart gives us a potential target to as high as 4080. P&F does not predict time, only price. (no change)
Intermediate trend: A more recent re-accumulation phase on the 3X10 chart projects 3330 to end this intermediate trend. Current topping pattern suggests minimum correction to 3260. Maximum to 3090.
Important Cycles
In February, three important cycles are scheduled to make their lows: the 2-yr cycle, the 20-wk cycle, and the 80-day cycle.
Market Analysis (Charts courtesy of QChart)
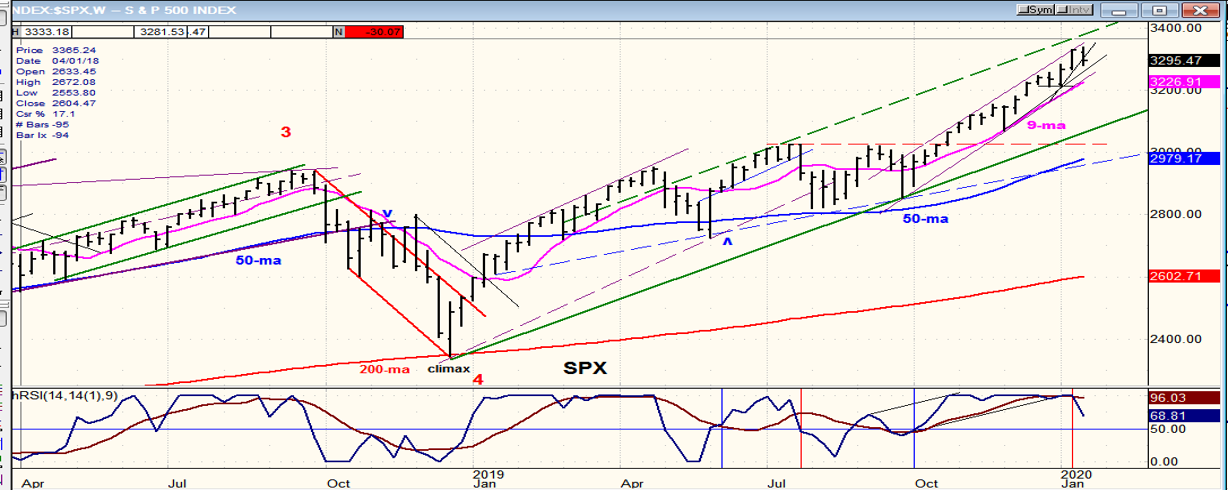
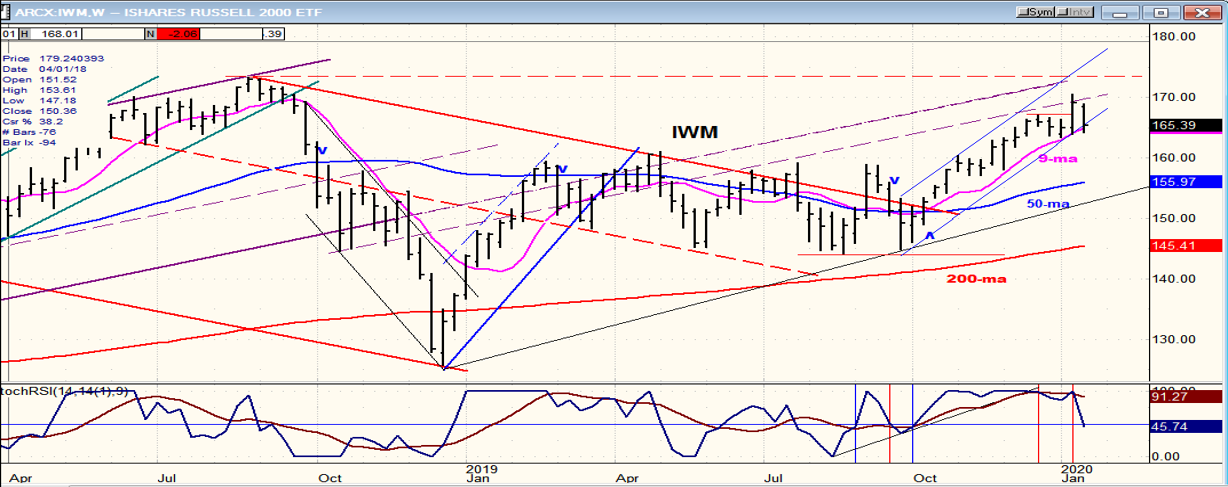
SPX-IWM weekly charts
For the first time since this uptrend started on 9/29/19, SPX is showing the potential for a significant reversal. This is due to the cycles mentioned above along with a P&F projection met at ~3330, but the main trend line is still intact.
The reaction in IWM was more aggressive, breaching its intermediate trend line.
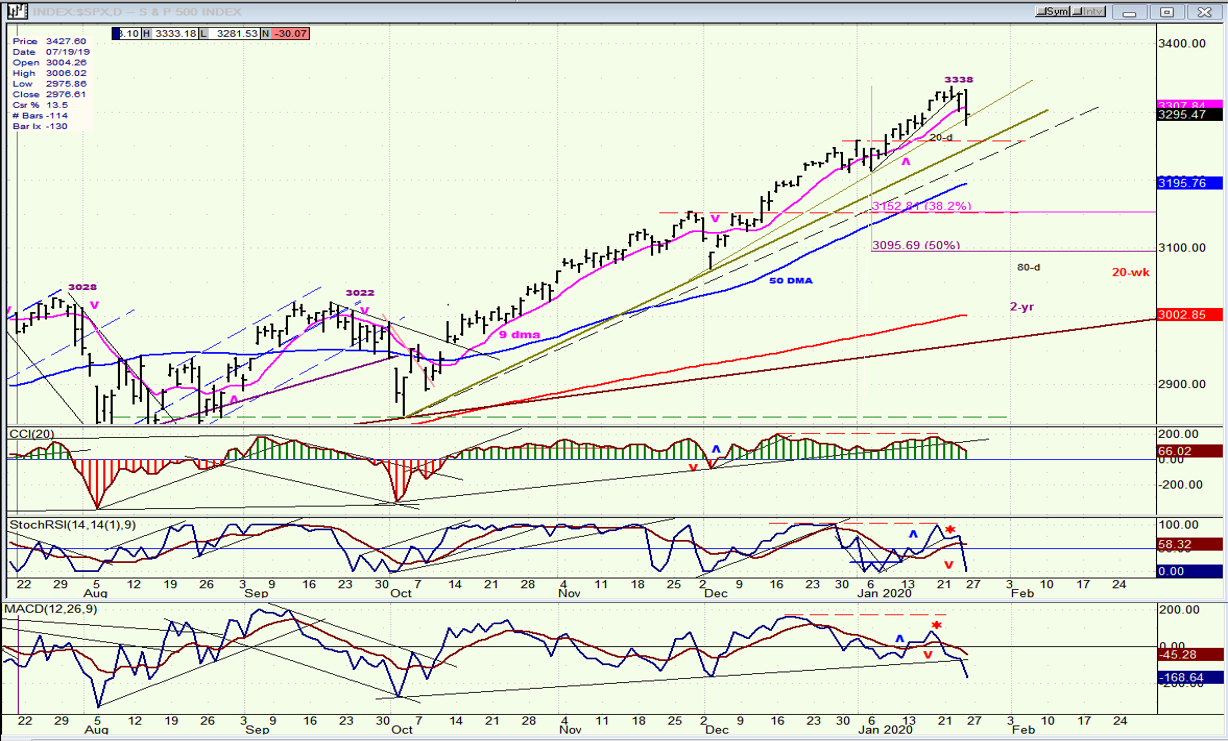
SPX daily chart
Last week, supply overcame demand and a correction started. Important cycle lows (which I marked on the chart) were approaching and it was just a matter of time before they started to influence investor psychology. This is what cycles do and, although they are mysterious universal forces which are little understood, they are readily observed in every aspect of life. In the stock market -- as elsewhere -- the length of the cycle is proportional to the anticipated effect. So, the fact that we were due for a 2-yr cycle to make its low was a warning that we could expect more than a minor pull-back. Furthermore, several cycles bottoming in close proximity -- as is presently the case -- tends to have a greater impact than if they did so individually -- at least in the stock market.
The impact of a bottoming cycle varies with each phase, so that we cannot rely on the cycle itself to inform us about the size of the correction that it will produce. This is where the Fibonacci principle -- another mysterious universal force -- is helpful. It has been observed repeatedly that corrections tend to retrace .382 to .50 the length of their previous trend. The trend we are currently correcting started at 2856 and just ended at 3338 for the SPX: nearly 500 points! These retracement points are also marked on the chart, and we’ll just have to wait until the market tells us at which level it wants to end its correction.
As I have mentioned repeatedly, Point & Figure charts are also extremely helpful in assessing how far the move will carry depending on the amount of price accumulation or distribution which has preceded the reversal of the trend. It is normal for P&F projections to match Fibonacci measurements and, in this case, the extreme projection matches the 50% retracement to about 3090. No guarantees, but something to keep in mind.
The oscillators are well on their way to confirm that a reversal has taken place. Two are in forceful declines and have gone negative, with the laggard CCI already having broken its uptrend line and close to going red.
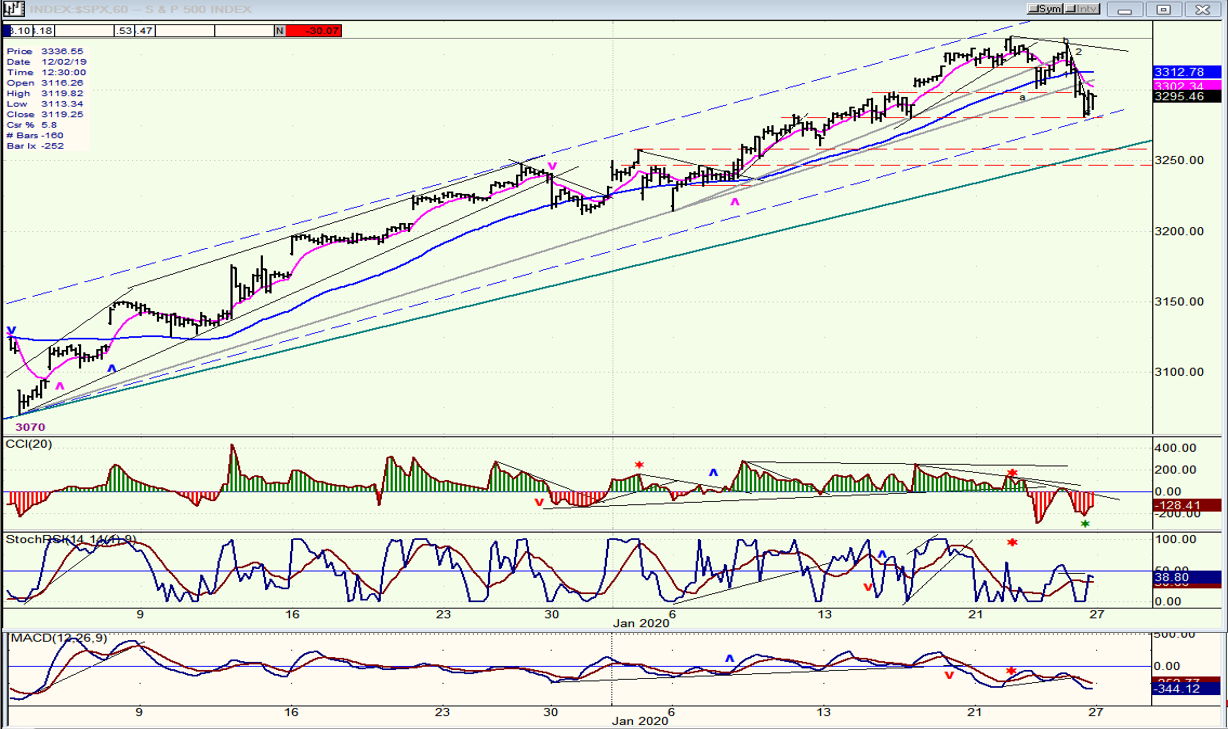
SPX hourly chart
The hourly chart clearly shows the budding correction taking form. Two minor trend lines have been broken, plus one which goes back to the 3070 low. Friday’s decline stopped on a minor channel line and at a minor support level, and is still several points away from the trend line from 2856 which should provide better support and which also corresponds to an interim projection of about 3250. There is one more cycle whose low I did not post on the daily chart which is the 12-wk cycle due on about 1/29. If it did not bottom early on Friday, that date would be a good time to look for the next low in the correction around the level mentioned above.
The hourly oscillators leave no doubt that we have started to correct with all of them having given a sell signals, and are in the red. Some minor divergence in the momentum indicators (the lowest one is the A-D oscillator) suggest that we could pause at the current low a little longer before we resume the retracement in prices.
Although this correction should be “respectable”, it should not be expected to be a major reversal in the market. By the end of February, we should be on our way to making new all time highs until the next (probably more severe) correction takes place mid-year when an even larger cycle is due to bottom.
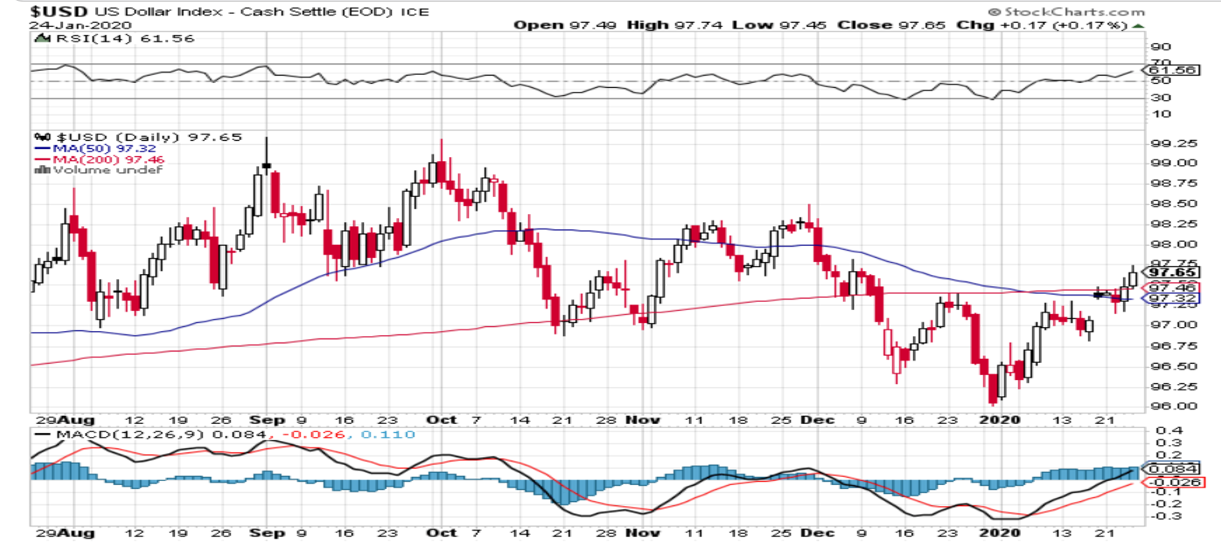
$USD daily (courtesy StockCharts)
The dollar did not find resistance at the junction of its 200-dma and 50-dma, but has gone past with no sign that it wants to stop just yet. Neither indicator is showing deceleration, although the RSI is getting close to its upper limit. Also, price has entered an overhead resistance area which should make continued upward progression more difficult.
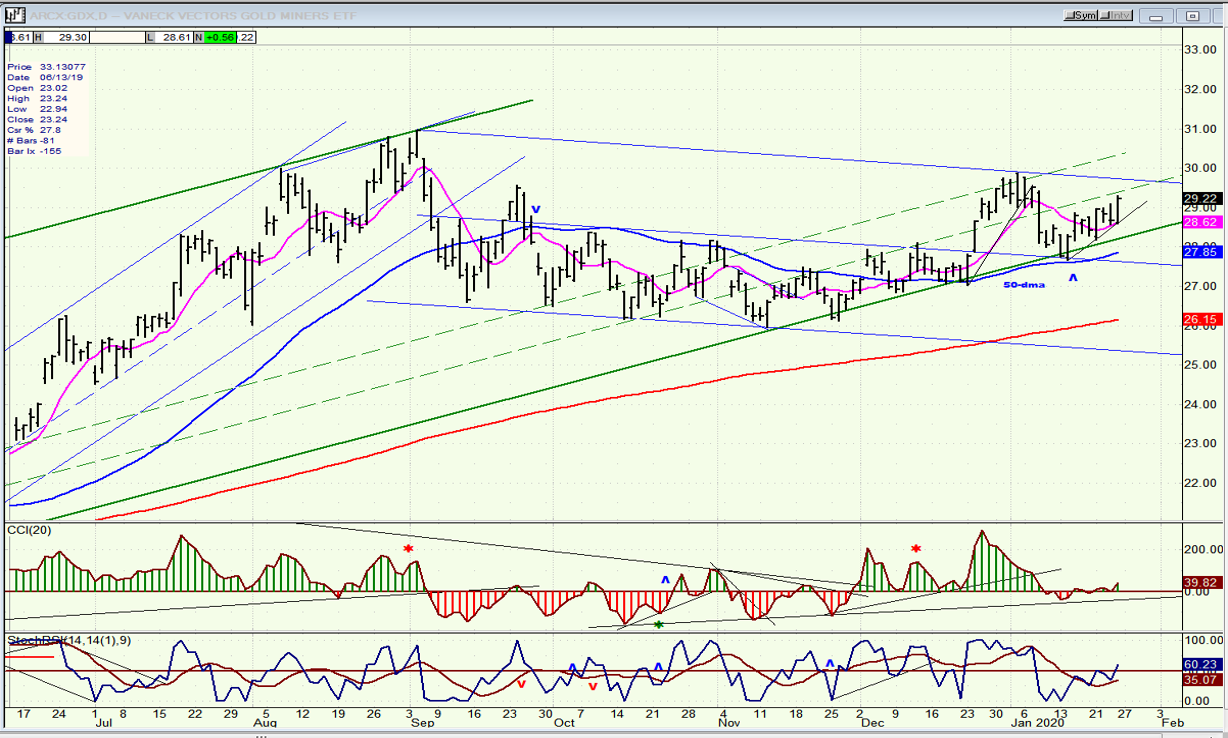
GDX (Gold miners ETF) daily
GDX is in a crawling uptrend, which is not a sign of strength but more likely is a countertrend move which will require another pull-back before it is ready to move higher.
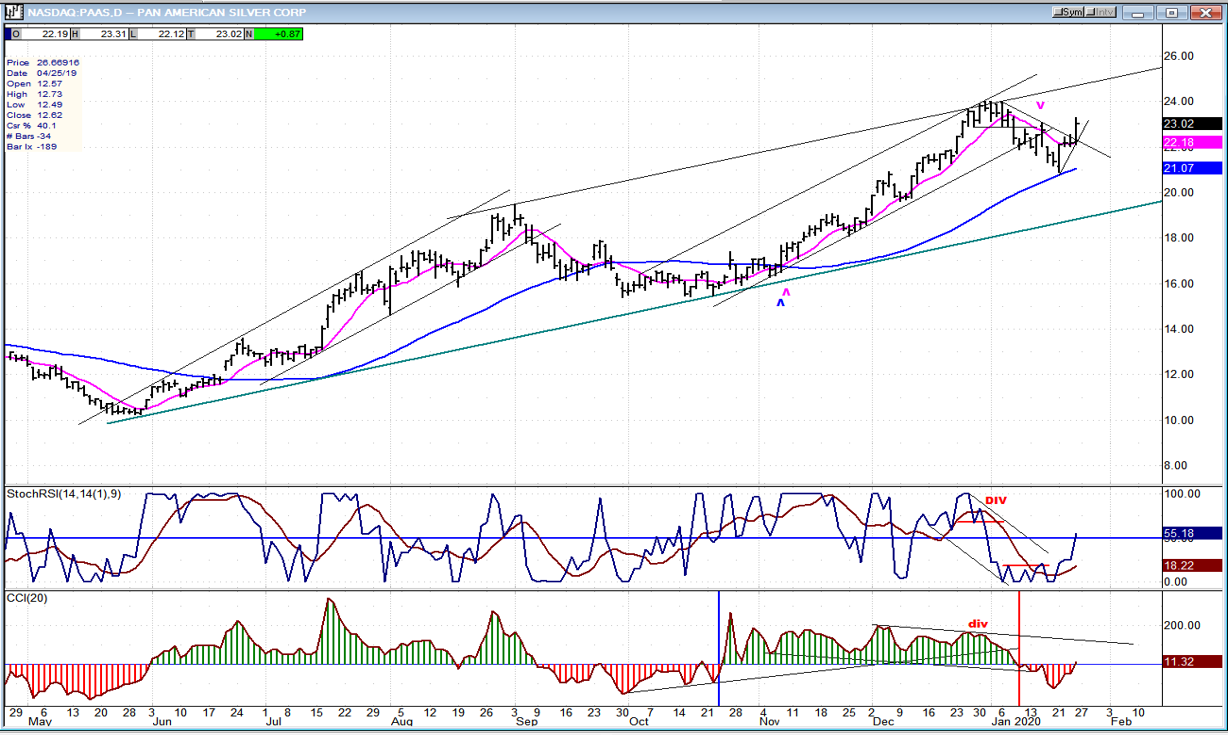
PASS (Pan American Silver Corp.) daily
PAAS had a sharp move up on Friday which is suggestive of the c-wave of an upward correction unless it continues higher right away. Both oscillators have moved to the zero line but have not issued a buy signal. Let’s see what it does over the next couple of days.
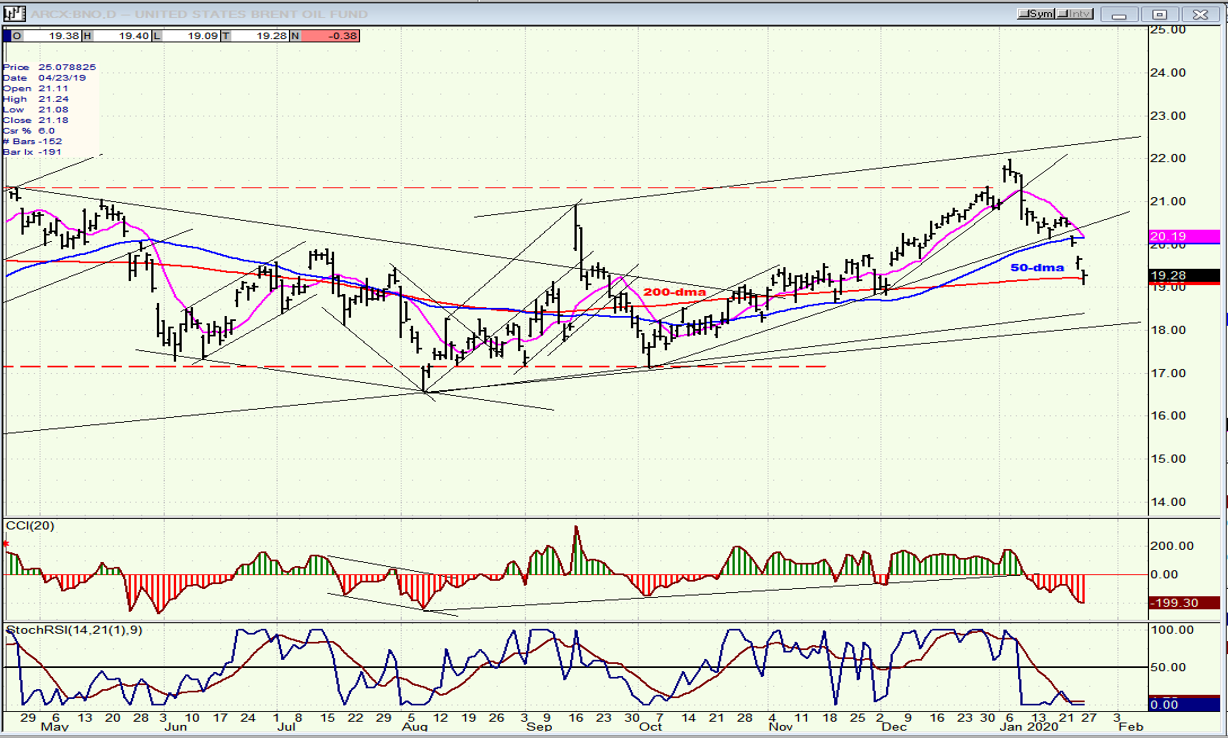
BNO (U.S. Brent oil fund) daily
I have often mentioned that BNO tends to move with the market. It was proven again on Friday as the market was correcting. It could also be said to have given the warning of an approaching market correction since it started its downtrend a few days before the market. Since the index is likely to undergo more corrective action, it is probable that BNO will follow suit.
Summary
The anticipated correction has started, and since the cycles which are its cause are not due to bottom for another week or two, it is logical to expect lower prices before a reversal takes place. Potential projections are given on the daily SPX chart.
FREE TRIAL SUBSCRIPTON
With a trial subscription, you will have access to the same information that is given to paid subscribers, but for a limited time period. I think you will find that knowing how far a move can carry is one of the most useful benefits of this service, whether you are a trader or an investor -- especially when this price target is confirmed by reliable indicators which give advance warning of a market top or bottom. Furthermore, cycle analysis adds the all- important time element to the above price projections. For a FREE 4-week trial, further subscription options, payment plans, and for general information, I encourage you to visit my website at www.marketurningpoints.com.
The above comments about the financial markets are based purely on what I consider to be sound technical analysis principles. They represent my own opinion and are not meant to be construed as trading or investment advice, but are offered as an analytical point of view which might be of interest to those who follow stock market cycles and technical analysis.
*******

When Andre Gratian was a stock broker years ago, a friend introduced him to technical analysis of the market. Consequently, it is not an exaggeration to say that Andre fell in love with this approach! Ever since then, it has become an increasingly important part of his professional life. Gratian has studied the works of Wyckoff, Edwards & Magee, Edward J. Dewey (cycles) and many others. However, one of my most profitable undertaking has probably been to study Point & Figure charting, which he finds invaluable in analyzing stocks and indices. If he were restricted to one methodology, this is the one that he would choose. This well-rounded background has given him what he feels to be a special insight into the stock market, facilitating the recognition of meaningful patterns and the ‘turning points’ in all trends, whether they be short or long term. Andre feels very comfortable discussing the stock market and passing on meaningful information to others. His subscribers include individuals and money managers throughout the world. Moreover, his Newsletters are currently published on several financial sites, here and abroad.


