Technical Analysis Of The Markets


Current Position of the Market
SPX Long-term trend: An “official” bear market has now been declared.
SPX Intermediate trend: First phase of correction appears to be over
Analysis of the short-term trend is done on a daily-basis with the help of hourly charts. It is an important adjunct to the analysis of daily and weekly charts which discuss longer market trends.
Has a Countertrend Rally Started?
Point & Figure overview of SPX
Long term trend: Although I do have a potential lower target, I do not want to disclose it at this time.
Intermediate trend: Maximum 2360 projection was filled on Friday in the futures (2380). Initial countertrend to 2800.
Important (known) cycles
I follow only a few reliable cycles in my analysis. This is complemented by the analysis of Erik Hadik (www.insiidetrack.com).
The 80-d cycle is due on 4/7-6/8; 40-wk 7/14; 9-yr ~7/14.
Market Analysis (Charts courtesy of QCharts)
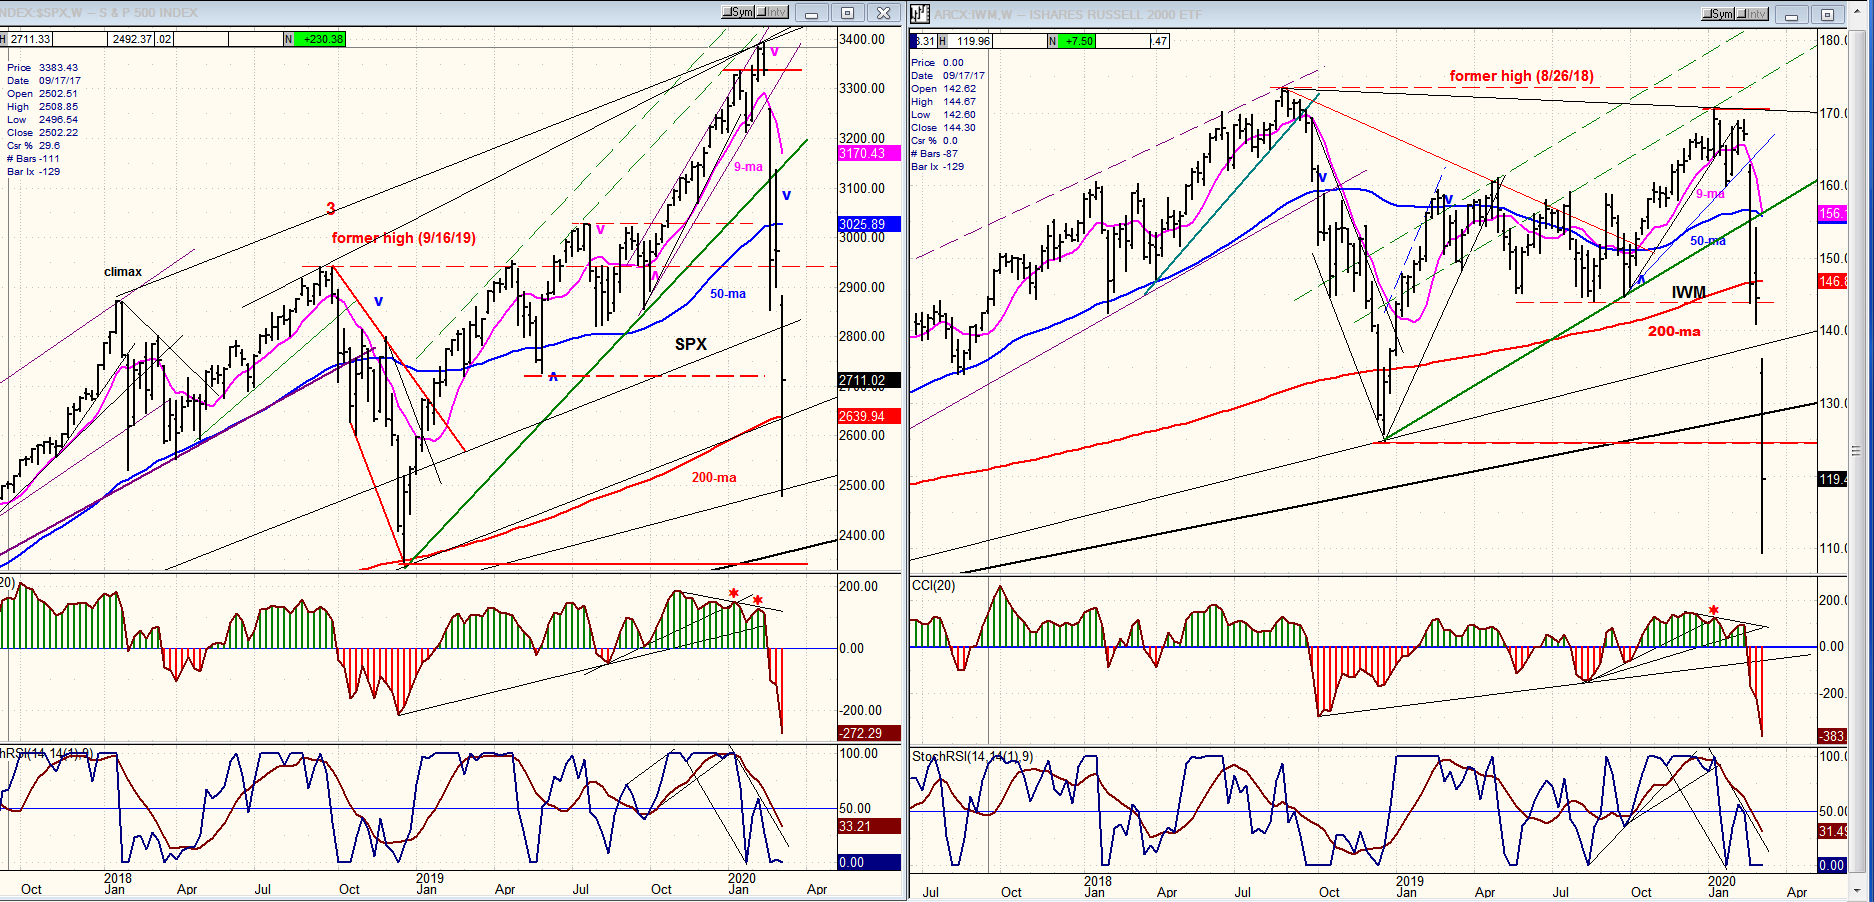
SPX- IWM weekly charts:
After a brutal 4-week decline during which it lost almost a thousand points, SPX finally found support and had a strong countertrend rally of 232 points which happened all in one day. Now that’s volatility! The decline ended about 130 points above it’s December 2019 low. By contrast, IWM continued 35% below Dec. ’19 before reversing. The rallies in both indexes are considered to be only bear market rallies for now.
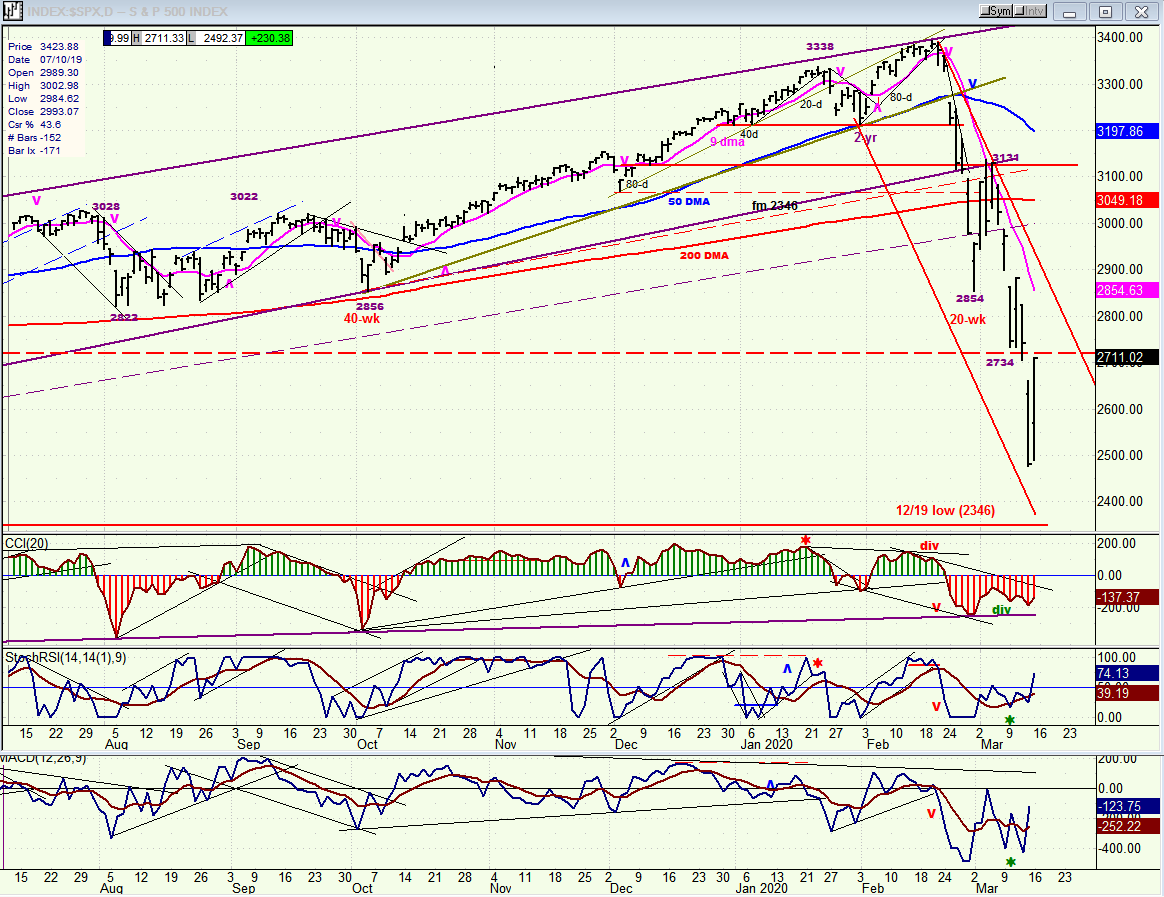
SPX daily chart
3/8/20…a P&F count taken at the 3010 level suggests that the next decline could send the index several hundred points lower.
When this was written last week, SPX had closed at 2972. Although I had expected the decline to continue, I had no idea that it would be that fast. The amount of selling which we have witnessed since 2393 in this time frame strongly suggest that we have started a bear market for which there was no warning, otherwise known as a “black swan”. We had an overbought market for sure, but these conditions are usually resolved by a correction proportional to the prevailing trend. However, the catalyst behind this wholesale dumping is not of the garden variety. It is capable of instantly sending the world’s economy in a recession.
Since economic statistics are lagging indicators, we have no idea the extent of the damage the coronavirus will cause. There is no precedent to gauge its impact. When is the last time that entire cities, and even countries have been quarantined? Can we estimate the amount of economic damage this will cause? The answer is clearly, No! And the smart money does not know either. This is why you saw massive selling taking place over he past month. What we can say is that the longer the crisis lasts, the worse it will be; so let’s hope that the virus is quickly contained, in this country and throughout the rest of the world.
Technically, on Friday the index reached an interim projection target with good positive divergence at the daily level, and traders jumped in with both feet, causing a rally proportional to the recent decline. Since there is not a large enough valid base to carry it beyond 2800, we will either have to create a re-accumulation pattern from which to launch the next one, or create another phase of distribution before resuming the decline. Applying Fibonacci retracement potentials: after we reach the 2800 target we will have almost retraced nearly .382 of the decline (2828). That may be good enough for the traders and the algos. We’ll see!
From a cyclical standpoint, I have previously referred to July 15 as the low of the next 40-wk cycle jointly with the 9-year cycle. That may be a good time to look for something more than a bear market rally. To be realistic, that is still 4 months away! Is it equally realistic to think that we will hold this level for another 4 months?
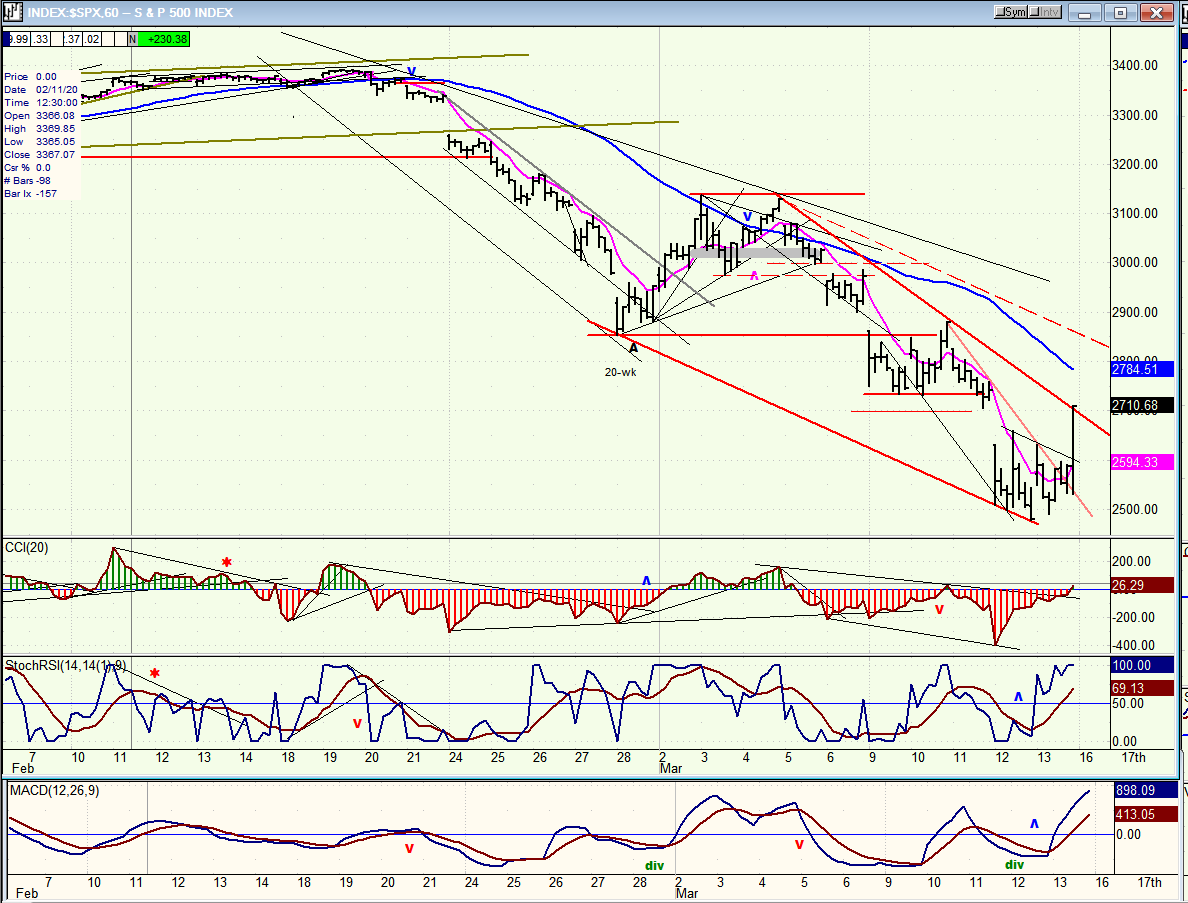
SPX hourly chart
In conjunction with divergence at the daily level, there was also good positive divergence in the hourly indicators which reinforced the belief that we had finally reached a good projection from which to start a countertrend rally. Note, however, that in spite of the strong rebound, the hourly CCI just barely turned positive on Friday. But the positive warning had also been provided by the other two oscillators which always lead and were already positive. As the rally extends to 2800 the CCI will also have time to become positive and then display negative divergence before the next reversal.
The rally did not start in earnest until the index came decisively out of the steepest downtrend line -- which was tested a couple of times before it finally gave way. This is when traders piled in and sent it directly to the next trend line from which it could briefly pull back (following the example of the futures which pulled back 60 points right after the close). I suspect a little pull-back in cash is also warranted before it reaches its first projection; then a larger correction should take place before trying for 2800.
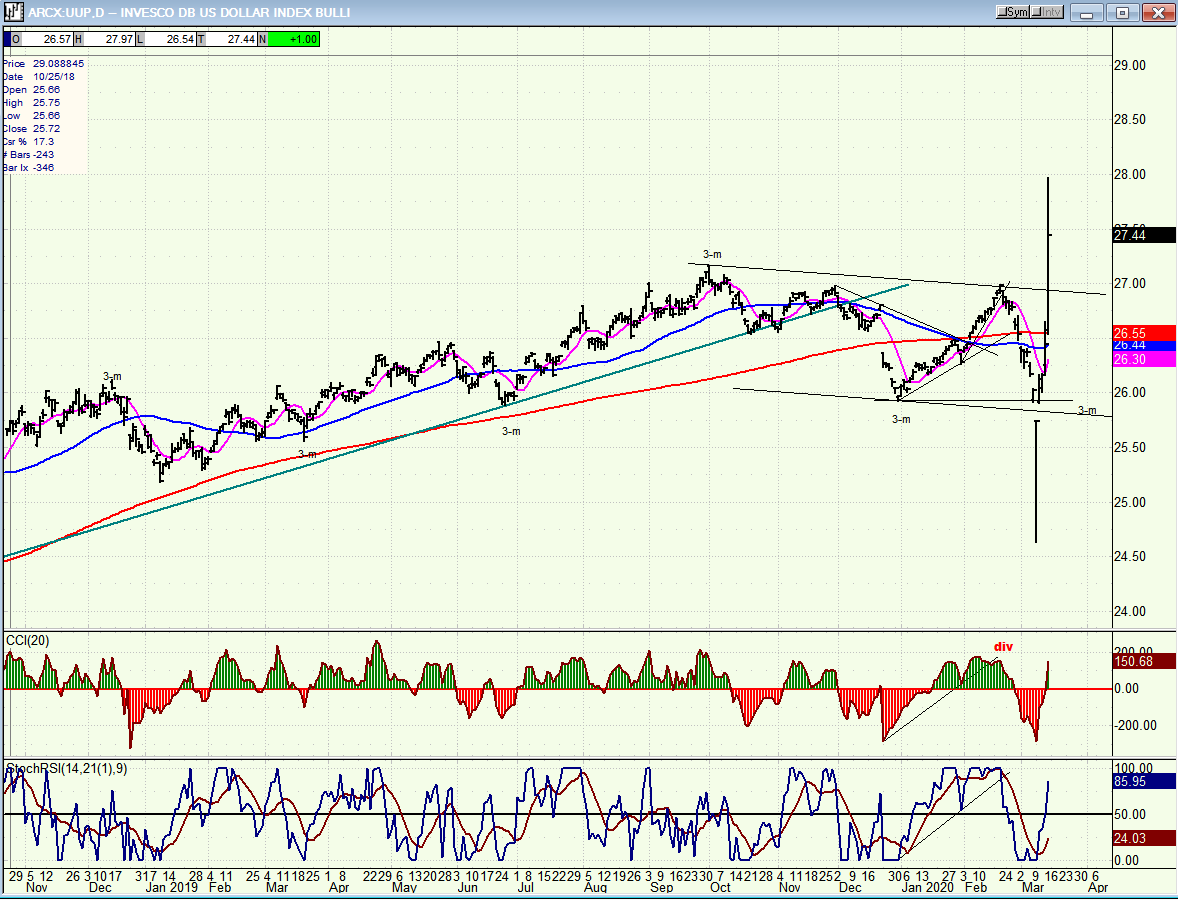
UUP (dollar ETF)
UUP reflects the action of the dollar which has been very volatile due to the actions that the Fed has taken to counteract the sharp drop in the stock market. We can’t derive too much clarity from this chart, but the dollar had a sharp rally from 96 to 99 on its P&F chart, which is huge for this static index. It should make a final high around 101.
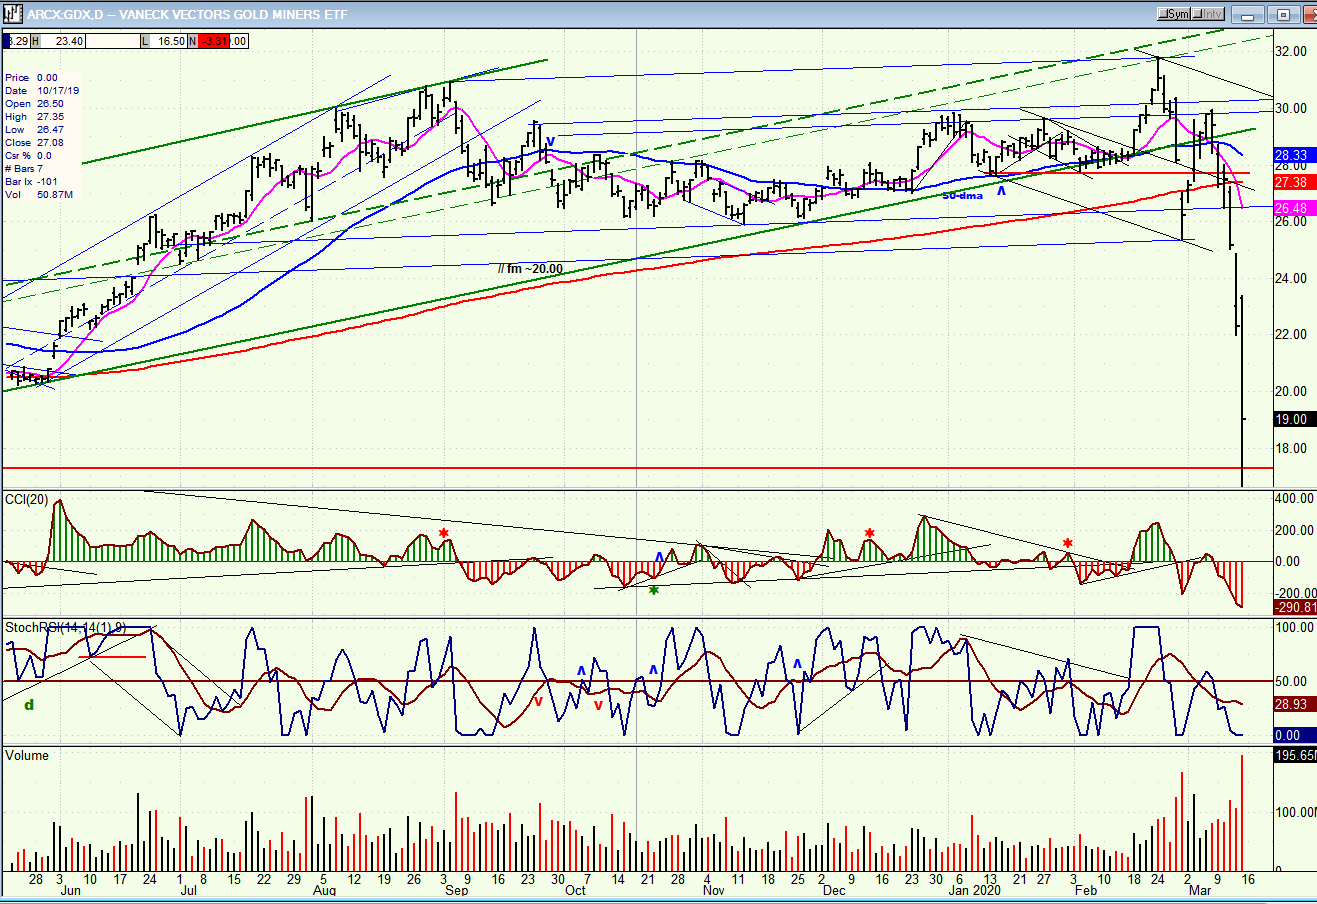
GDX (gold miners)
GDX fully reflects the action of the Fed which sent the dollar soaring and this index plummeting down below its September 2018 low of 17.28. The good news is that, even though it may retest its low, it will all be uphill after that; but it may also be a while before it makes a new high
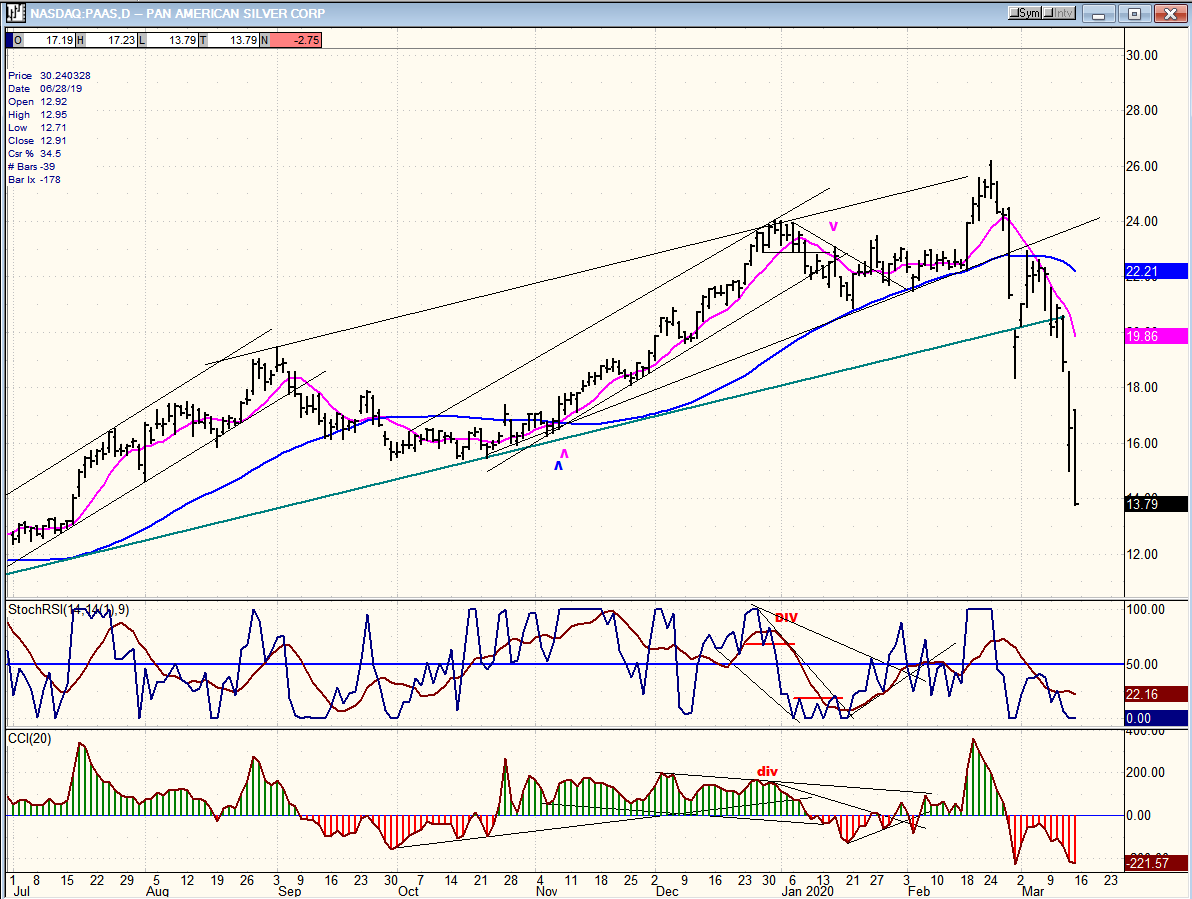
PAAS (Pan American Silver Corp)
PAAS also was decimated by the Fed’s move, but it could see 13, and perhaps 11 before it has finished correcting.
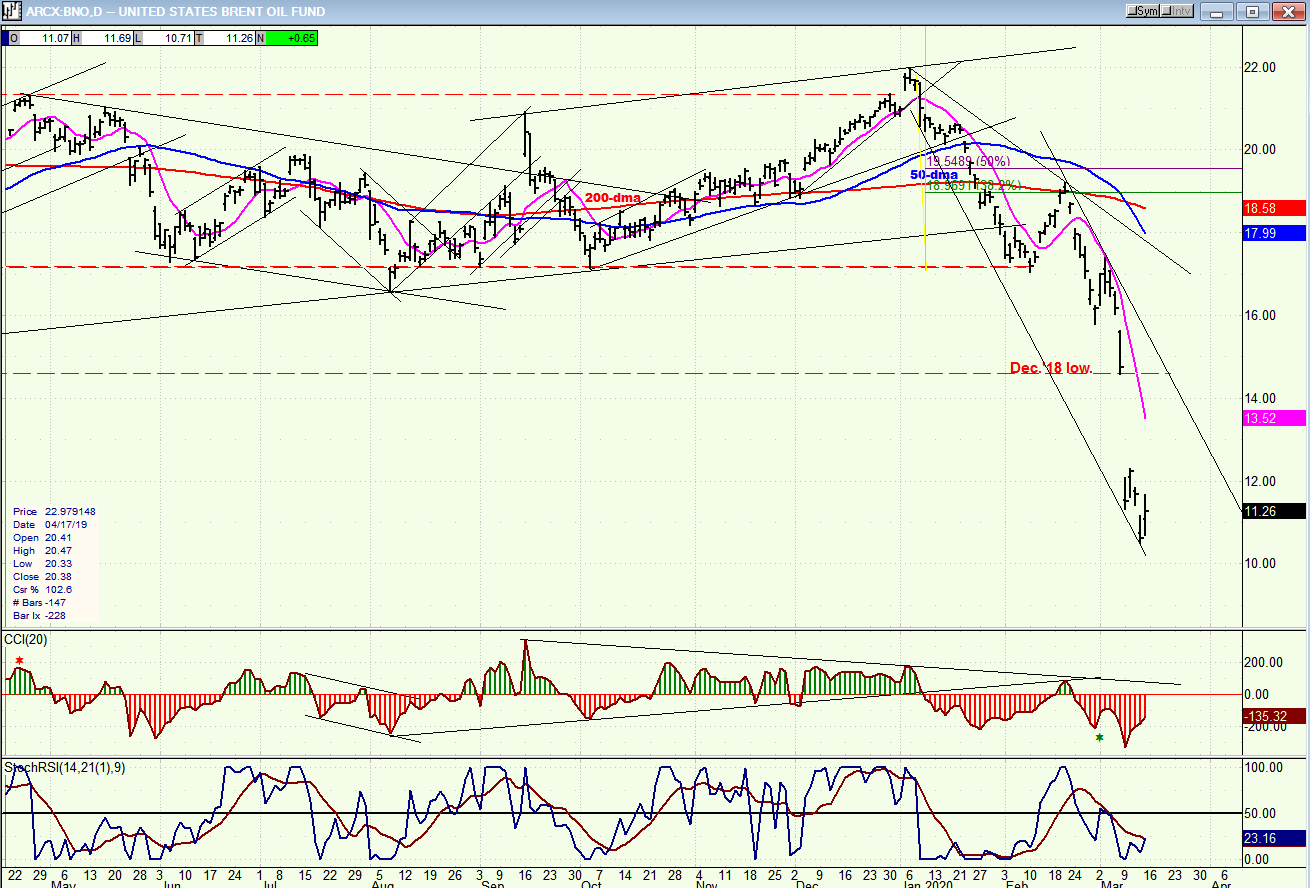
BNO (U.S. Brent Oil fund)
BNO could be ready for a little consolidation, but it will have to go to 9 before starting to build a base.
Summary
“SPX looks as if it is in the process of completing a pattern of secondary distribution. If so, it could be followed by another significant decline.”
After a decline of 923 points in four weeks – mostly in 3 weeks -- SPX shot straight up 230 points in one day. This market is not for the faint-hearted! After some volatile hesitation it is expected to continue its progress to 2800.
Free trial subscription
With a trial subscription, you will have access to the same information that is given to paid subscribers, but for a limited time period. Over the years, I have developed an expertise in P&F charting (price projection), cycles (timing), EWT (structure), and general technical analysis which enables me to warn subscribers of pending reversals in market trends and how far that trend can potentially carry. For a FREE 4-week trial, subscription options and payment plans, I encourage you to visit my website at www.marketurningpoints.com.
The above comments and those made in the daily updates and the Market Summary about the financial markets are based purely on what I consider to be sound technical analysis principles. They represent my own opinion and are not meant to be construed as trading or investment advice, but are offered as an analytical point of view which might be of interest to those who follow stock market cycles and technical analysis.
********

When Andre Gratian was a stock broker years ago, a friend introduced him to technical analysis of the market. Consequently, it is not an exaggeration to say that Andre fell in love with this approach! Ever since then, it has become an increasingly important part of his professional life. Gratian has studied the works of Wyckoff, Edwards & Magee, Edward J. Dewey (cycles) and many others. However, one of my most profitable undertaking has probably been to study Point & Figure charting, which he finds invaluable in analyzing stocks and indices. If he were restricted to one methodology, this is the one that he would choose. This well-rounded background has given him what he feels to be a special insight into the stock market, facilitating the recognition of meaningful patterns and the ‘turning points’ in all trends, whether they be short or long term. Andre feels very comfortable discussing the stock market and passing on meaningful information to others. His subscribers include individuals and money managers throughout the world. Moreover, his Newsletters are currently published on several financial sites, here and abroad.
More from Gold-Eagle


