Technical Analysis Of The Markets


Current Position of the Market
SPX Long-term trend: An “official” bear market has now been declared.
SPX Intermediate trend: Intermediate low mid-year.
Analysis of the short-term trend is done on a daily-basis with the help of hourly charts. It is an important adjunct to the analysis of daily and weekly charts which discuss longer market trends.
Next Cycle Low ~4/7
Point & Figure overview of SPX
Long term trend: Although I do have a potential lower target in mind, I will wait for some confirmation before disclosing it.
Intermediate trend: Maximum 2170 this phase. Larger drop into mid-year after relief rallies.
Important cycles followed
I follow only a few cycles that I consider reliable in my analysis. This is complemented by the analysis of Erik Hadik (www.insiidetrack.com).
The 80-d cycle is due on 4/8-6/8; 40-wk 7/14; 4.5-yr or 9-yr ~7/14.
Market Analysis (Charts courtesy of QCharts)
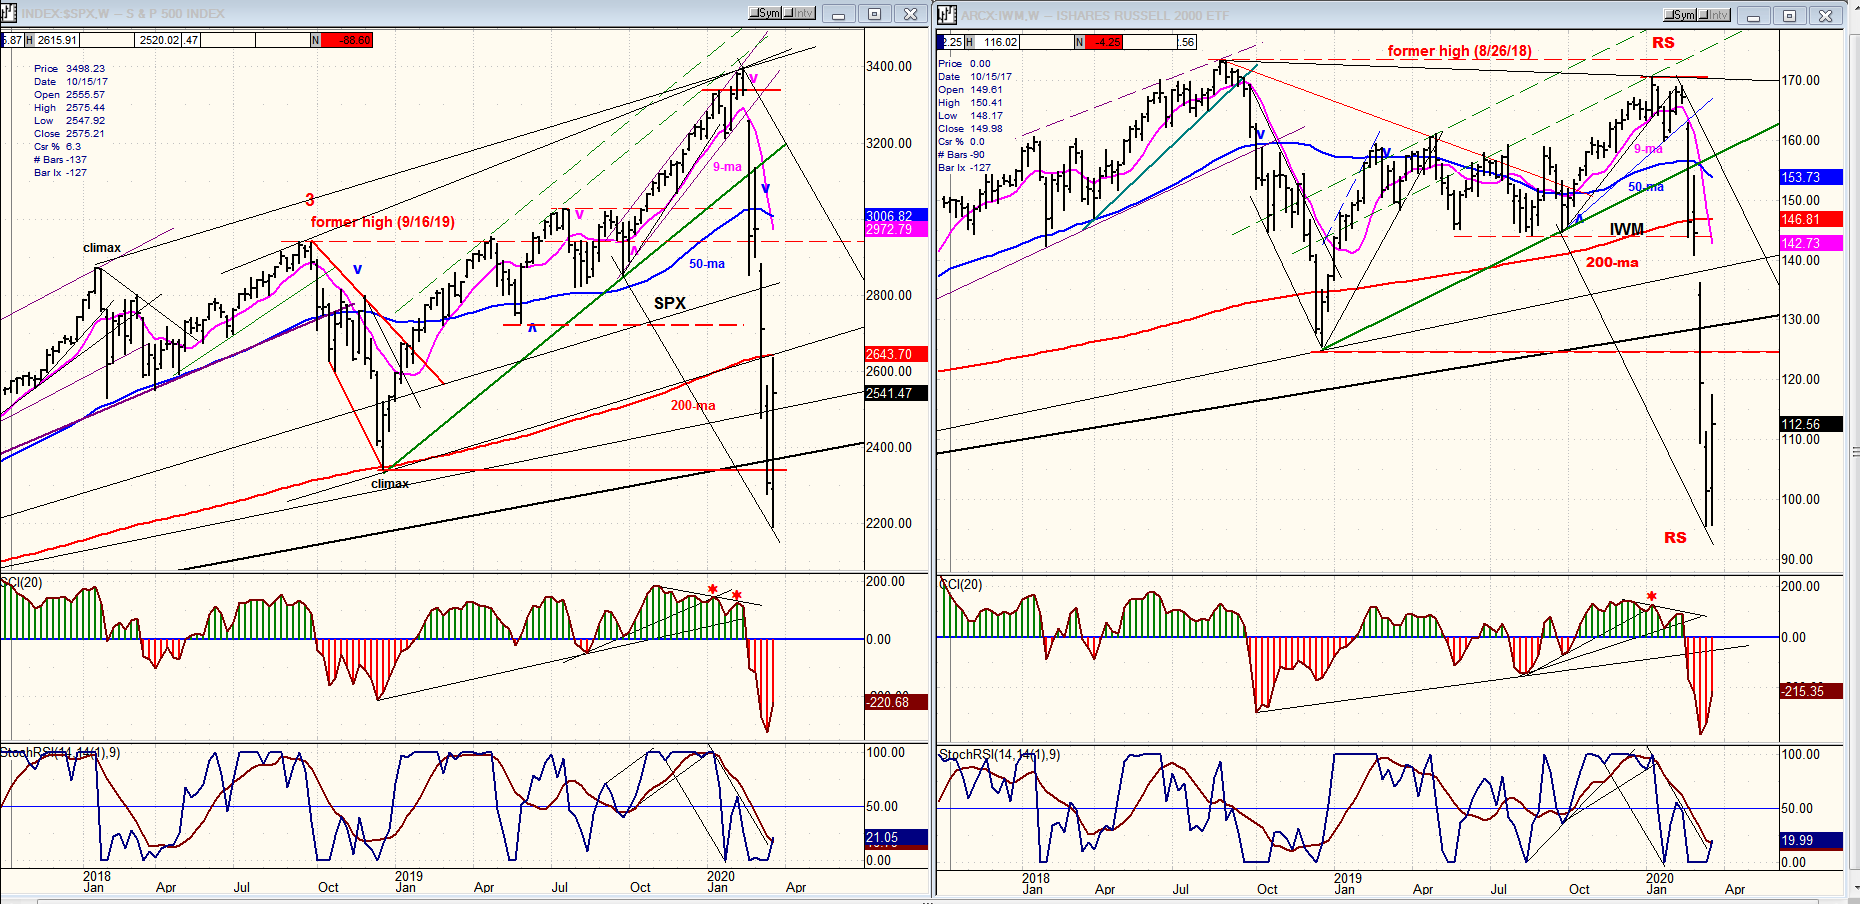
SPX- IWM weekly charts:
The first countertrend rally took SPX to its 200-DMA where it was repelled. IWM did not fare nearly as well and remains with considerable relative weakness to the SPX. There may be some additional trading within the range established this week, with the next short-term low due ~4/8. An intermediate low is not due until mid-year.
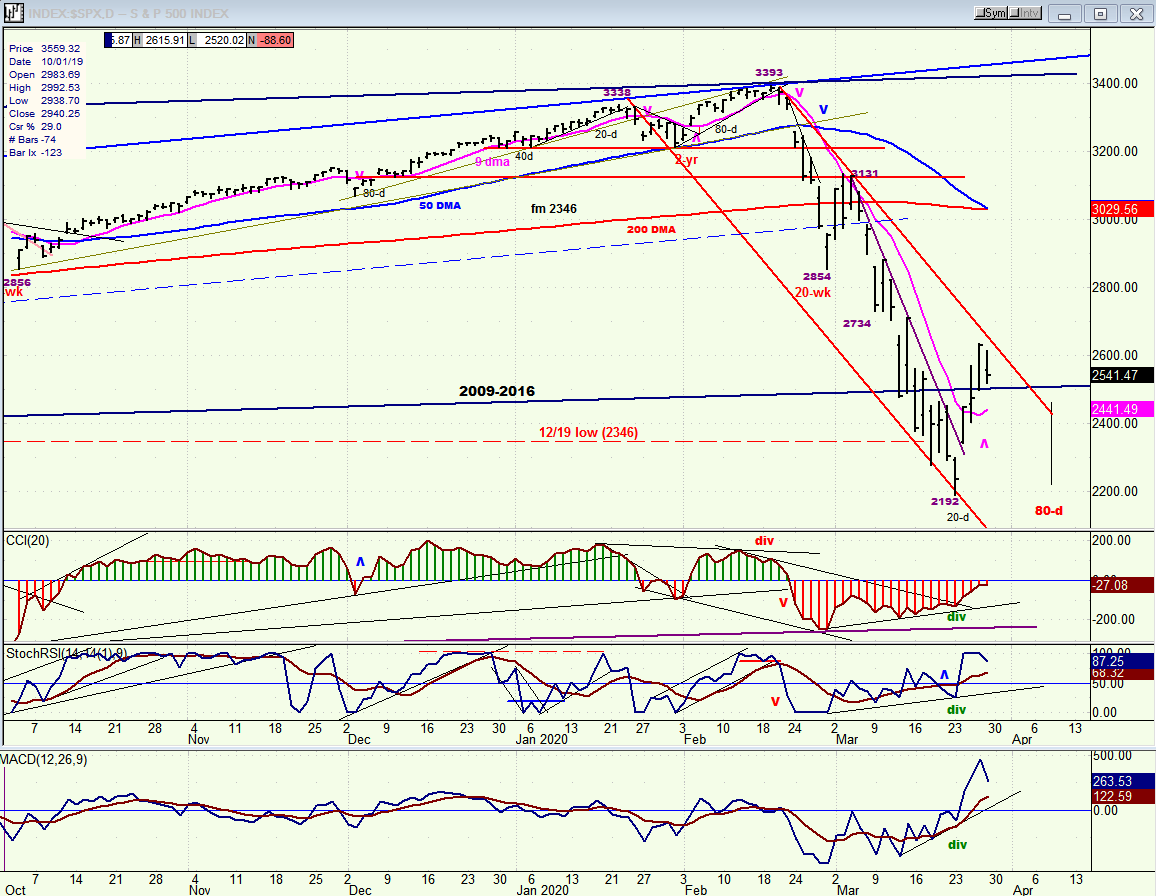
SPX daily chart
Last Monday SPX made a low at 2192 (which was about 200 points below its trend line from the 3/’09 low) and by Thursday had retraced the entired width of its current bearish channel, or 445 points to 2637 before pulling back to 2520 by Friday’s close. The low coincided precisely with a 20-day (hurst) cycle which provided a price lift exarcebated by a deeply oversold market and the passage of a 2 trillion dollar relief bill.
Extreme volatility continues to dominate trading activity, which causes the 10X P&F chart to look like a 1X chart, creating counts ten times what they would normally be. We’ll need confirmation that a short-term top has already been established so that we can gauge whether or not a new low will be made when the 80-day cycle (also known as the 45-td cycle) bottoms around 4/8. If we do not make a new low, and perhaps even if we do, we could/should make a new recovery high before the next 80-day cycle low which is on ~6/8. Between the two 80-day cycles, there will be shorter (20-day) cycles making their lows.
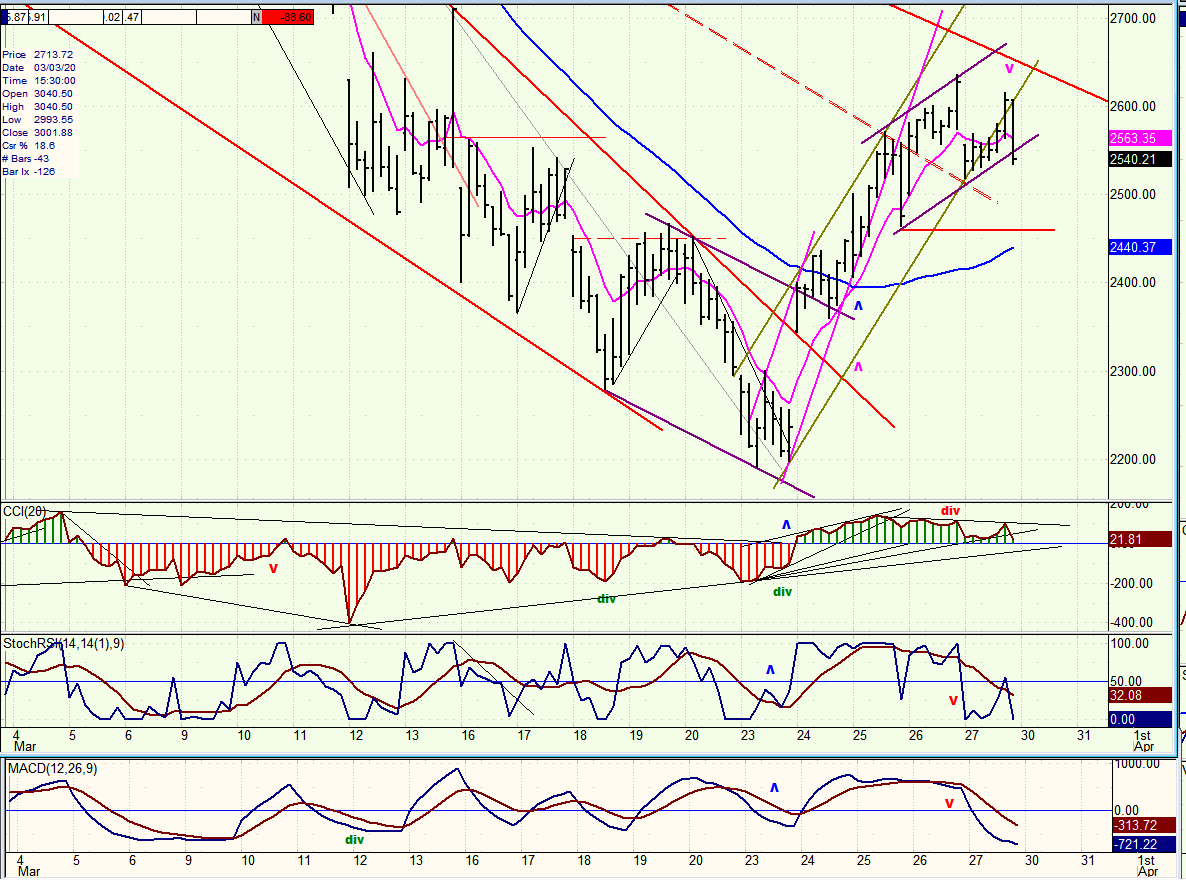
SPX hourly chart
You will note that in spite of the divergence which showed at the top of the rally, and the significant two-phase retracement which has occurred since, the CCI still has not given a confirmed sell signal which requires that it goes negative. With the downside momentum established at the last moment on Friday, odds favor a continuation of the short-term downtrend on Monday to the next support level at the red horizontal line. If we do not get a sell signal, it could mean that the rally is not over. A good count only projected to 2500 from the base, and we had to dip into unreliable weak count for the rest of the rally which, by those standards, projected to about 2663, in concurrence with the 50% retracement level. So, unless we get a confirmed sell signal, that level could still be attained before we get a short-term top.
The hourly chart displayed here focuses on the late stages of the decline and last week’s rally. It’s not easy to conceptualize that this rally represents almost 500 SPX points, and I do not expect current volatility to subside. Friday’s last half hour decline into the close consisted of nearly 70 points! We might as well get used to this “new normal”. It’s likely to be with us for a while.
We should expect at least a 50% retracement of the rally into the next cycle low, to just above 2400. I will come up with something more specific after the topping process has been completed.
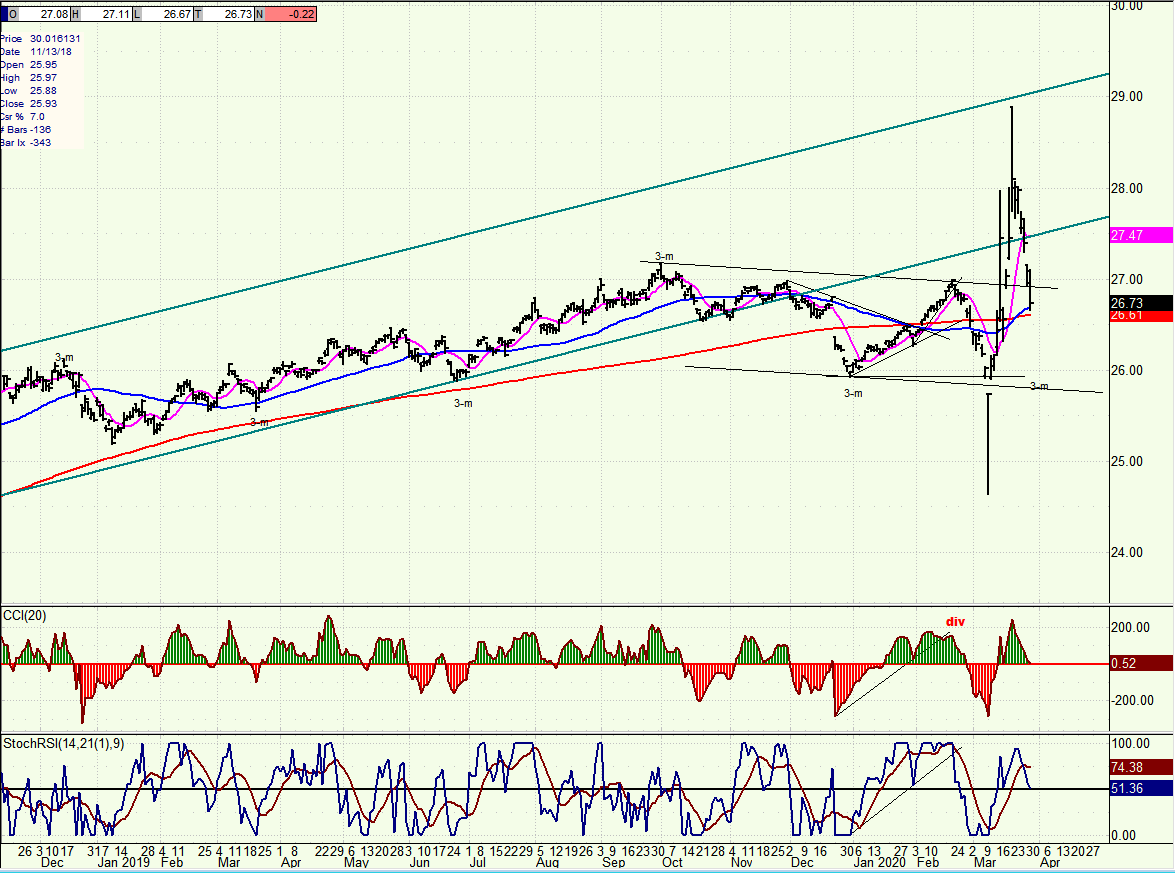
UUP (dollar ETF)
UUP has been very volatile as well, because of the recent actions undertaken by the Fed. The dollar P&F chart shows that it has most likely reached its projection high at 102 and that the retracement to 99 is probably the beginning of a corrective decline which could eventually be significant.
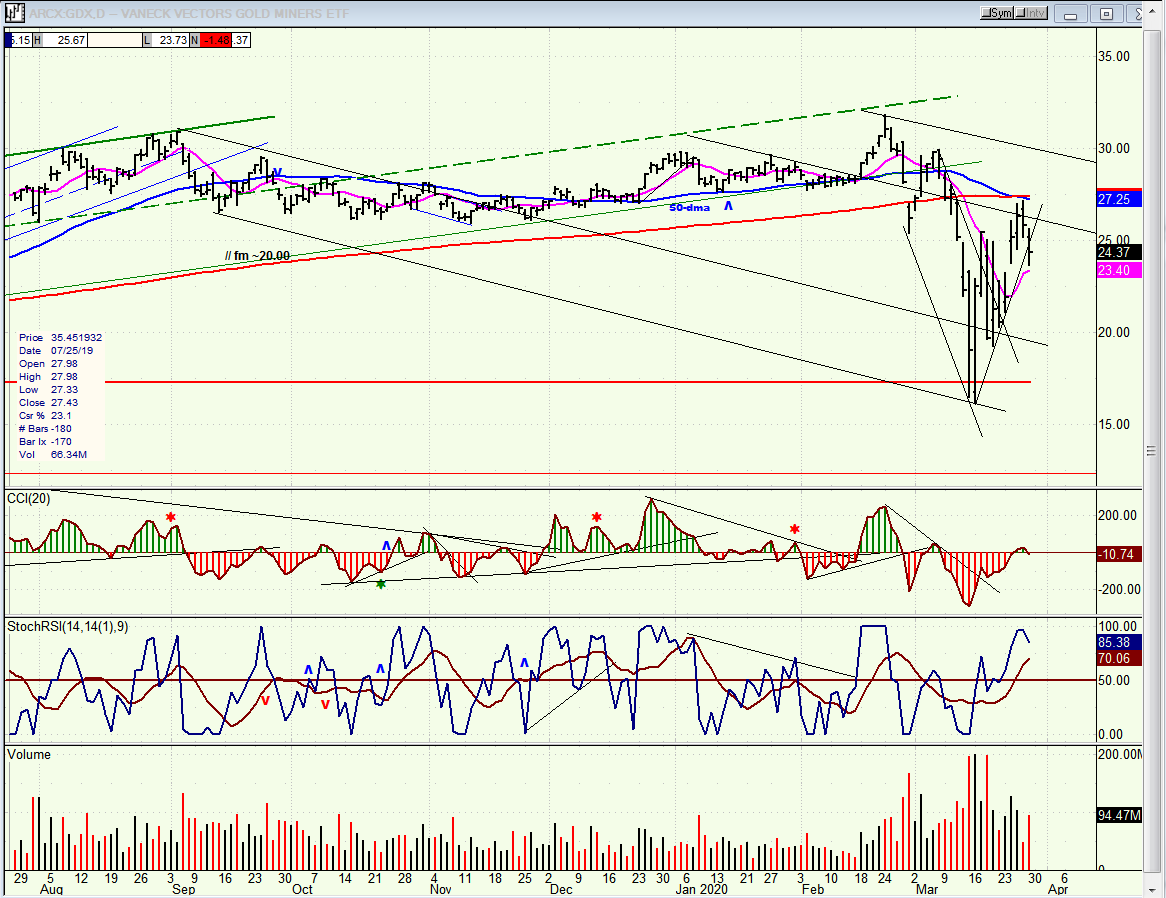
GDX (gold miners)
GDX was not left behind in the volatility contest. It was cut in half from its late February high of 32 down to 16, but had recovered to 27 by last Thursday, closing the week at 24.37. It has already built a base on the P&F chart which should allow it to approximately double in price after it has finished its current correction.
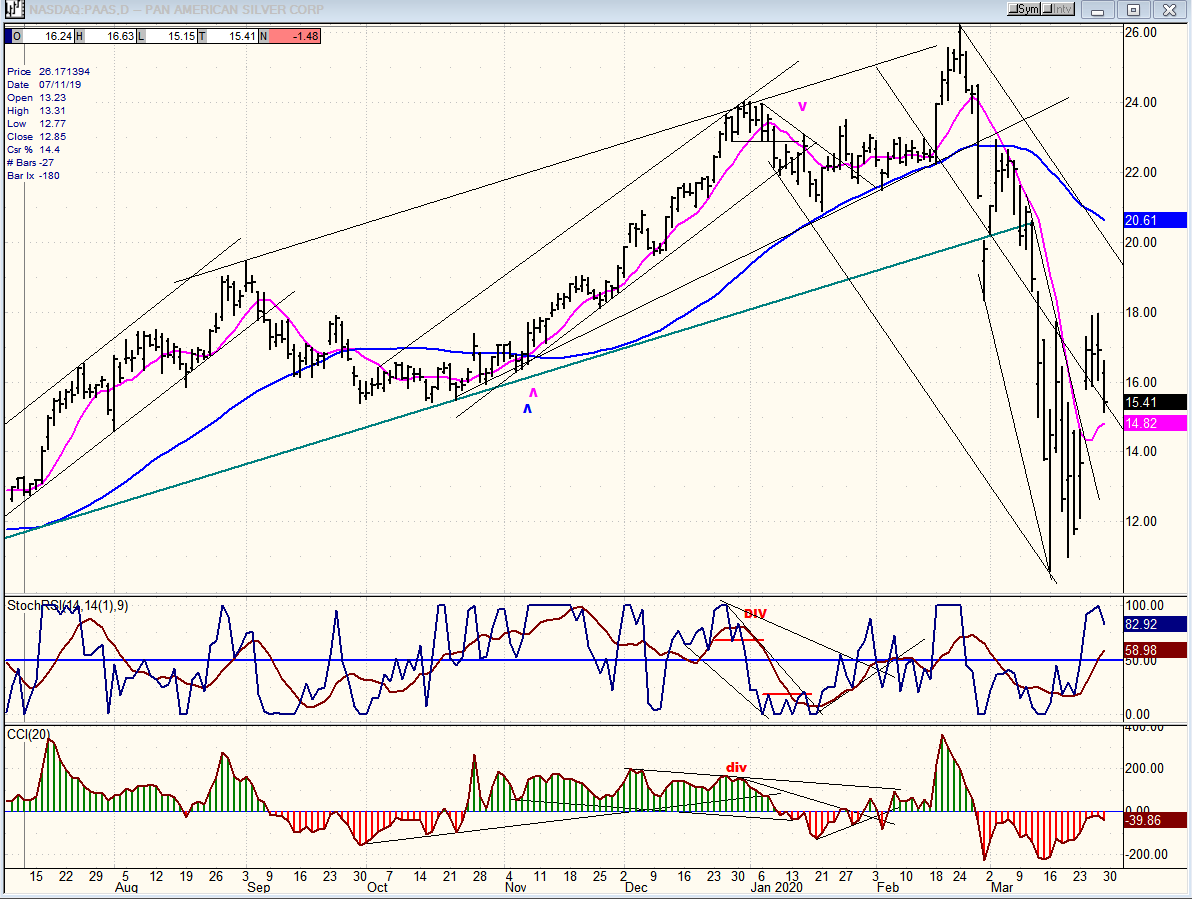
PAAS (Pan American Silver Corp)
Silver is lagging behind gold, but PAAS is also forming a nice base -- a small version of the GDX base -- which should allow it to reach its former recent high of 26 quickly when it resumes its uptrend.
BNO (U.S. Brent Oil fund)
BNO is dead in the water, and may remain that way for some time. Its main preoccupation will be to form a base over the next few weeks and months.

Summary
“A minor cycle low coming next week could lead to another quick spike, but we will have to wait until the second week in April for something more important to develop.”
You can see by last week’s summary that I had not expected that much of a rally. If we do not make a new low into the 80-day cycle, the odds will favor a new recovery high after it has bottomed.
Free trial subscription
With a trial subscription, you will have access to the same information that is given to paid subscribers, but for a limited time period. Over the years, I have developed an expertise in P&F charting (price projection), cycles (timing), some familiarity with EWT, and general technical analysis which enables me to warn subscribers of pending reversals in market trends and how far that trend can potentially carry. For a FREE 4-week trial, subscription options and payment plans, I encourage you to visit my website at www.marketurningpoints.com.
The above comments and those made in the daily updates and the Market Summary about the financial markets are based purely on what I consider to be sound technical analysis principles. They represent my own opinion and are not meant to be construed as trading or investment advice, but are offered as an analytical point of view which might be of interest to those who follow stock market cycles and technical analysis.
********

When Andre Gratian was a stock broker years ago, a friend introduced him to technical analysis of the market. Consequently, it is not an exaggeration to say that Andre fell in love with this approach! Ever since then, it has become an increasingly important part of his professional life. Gratian has studied the works of Wyckoff, Edwards & Magee, Edward J. Dewey (cycles) and many others. However, one of my most profitable undertaking has probably been to study Point & Figure charting, which he finds invaluable in analyzing stocks and indices. If he were restricted to one methodology, this is the one that he would choose. This well-rounded background has given him what he feels to be a special insight into the stock market, facilitating the recognition of meaningful patterns and the ‘turning points’ in all trends, whether they be short or long term. Andre feels very comfortable discussing the stock market and passing on meaningful information to others. His subscribers include individuals and money managers throughout the world. Moreover, his Newsletters are currently published on several financial sites, here and abroad.


