Technical Analysis Of The Markets


Current Position of the Market
SPX Long-term trend: An “official” bear market has now been declared.
SPX Intermediate trend: Intermediate low mid-year.
Analysis of the short-term trend is done on a daily-basis with the help of hourly charts. It is an important adjunct to the analysis of daily and weekly charts which discuss longer market trends.
End of Countertrend Rally
Point & Figure overview of SPX
Intermediate trend: Estimated top of countertrend rally ~2930!
Important cycles followed
I follow only a few cycles that I consider reliable in my analysis. This is complemented by the analysis of Erik Hadik (www.insiidetrack.com).
The 80-d cycle was due on 4/8(actual 4/3); next on 6/8; 40-wk ~7/15; 4.5-yr or 9-yr ~7/15.
Market Analysis (Charts courtesy of QCharts)
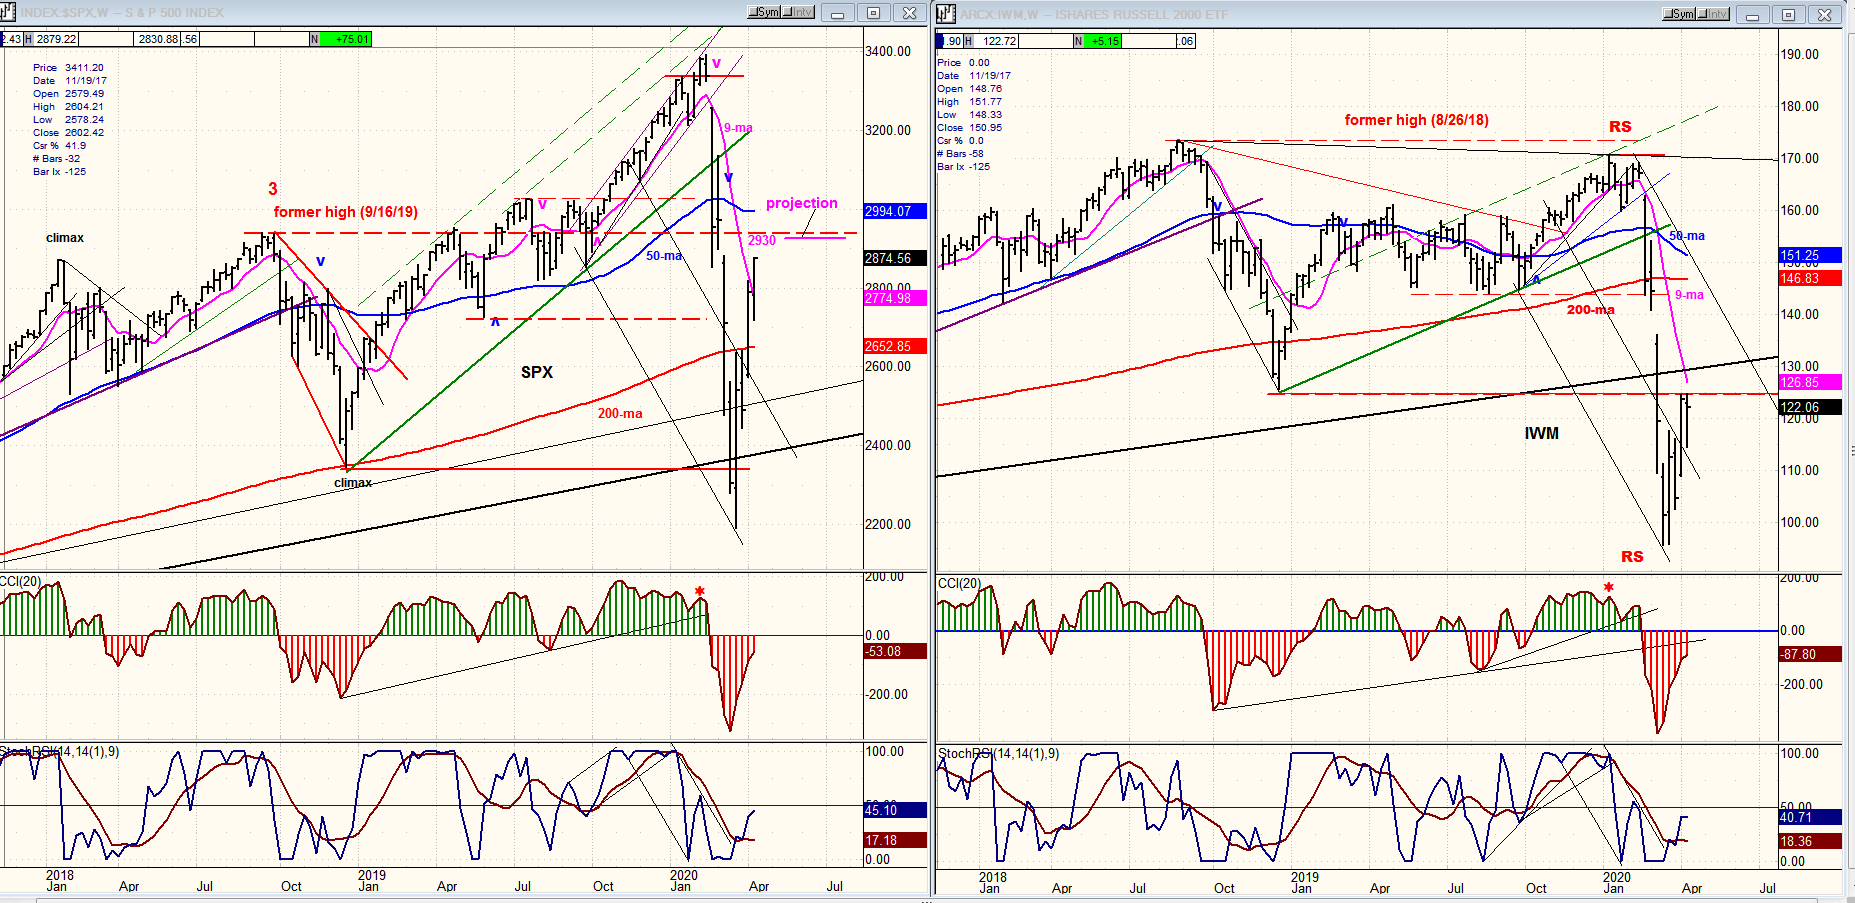
SPX- IWM weekly charts:
As the two indexes approach the end of their countertrend rally, IWM is increasing its relative weakness. Last week, SPX made a new weekly high, coming a little closer to its ~2930 projection, but IWM could not surpass last week’s high which had encountered resistance at the December 2018 low. In spite of their significant rallies from their oversold levels of mid-March, both of their weekly oscillators remain firmly entrenched in negative territory.
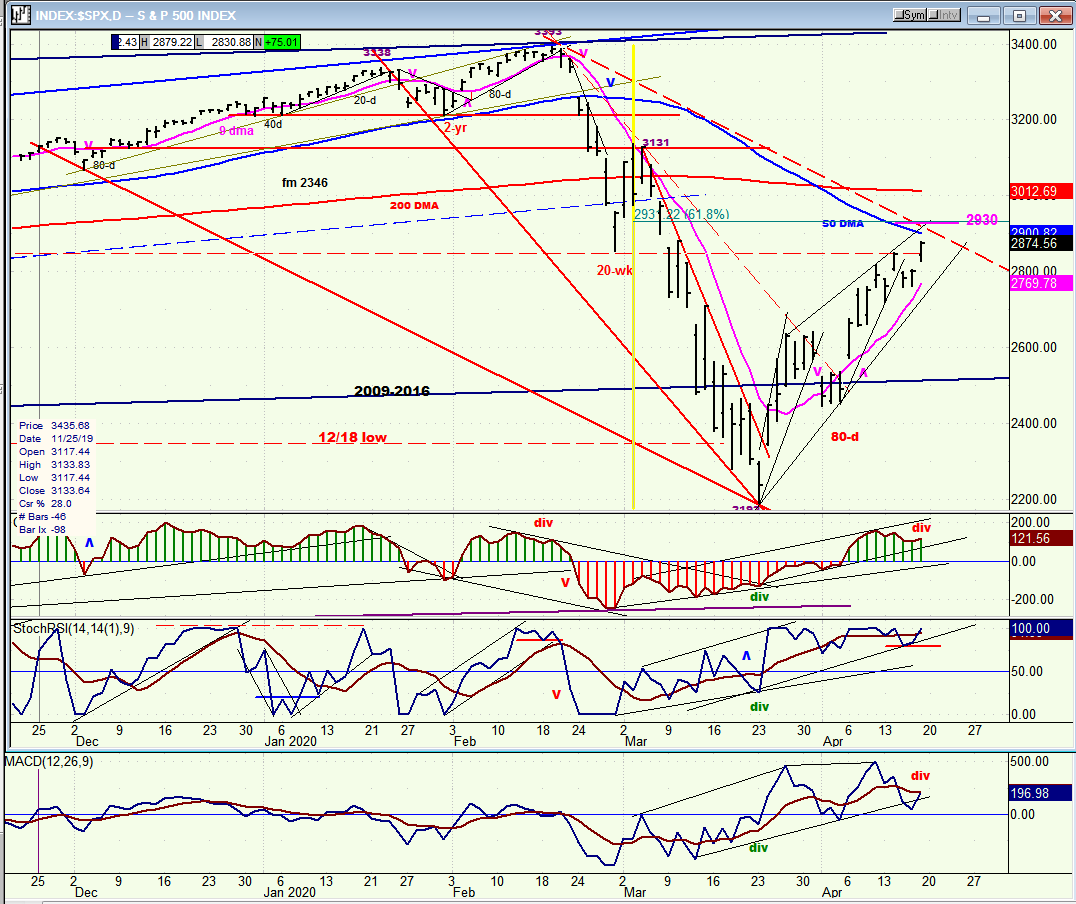
SPX daily chart
Last week brought us closer to our projection high of ~2930. The time target is contained in the price, and the end of the bear market rally should come whenever we reach the projection. Everything considered, next week would be a good time to put an end to the rally.
The market has given considerable relief to those who were caught unaware by the sudden bearish reversal. While we cannot be certain of what lies ahead, it would not be surprising to see another phase of selling develop which resembles the first one. Ending the countertrend in the vicinity of the 50-dma makes a lot of sense, technically. The 2930 P&F projection also closely corresponds to the .618 retracement of the entire decline from 3393.
In addition, the negative divergence which is now appearing in the CCI and the A-D oscillator signals that we are near the end of the rally. All we need to confirm the warning issued by all of the above is for the index to reverse its trend. Since traders are very much aware that we are near a decision point, the reversal can be sudden and significant.
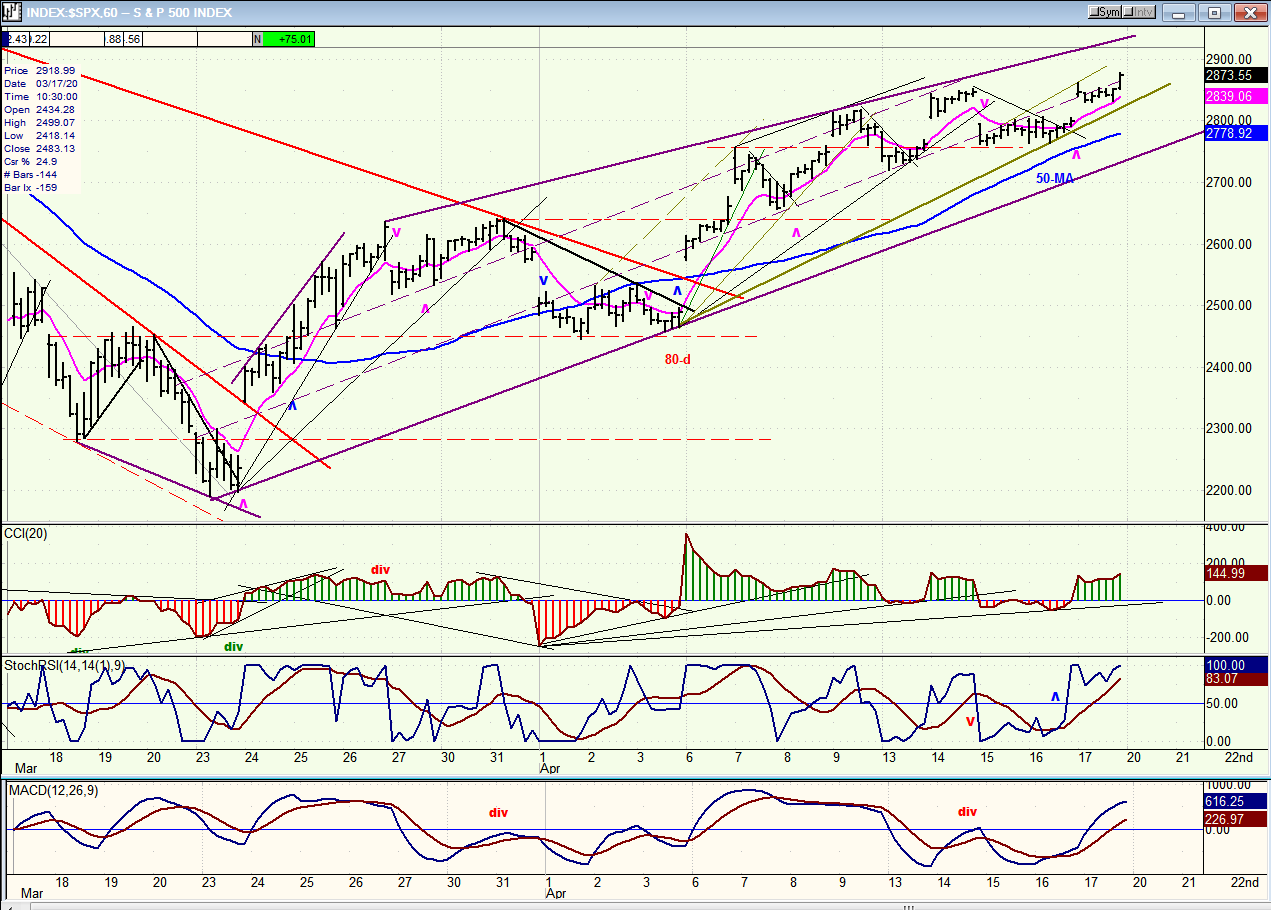
SPX hourly chart
The hourly chart of the SPX shows a wedge formation which is close to ending as it approaches the projection shown in the daily chart. The oscillators tell us that it could take a few more hours, and perhaps days to complete the formation, but the analysis can be simplified if we wait for the price to cross below the blue 50-hr MA. When this happens, it should quickly be followed by the primary trend line break, and the next downtrend will thereby have become established.
As stated above, this could come as early as next week. When the sell signal occurs, we should have a pretty good idea of how far the second phase of the decline will extend. For now, let’s just say that it could be very significant; perhaps rivaling the initial selling spell in importance.
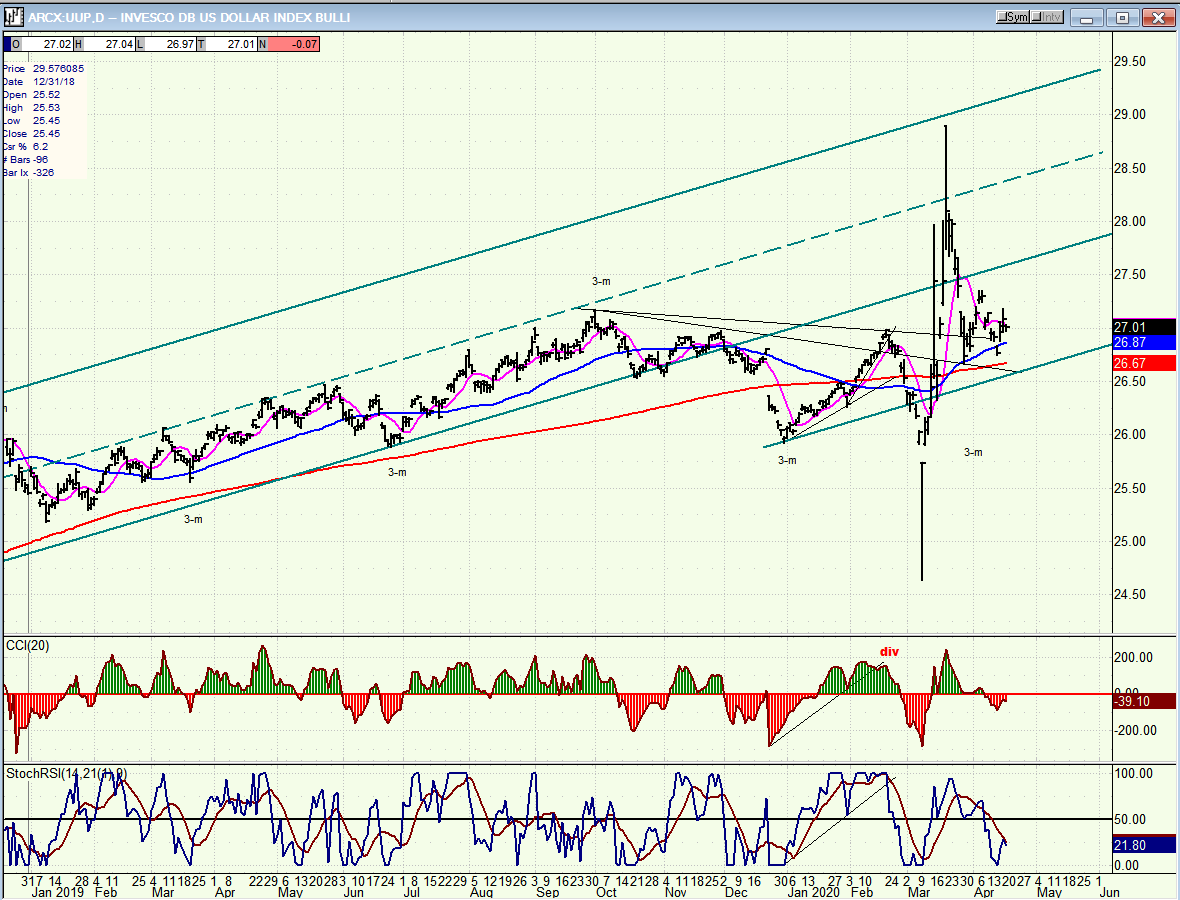
UUP (dollar ETF) daily
After some wild gyrations which were caused by the market sell-off, and drastic actions taken by the Fed, UUP has settled down into a more normal trading pattern which may consist of having established another channel just below the original one, within which prices could move for a while longer. If some strength returns, it’s possible that it could even rise to the dashed line which was the center line of the original channel.
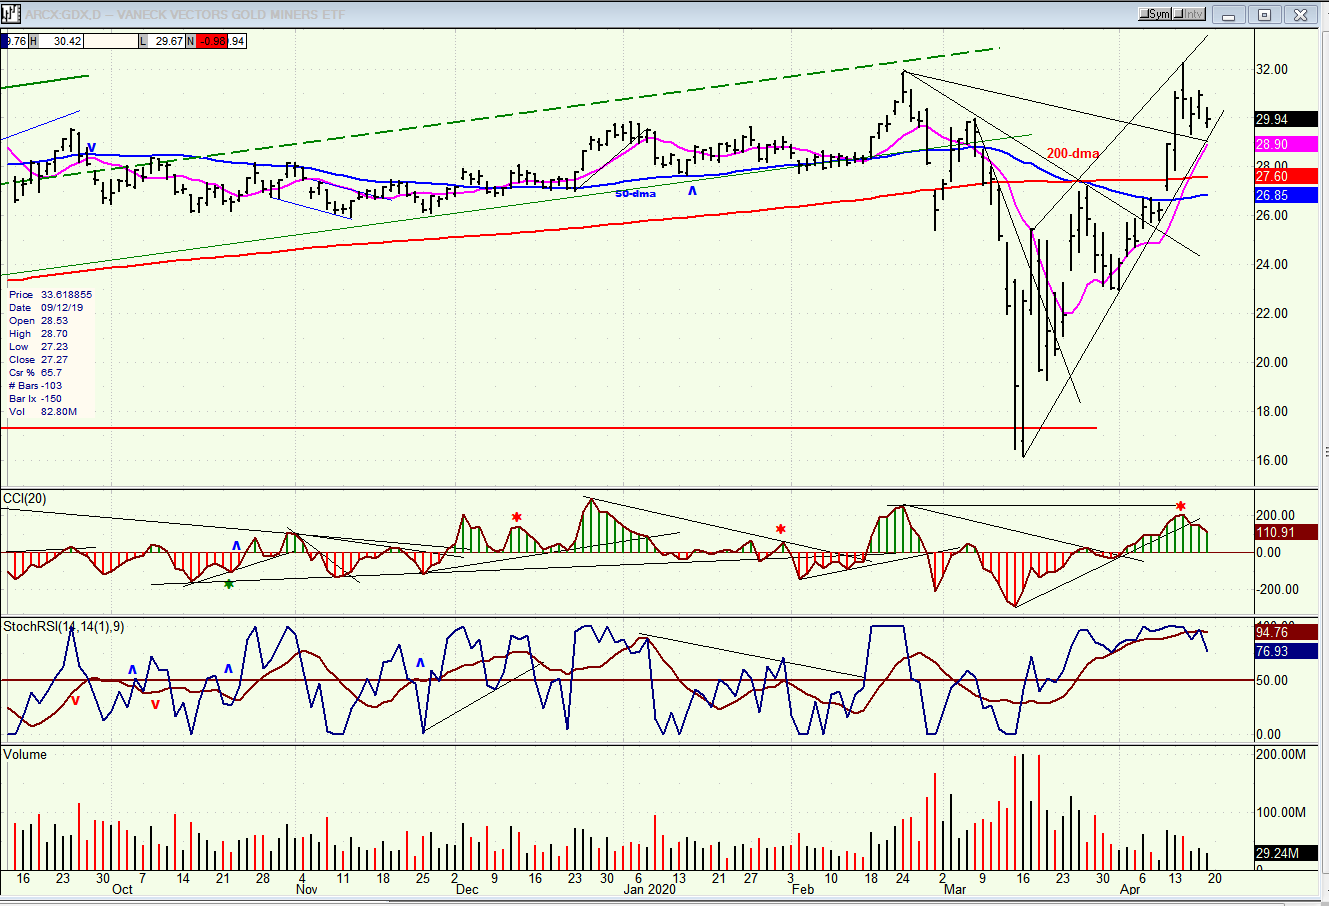
GDX (gold miners) daily
GDX had a quick sell-off and made a rapid come back which took it fractionally above its former high of 31.84. This may be all we get for now. If so – and we should know shortly – a return to the blue 50-dma is likely before it is ready to resume its uptrend.
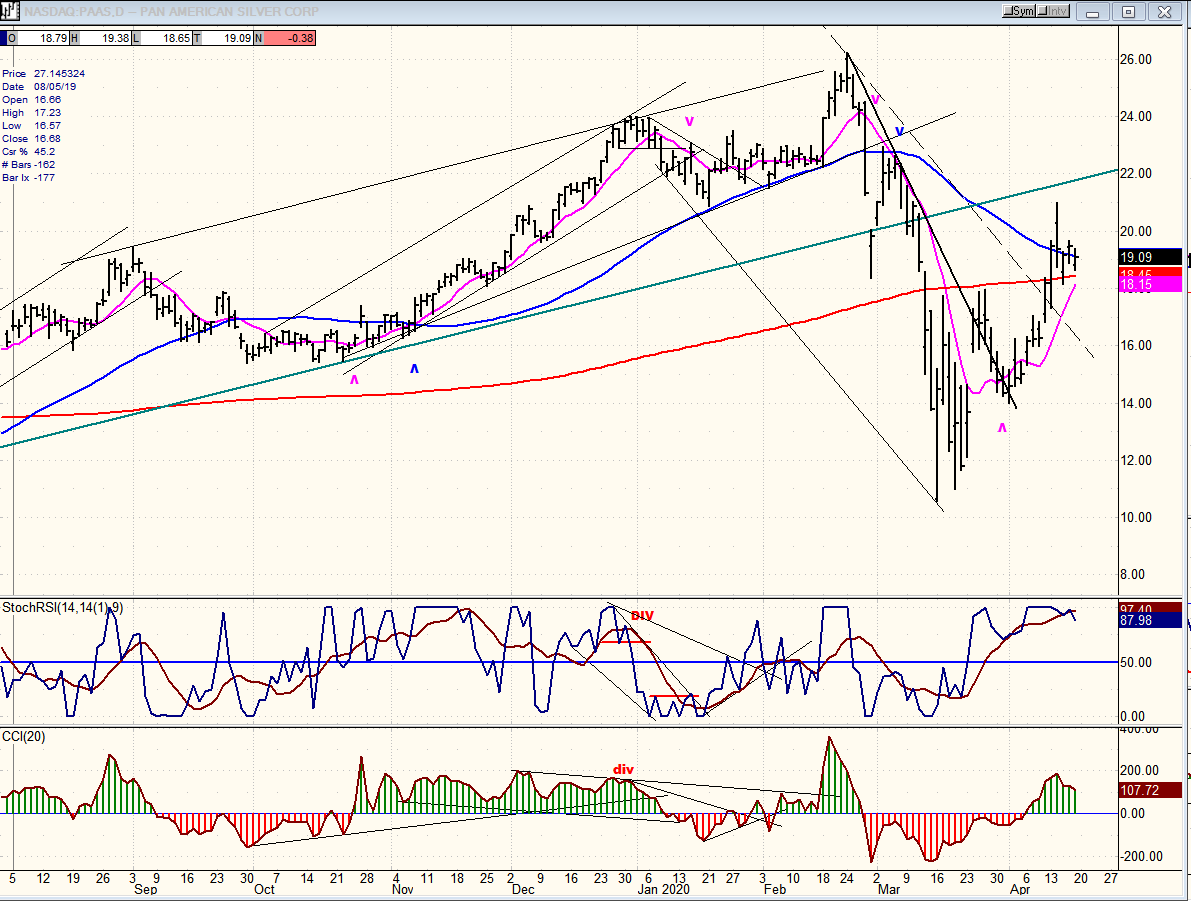
PAAS (Pan American Silver Corp) daily
PAAS continues to look like a less dynamic version of the GDX pattern. Its upside progress has been arrested by the 50-dma, and a correction back down to about 18 or a little lower is likely.
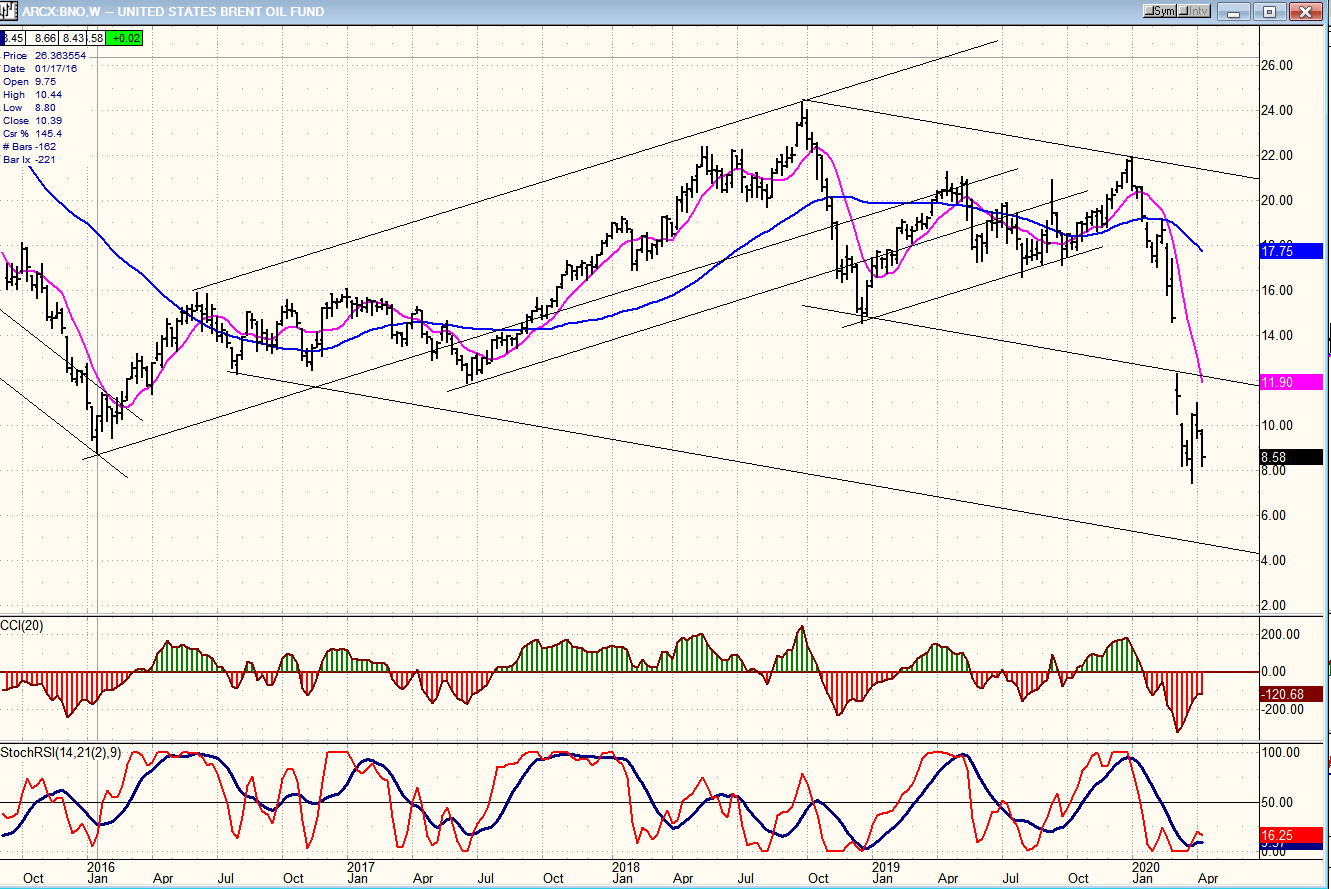
BNO (U.S. Brent Oil fund) weekly
The weekly chart of BNO gives us a better perception of what it could do in the foreseeable future. If the market has another significant decline over the next few weeks or months, BNO can easily move to the bottom of the large channel drawn on the chart.
Summary
SPX is quickly approaching the 2930 target that had been predicted some time ago. It would not be surprising to see it met as early as next week.
Free trial subscription
With a trial subscription, you will have access to the same information that is given to paid subscribers, but for a limited time period. Over the years, I have developed an expertise in P&F charting (price projection), cycles (timing), some familiarity with EWT, and general technical analysis which enables me to warn subscribers of pending reversals in market trends and how far that trend can potentially carry. For a FREE 4-week trial, subscription options and payment plans, I encourage you to visit my website at www.marketurningpoints.com.
The above comments and those made in the daily updates and the Market Summary about the financial markets are based purely on what I consider to be sound technical analysis principles. They represent my own opinion and are not meant to be construed as trading or investment advice, but are offered as an analytical point of view which might be of interest to those who follow stock market cycles and technical analysis.
********

When Andre Gratian was a stock broker years ago, a friend introduced him to technical analysis of the market. Consequently, it is not an exaggeration to say that Andre fell in love with this approach! Ever since then, it has become an increasingly important part of his professional life. Gratian has studied the works of Wyckoff, Edwards & Magee, Edward J. Dewey (cycles) and many others. However, one of my most profitable undertaking has probably been to study Point & Figure charting, which he finds invaluable in analyzing stocks and indices. If he were restricted to one methodology, this is the one that he would choose. This well-rounded background has given him what he feels to be a special insight into the stock market, facilitating the recognition of meaningful patterns and the ‘turning points’ in all trends, whether they be short or long term. Andre feels very comfortable discussing the stock market and passing on meaningful information to others. His subscribers include individuals and money managers throughout the world. Moreover, his Newsletters are currently published on several financial sites, here and abroad.


