Technical Analysis Of The Markets


Current Position of the Market
SPX: Long-term trend – We are in an official bear market
Intermediate trend – re-testing April high
Analysis of the short-term trend is done on a daily basis with the help of hourly charts. It is an important adjunct to the analysis of daily and weekly charts which discusses the course of longer market trends.
The Great Disconnect
Point & Figure Overview of SPX
Intermediate trend: Re-accumulation suggests ~2970
Important Cycles
Next 80-day cycle due ~6/08
Market Analysis (Charts courtesy of QChart)
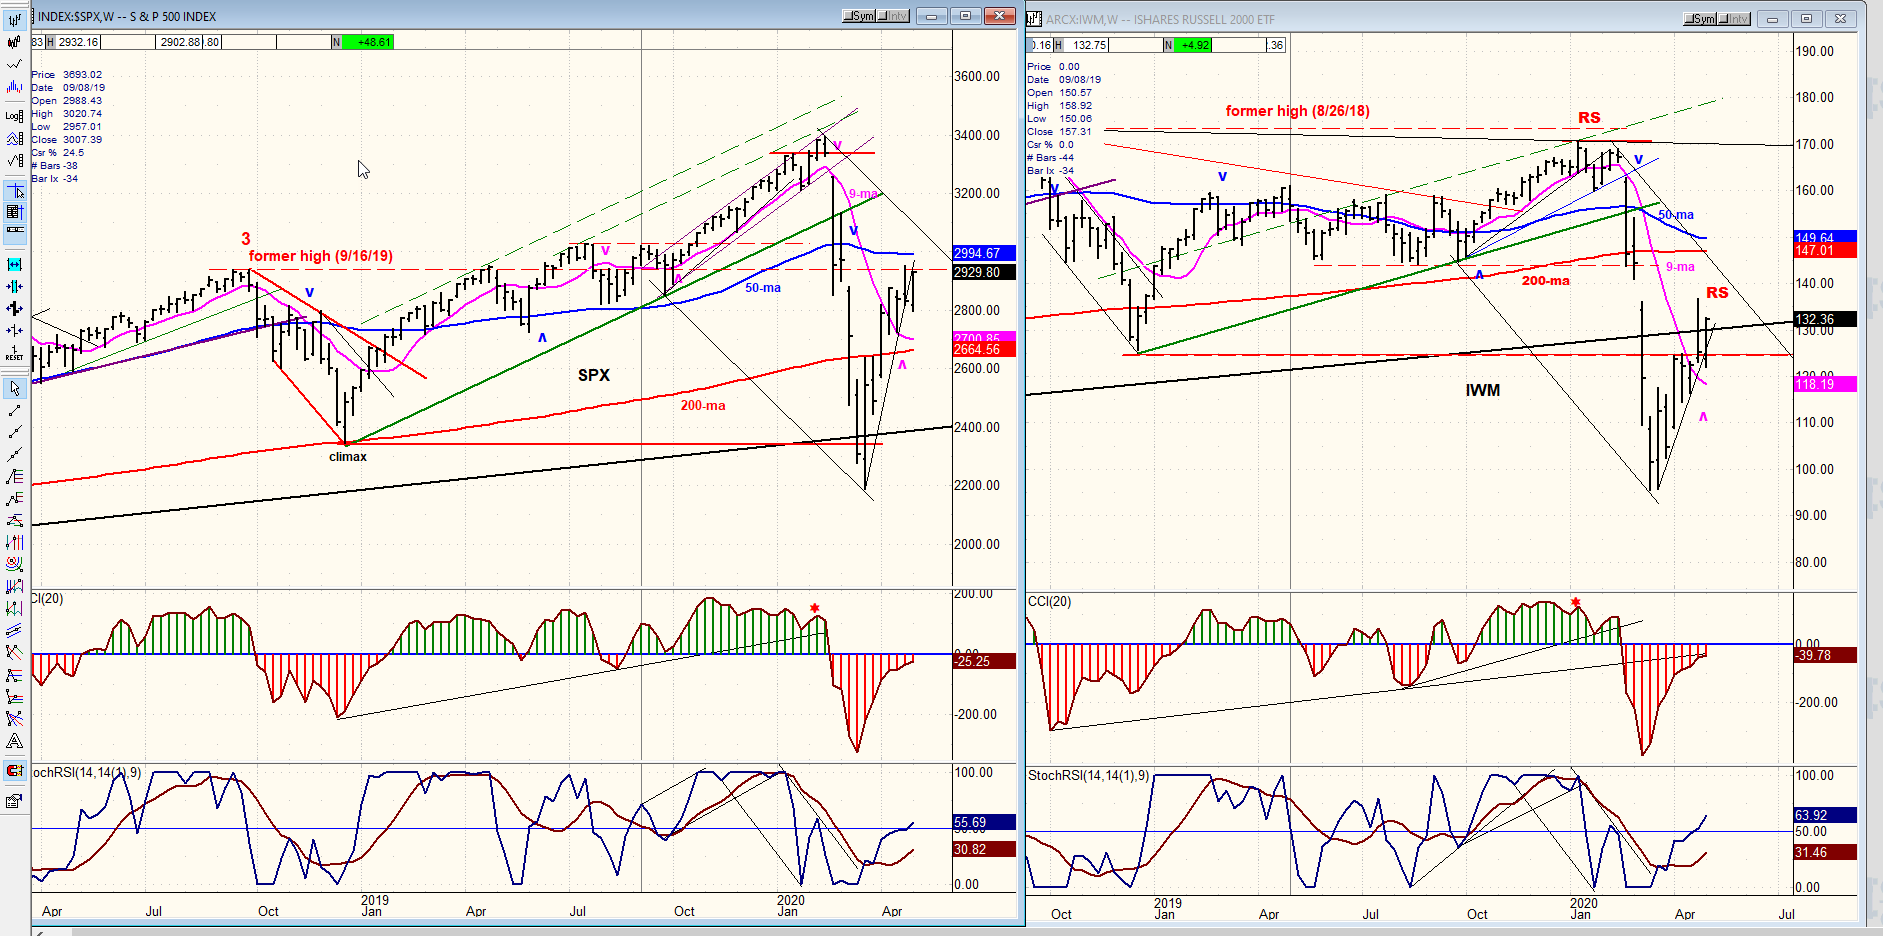
SPX-IWM weekly charts
On Friday 5/8, the labor dpt. released a horrific jobs report! SPX celebrated by tacking a 49-point advance on top of the 33-point rally that it had registered on Thursday. This glaring disconnect can be explained by the fact that investors are looking at this economic devastation as a temporary annoyance which the country has to live with for the next three to six months, after which the virus will go away and it can get back to normal! This rosy scenario is undoubtedly much too optimistic given all the uncertainties that lie ahead, and it has, to some extent, been fostered by bullish cycles which should turn negative in the near future. So, let’s try to be a little more objective about what could materialize between now and the middle of the year.
After retracing during the previous week, the two indices have rallied and, by Friday’s close, they were re-testing their near-term highs. Cycles suggest that a top could form by ~ 5/15. Relative weakness continues to prevail in IWM.
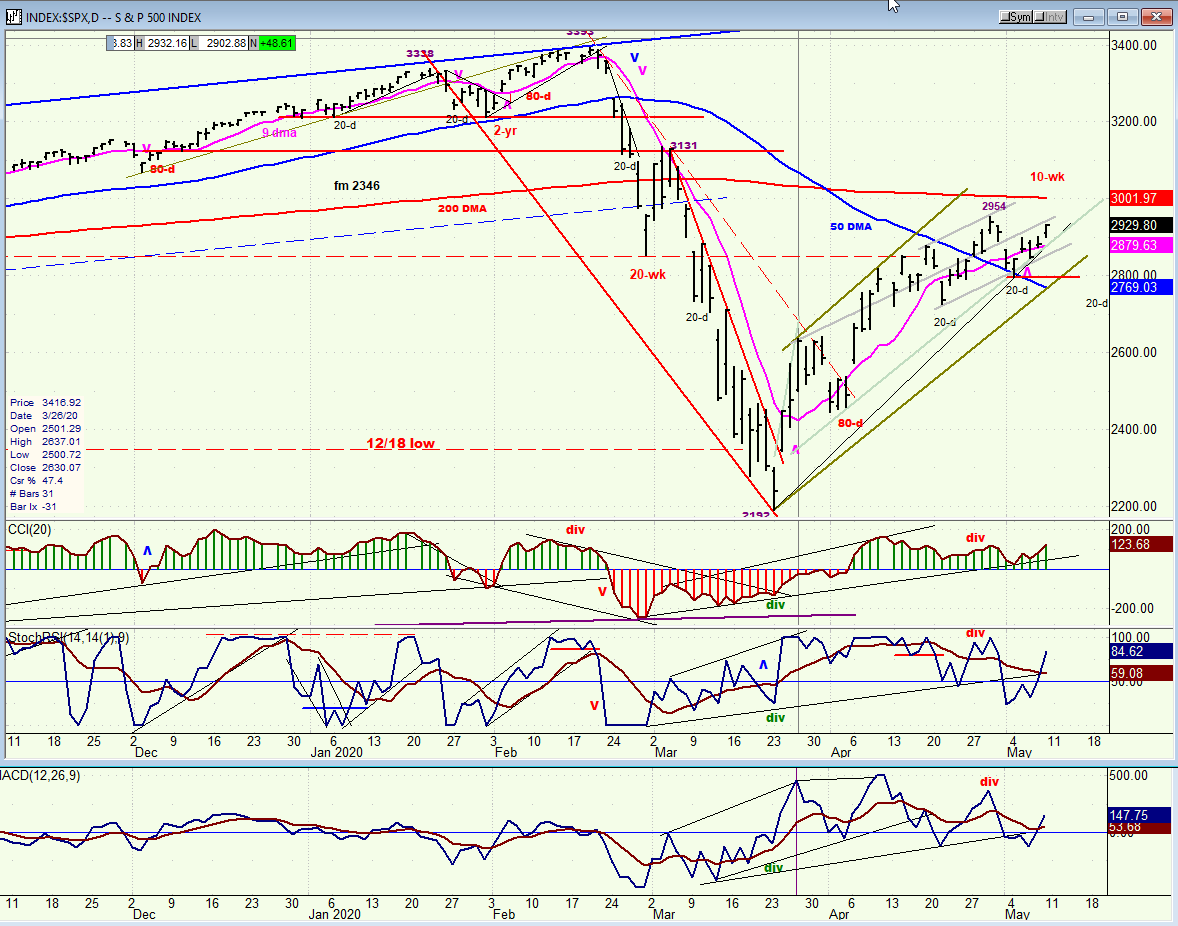
SPX daily chart
On Friday, SPX spurted to 2932 in the last hour of trading and closed at 2929, returning to the level which had been suggested as the high of the countertrend rally from 2192. While this could simply be a re-test of the high of 2955 which occurred a week ago, a slight adjustment to the former projection now targets about 2970, and the strength displayed on Friday supports the new projection. I suspect that a high could come early next week, but we may not be fully ready to put an end to the countertrend rally and have a clean reversal until around May 15.
As discussed earlier, investors may be a little too optimistic about the duration of the economic recovery, and if we indeed put in a top in the next week or two and start the next phase of the correction, it could last until the middle of the year, re-test the 2192 low, and perhaps even exceed it.
I’ll wait until a top is firmly established to venture a P&F projection, but we could already get an inkling of what lies ahead. The first decline amounted to about 45% of the entire bull market from 2009. Since a normal trend retracement is from .382 to .50 of the previous up-trend, even if this is wave 4, the market could decide on a 50% retracement, leading to a new low of about 2025.
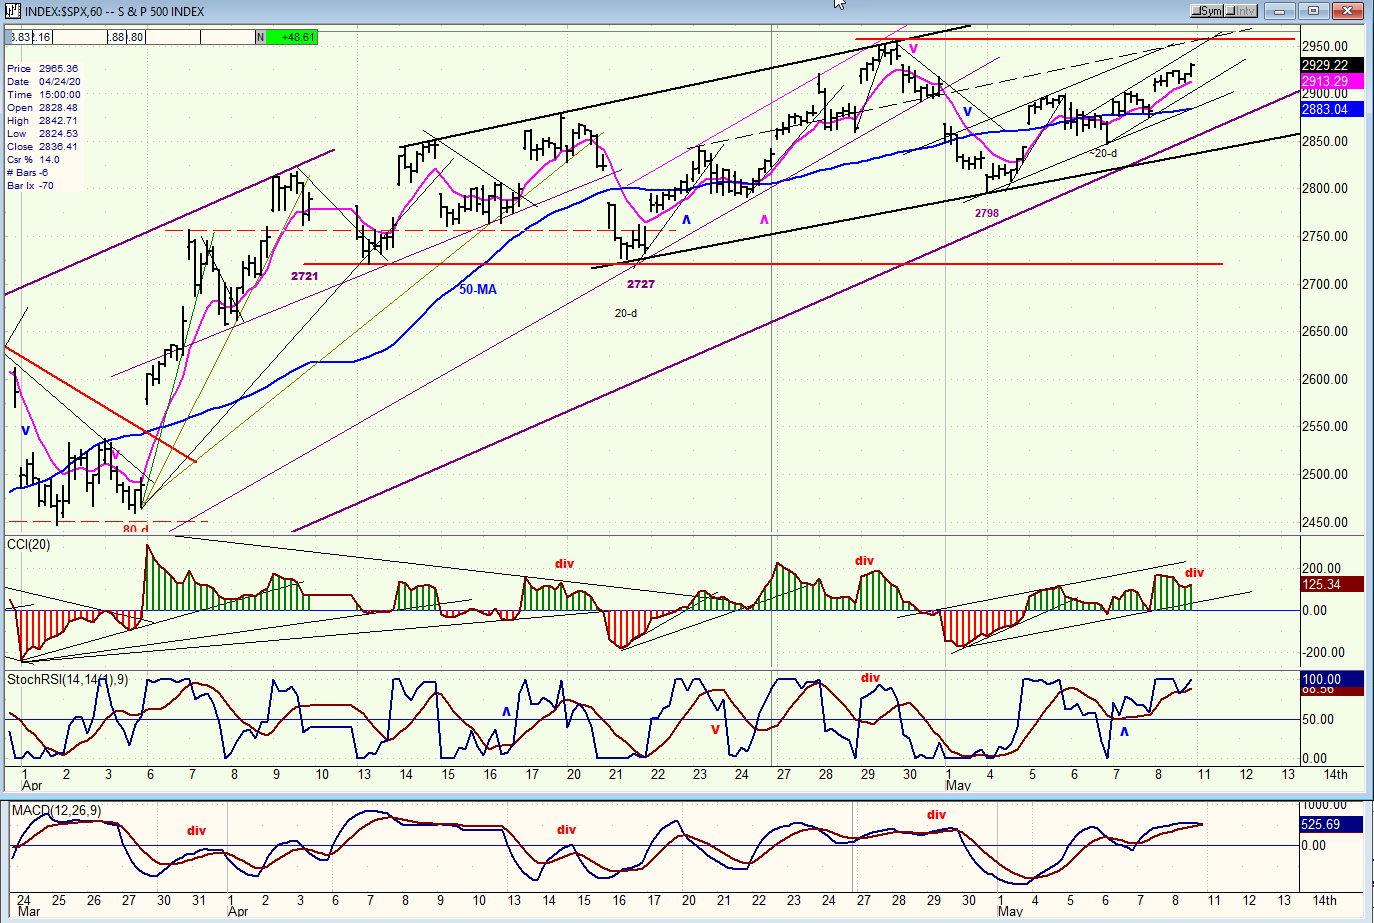
SPX hourly chart
While SPX closed strong on Friday, that last push into the close which registered a new high from 2798 was not matched by a new high in the CCI, thereby creating some negative divergence. This is always a warning sign that we could be at, or close to the end of a move.
There is a fairly consistent minor cyclic rhythm displayed in the hourly chart. At times it is easier to discern than at others, but divergence in the CCI is normally a sign that we are at, or close to, the top of the cycle phase – providing it is not erased by the next move in the index. The fact that it displayed on Friday suggests that we should be on alert early in the week for a minor top which, if the 2970 level is reached or approximated on Monday or Tuesday and the negative divergence remains in place, we should next look for the short-term trend line from 2798 to be broken. That would most likely give us a sell signal, especially if the index goes on to break the longer trend lines below it.
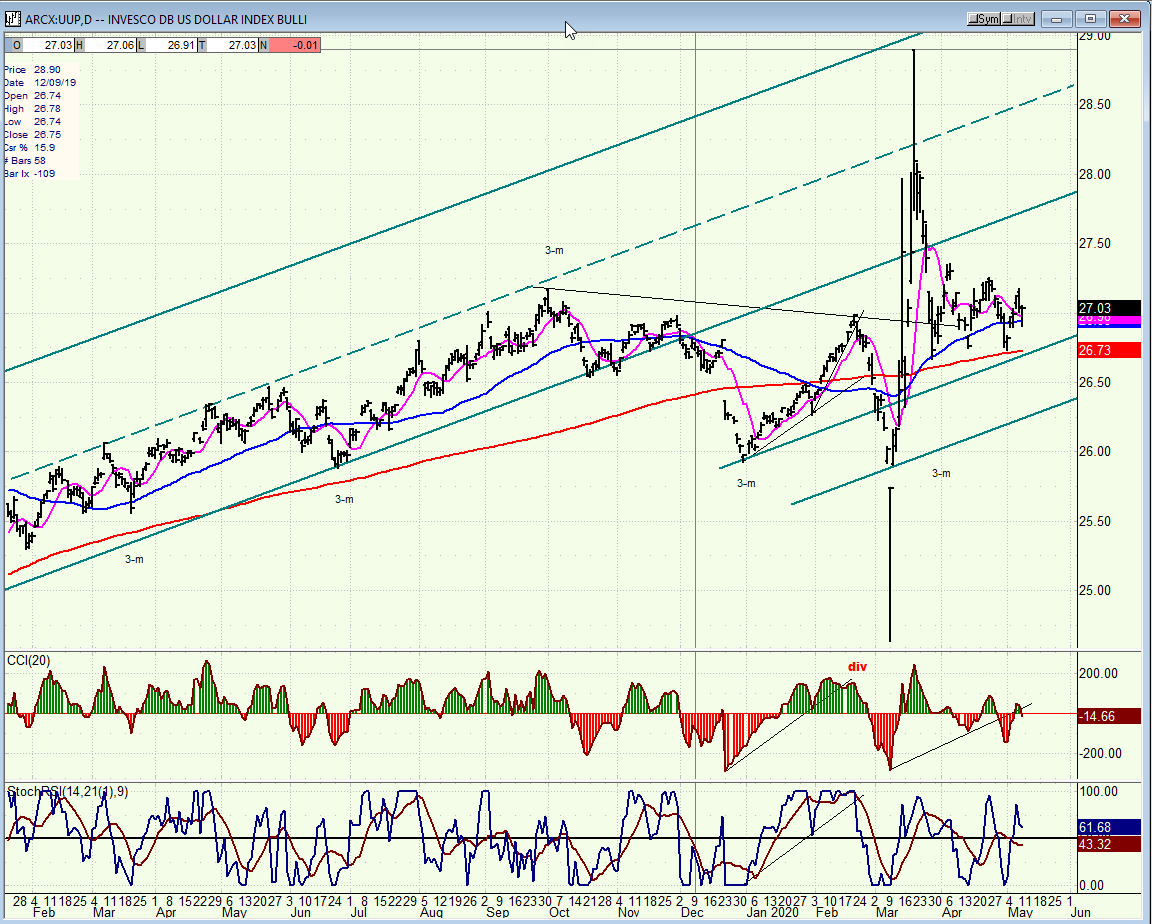
UUP (dollar ETF) daily
UUP continues to trade in a narrow range, but as it gets closer to its 3-m cycle low it should begin to succumb to some selling pressure.
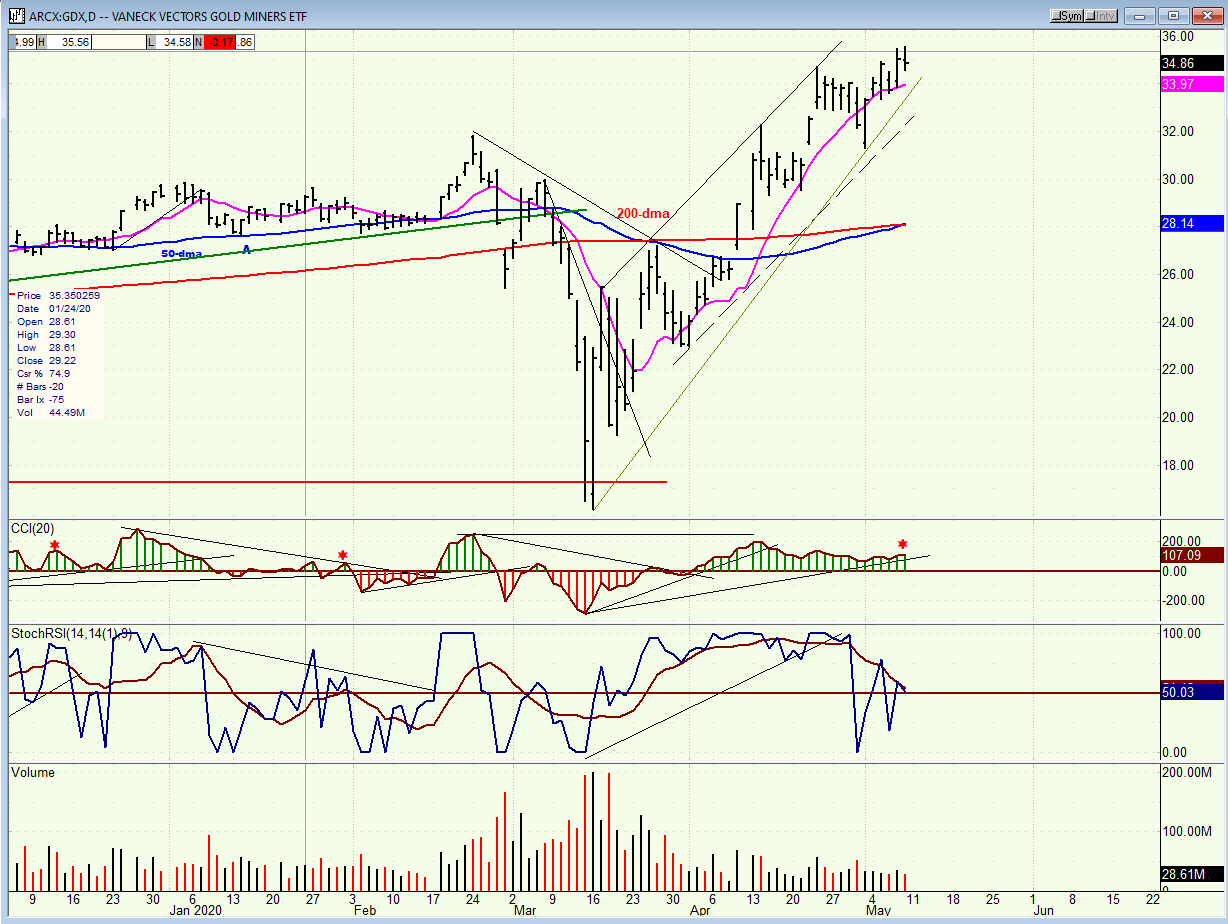
GDX (Gold miners ETF) daily
This may be the last chance for GDX to extend its move. If it does, it can reach 37.50 but if it begins to roll over and the CCI goes negative, it will have started a correction phase.
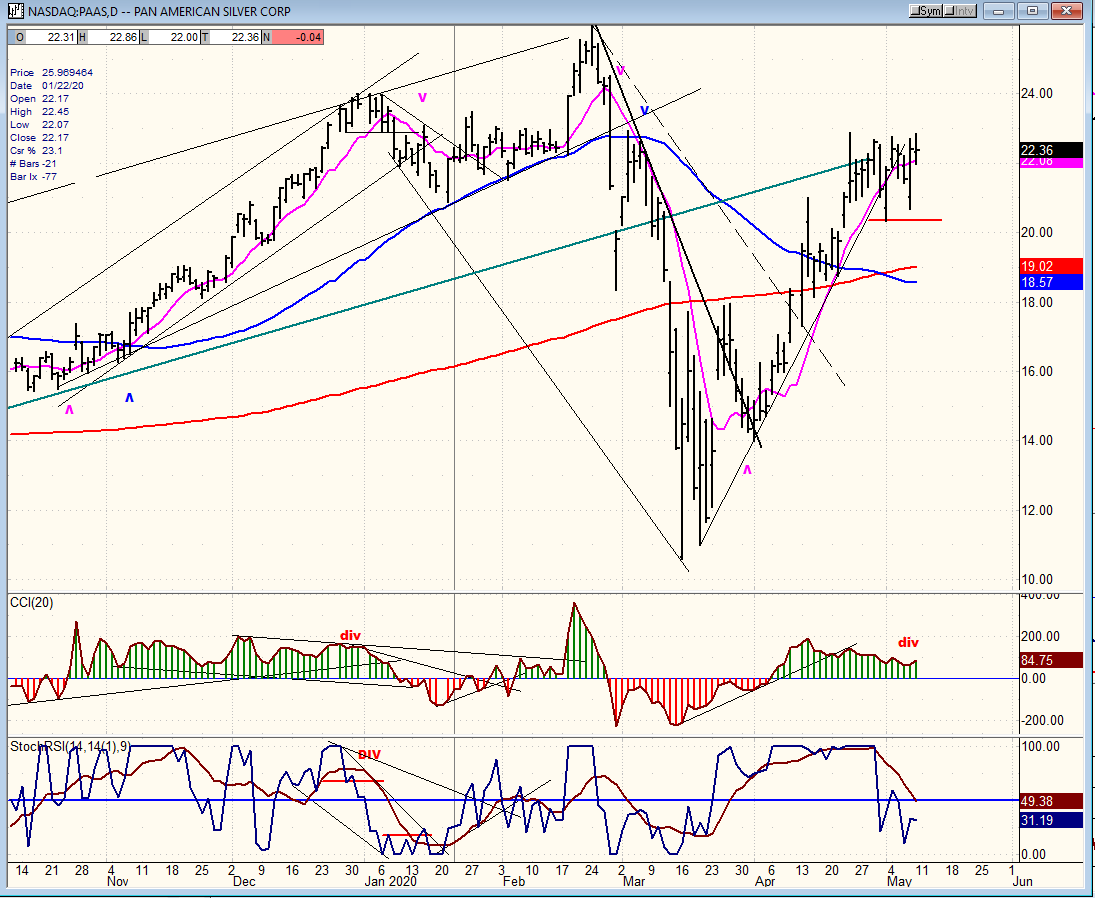
PAAS (Pan American Silver Corp.) daily
Ditto for PAAS which continues to trade in tandem with GDX.
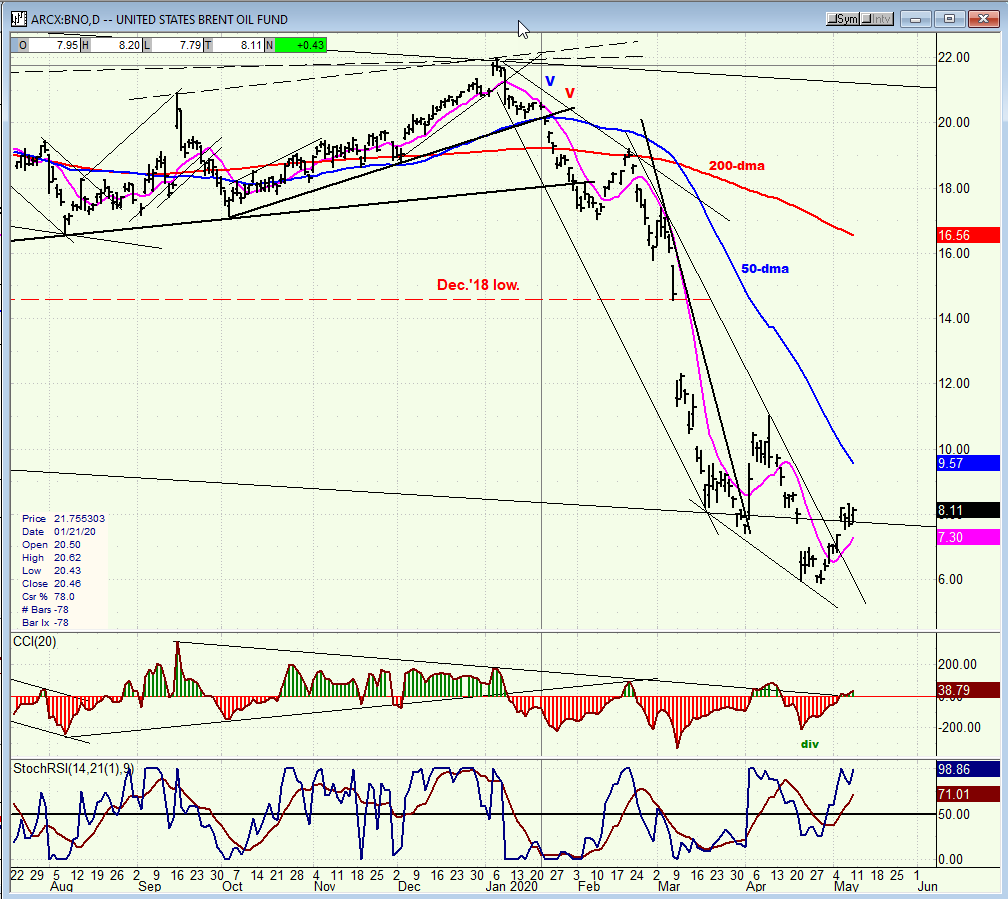
BNO (U.S. Brent oil fund) daily
BNO is likely to be limited to the formation of a base for the foreseeable future.
Summary
The stock market is following its own logic, or rather collective investor logic which must be observed, no matter how disconnected it appears to be from what we perceive as reality. Technical analysis of SPX suggests that it could be in the process of ending the counter-trend rally which started from 2192.
FREE TRIAL SUBSCRIPTON
With a trial subscription, you will have access to the same information that is given to paid subscribers, but for a limited time period. I think you will find that knowing how far a move can carry is one of the most useful benefits of this service, whether you are a trader or an investor -- especially when this price target is confirmed by reliable indicators which give advance warning of a market top or bottom. Furthermore, cycle analysis adds the all- important time element to the above price projections. For a FREE 4-week trial, further subscription options, payment plans, and for general information, I encourage you to visit my website at www.marketurningpoints.com.
The above comments about the financial markets are based purely on what I consider to be sound technical analysis principles. They represent my own opinion and are not meant to be construed as trading or investment advice, but are offered as an analytical point of view which might be of interest to those who follow stock market cycles and technical analysis.
********

When Andre Gratian was a stock broker years ago, a friend introduced him to technical analysis of the market. Consequently, it is not an exaggeration to say that Andre fell in love with this approach! Ever since then, it has become an increasingly important part of his professional life. Gratian has studied the works of Wyckoff, Edwards & Magee, Edward J. Dewey (cycles) and many others. However, one of my most profitable undertaking has probably been to study Point & Figure charting, which he finds invaluable in analyzing stocks and indices. If he were restricted to one methodology, this is the one that he would choose. This well-rounded background has given him what he feels to be a special insight into the stock market, facilitating the recognition of meaningful patterns and the ‘turning points’ in all trends, whether they be short or long term. Andre feels very comfortable discussing the stock market and passing on meaningful information to others. His subscribers include individuals and money managers throughout the world. Moreover, his Newsletters are currently published on several financial sites, here and abroad.


