Technical Analysis Of The Markets


Current Position of the Market
SPX: Long-term trend – Having rallied well past a .618 retracement of the decline into March 2020, it is time to consider the possibility that the retracement was only an interruption of the bull market which originated in 2009.
Intermediate trend – Intermediate target reached.
Analysis of the short-term trend is done daily with the help of hourly charts. It is an important adjunct to the analysis of daily and weekly charts which discusses the course of longer market trends.
A Return to Sanity
Important Cycles
Did the 4.5-year cycle bottom in March instead of waiting for its ideal low point in July? This is a possibility according to a Hurst analyst. Perhaps we should not be too eager to call for an early low in the 4.5-year cycle. Of course, the 40-wk cycle is also due in mid-July, and it’s not exactly a wimp! Before that, a 36-day cycle is due to bottom. All the above are posted on the daily chart.
Point & Figure Overview of SPX
Intermediate projection: 3220-3250? (filled). Loose projection for mid-July: 2586.
Market Analysis (Charts courtesy of QChart)
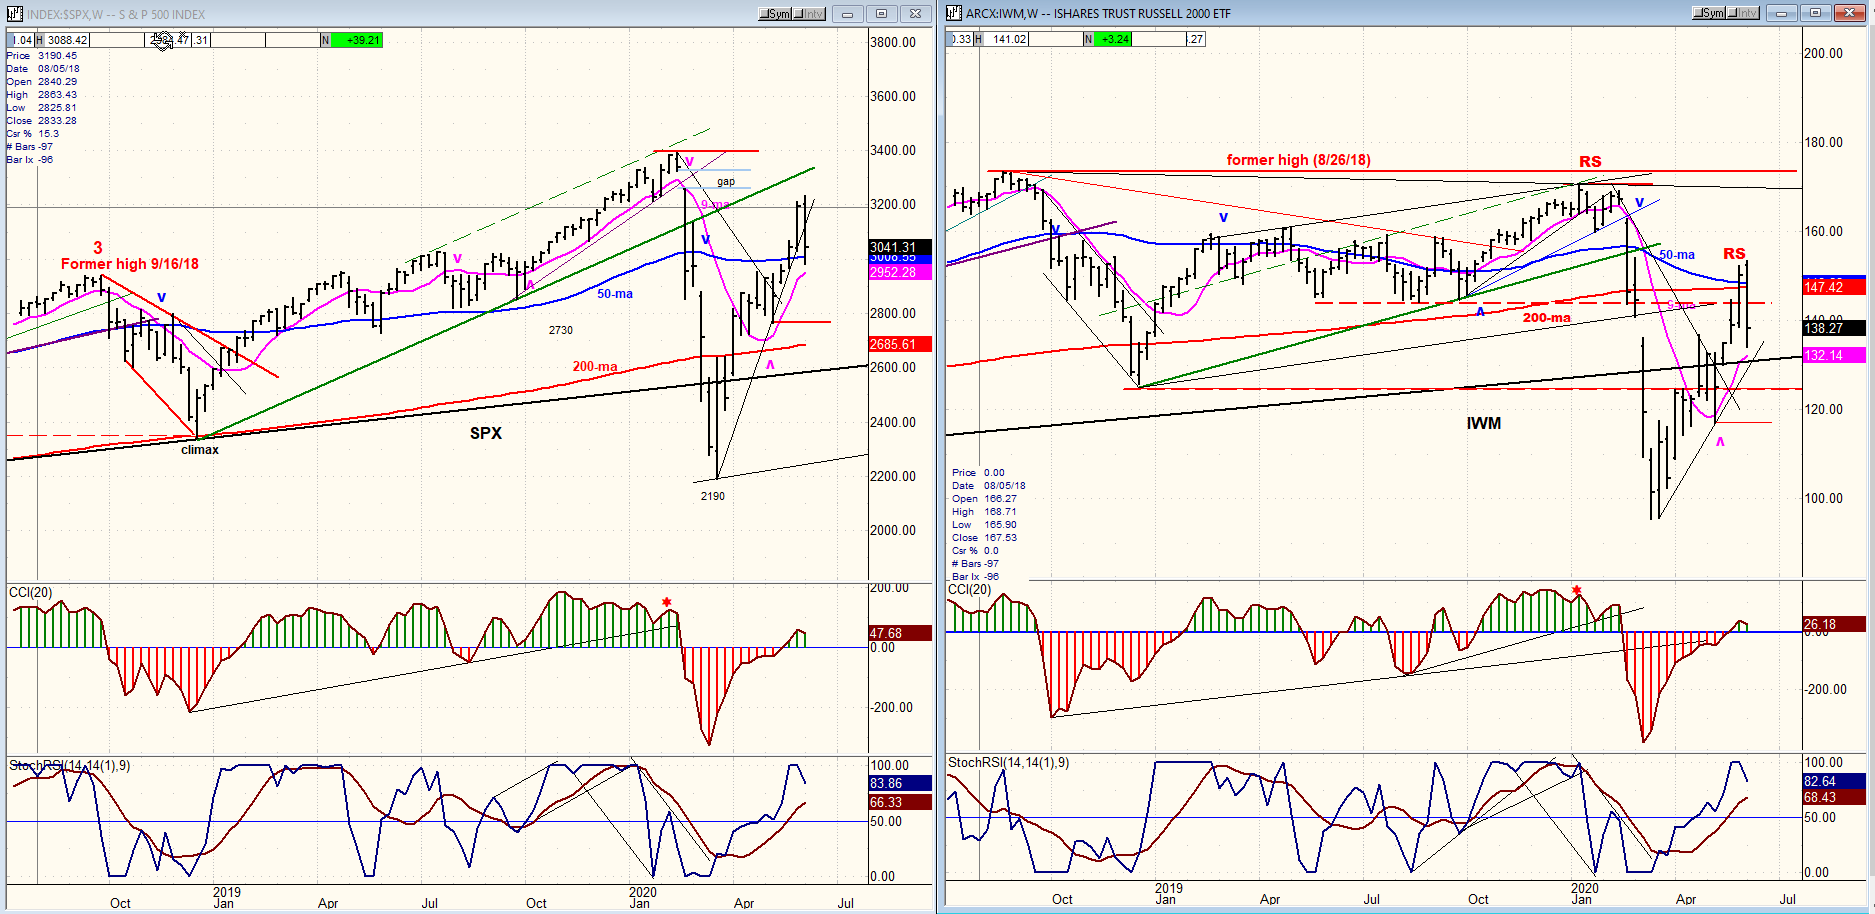
SPX-IWM weekly charts
Last week, SPX met the projection target of 3220-3250 and reversed with a dramatic decline of 248 points intra-week. This should be the start of a decline into mid-July which is scheduled to be the low of the 40-wk cycle, at least! The severe retracement into March prompted some cycle analysts to suggest that the 4.5-yr cycle might have bottomed six months early. Last week’s debacle is causing some re-thinking about the timing of the larger cycle low. It is best to see how the index progresses from here before coming to a final decision on this matter. It’s also best to wait before labeling the EW structure.
IWM kept its relative weakness intact by retracing a larger percentage decline than SPX, last week.
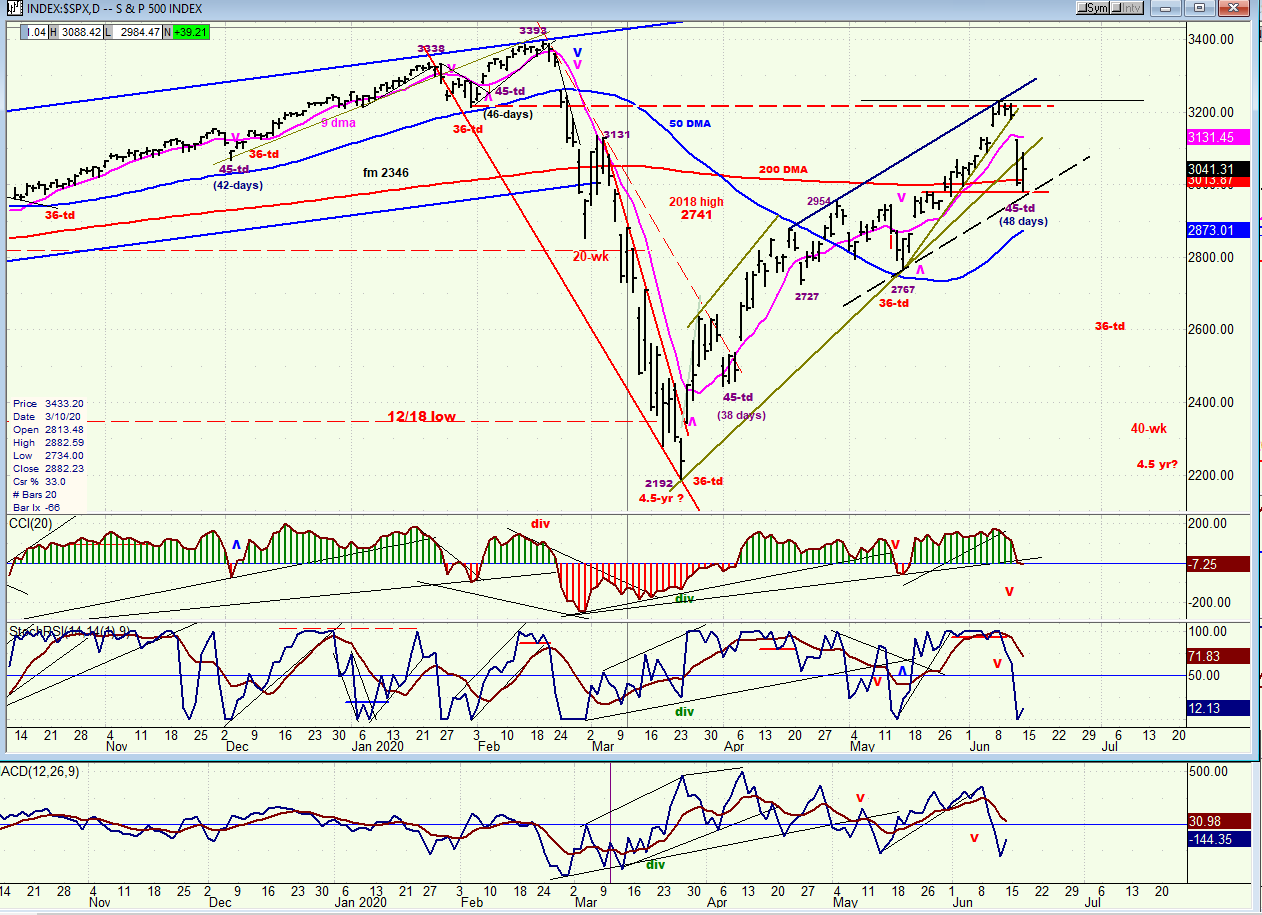
SPX daily chart
The index met its intermediate projection, traded for four days in a small range during which it created a distribution pattern on the P&F chart and reversed sharply; most likely being pulled down by the bottoming 45-day cycle and exceeding its downside P&F target by over a hundred points, but finding support in the area of a 50% retracement of the uptrend that had been generated from the 2767 low of 5/14 (36-td low). I make it a point to note that 5/14 was the 36-td cycle low because this was confused as being the 45-td cycle low by several analysts. That the latter waited until the very last minute to take hold was undoubtedly a factor.
On Friday, SPX exhibited a great deal of volatility. First, by immediately making a .382 retracement of its downtrend which took it back to the broken trend line where it found resistance and reversed. That sent it back down to a slightly new low before rebounding into the close. As we will see next on the 60-m chart, this only generated a preliminary buy signal, but since the rapidly-formed base gives it a minimum count to 3090, we should expect the late Friday rally to continue to at least that level. Considering the fact that the 45-td cycle most likely did make its low on Friday, we can assume that what is probably a consolidation in a downtrend will take a few more days to conclude and price may retrace to 3115 or higher before reversing. We can also see that the CCI did not produce a decisive sell signal on Friday, and that SPX found support just inside a secondary channel and in the vicinity of its 200-dma.
I have marked the dates on which the important cycles that lie ahead will make their lows and which should prevent the index from currently making a lengthy consolidation before rolling over once again and coming out of the second channel.
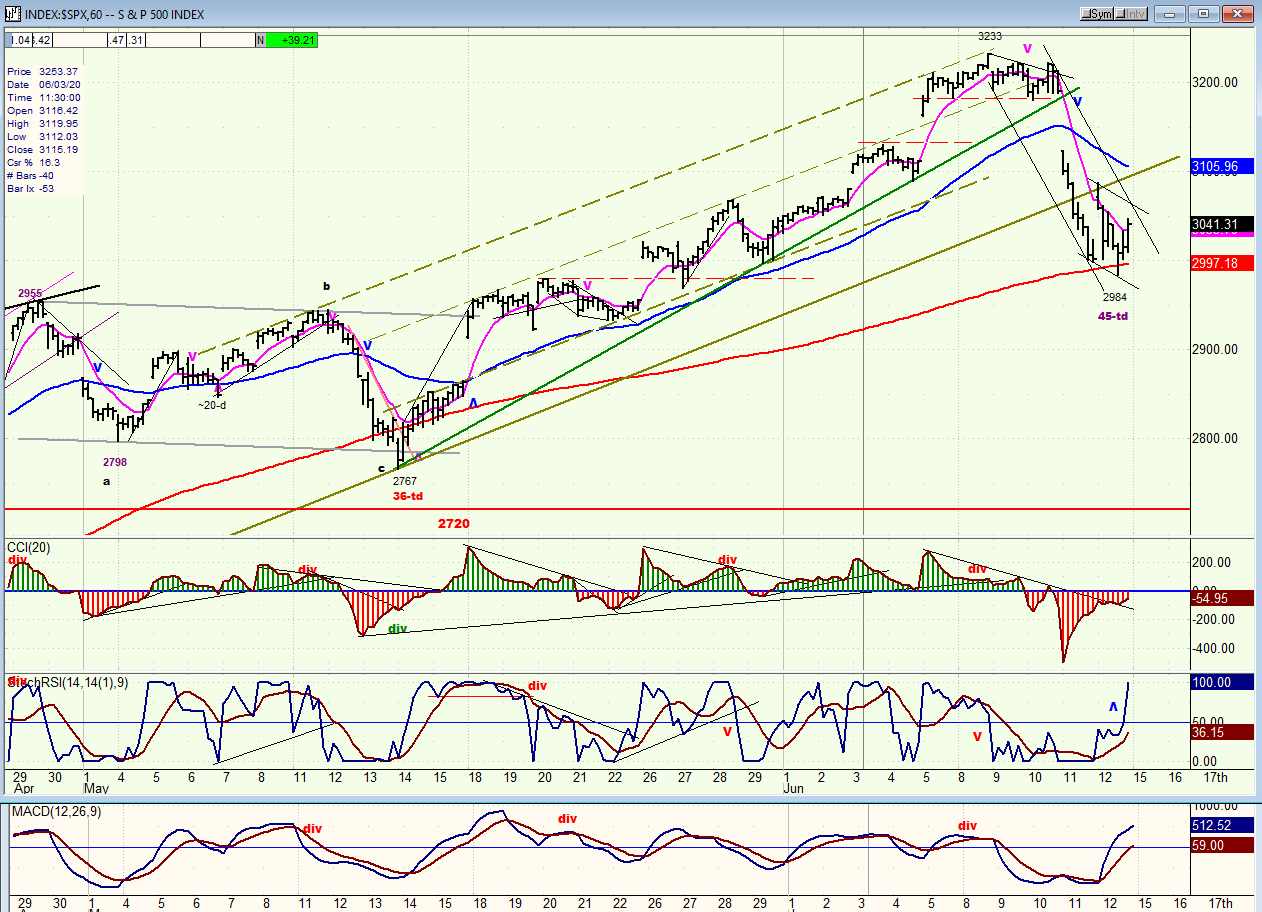
SPX hourly chart
Above, I have already discussed in detail the gyrations of SPX on Friday. The odds that we found the low of the 45-td at 2984 – which is coincidentally also the level of the 200-hr MA -- are high, even though we do not yet have a confirmed buy signal. The CCI is always a laggard and it will most likely become green on Monday.
On Monday, the index is also expected to move out of both channels drawn on the hourly chart. There is a good chance that the rally will extend to 3115 before topping, and perhaps as high as 3142. Both are Fibonacci retracement points for the decline. The P&F target could give us about 3135.
Whatever we do next week, we should probably wait for negative divergence to show in the CCI before expecting the next decline to start.
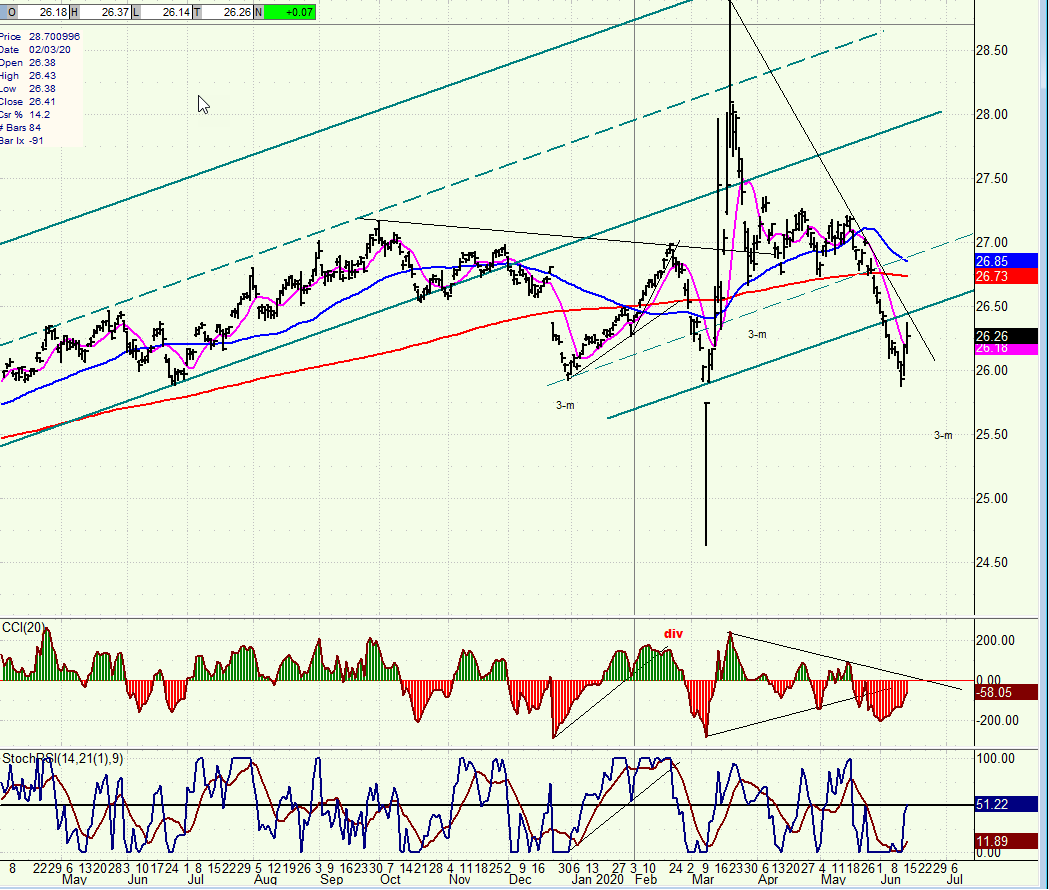
UUP (dollar ETF) daily
UUP is still about three weeks away from its 3-mo low, so this is probably a countertrend rally before the final phase of the decline.
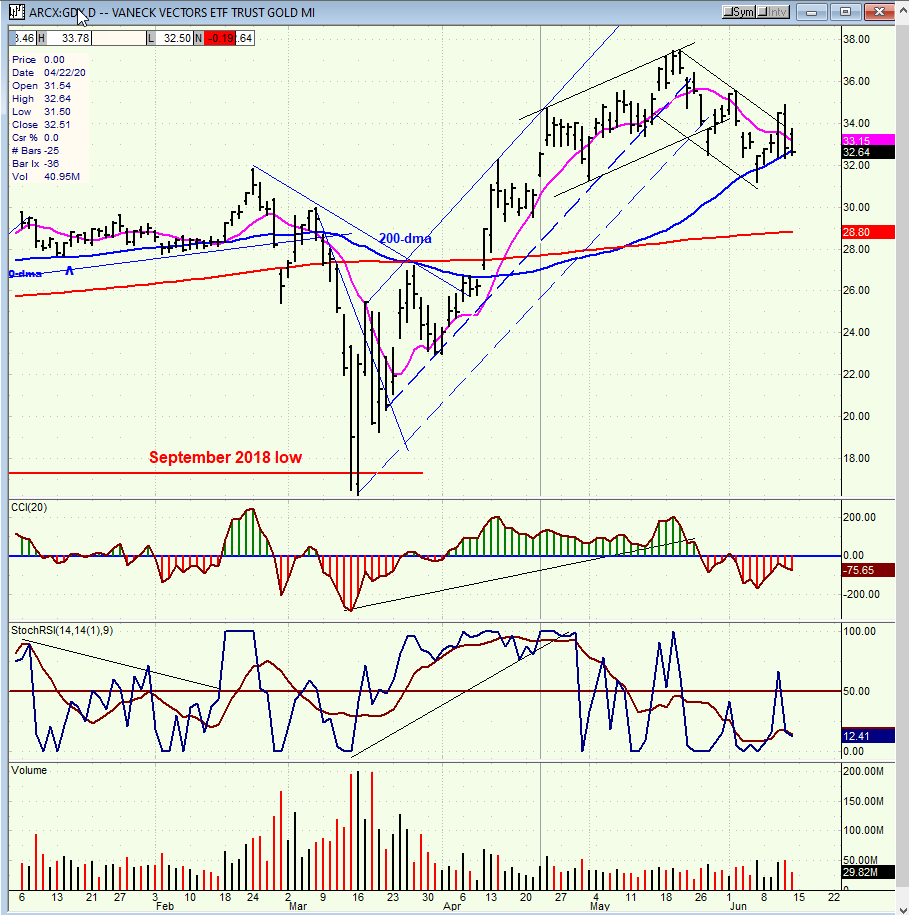
GDX (Gold miners ETF) daily
GDX has rallied off its 50-dma but retraced immediately. Since the P&F chart suggests that it should continue to decline until it reaches ~30, this is probably where it is heading before resuming its uptrend.
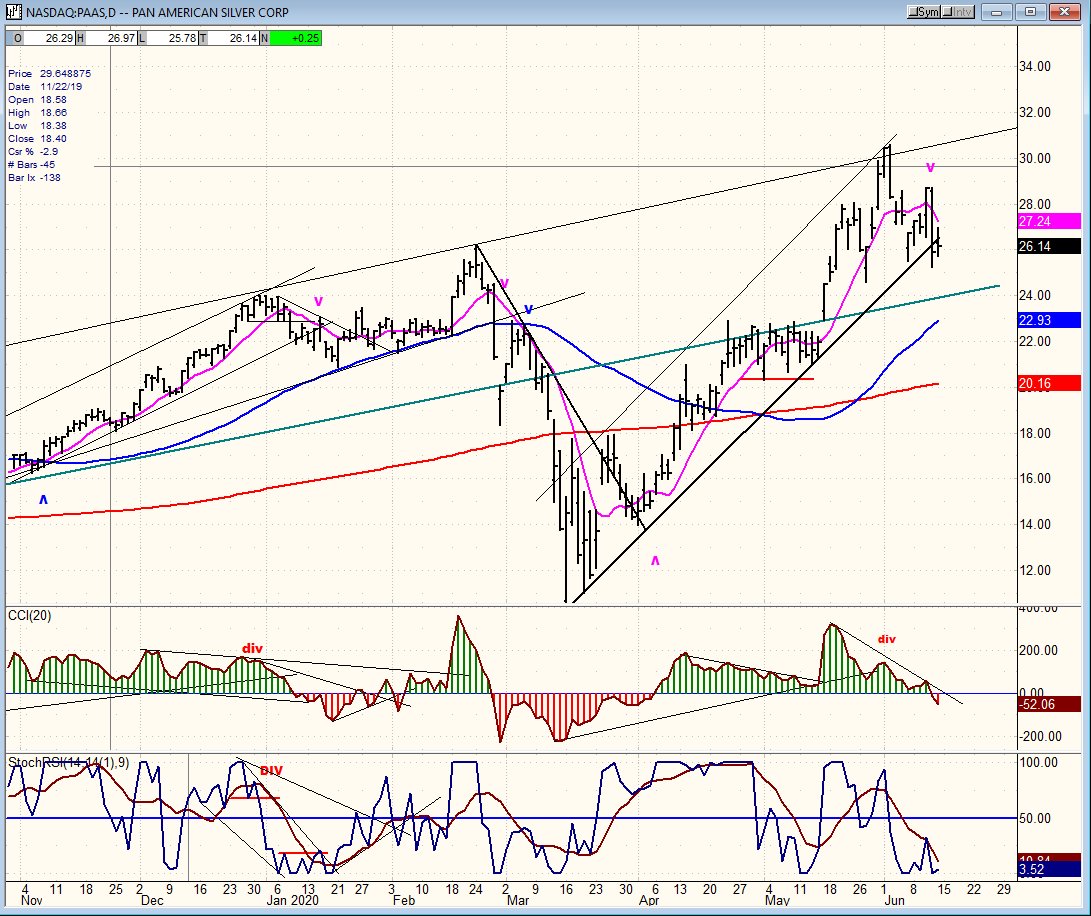
PAAS (Pan American Silver Corp.) daily
If GDX pulls back to 30 (which is likely), PAAS as its diligent follower, should come down to 23 before resuming its uptrend.
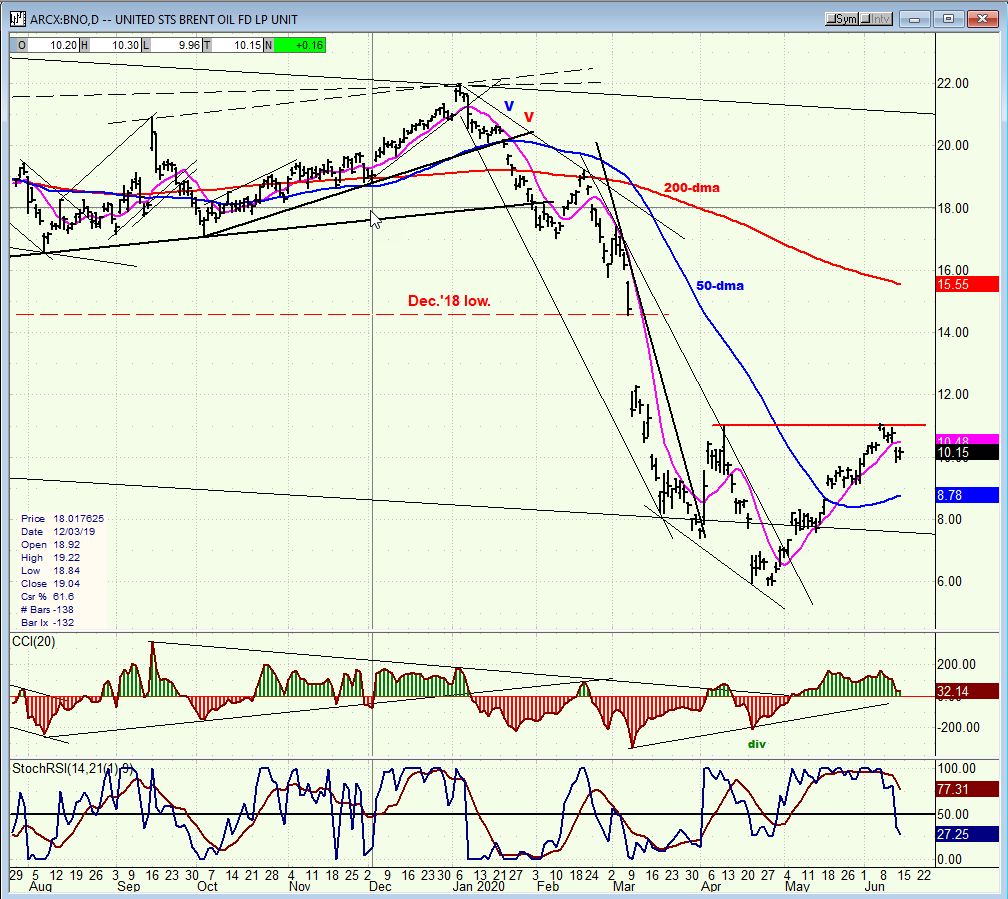
BNO (U.S. Brent oil fund) daily
BNO ended its uptrend from 6 when it touched 11. It is now beginning to correct and, assuming that the market is not yet in a bear mode, should find support around 7.50- 8.
Summary
Last week, SPX met its intermediate projection and made a total retracement of nearly 250 points. Friday was a reversal day in the other direction and the index should continue higher until it ends its countertrend rally and turns down again. Specific price levels are given above.
FREE TRIAL SUBSCRIPTION
With a trial subscription, you will have access to the same information that is given to paid subscribers, but for a limited time period. I think you will find that knowing how far a move can carry is one of the most useful benefits of this service, whether you are a trader or an investor -- especially when this price target is confirmed by reliable indicators which give advance warning of a market top or bottom. Furthermore, cycle analysis adds the all- important time element to the above price projections. For a FREE 4-week trial, further subscription options, payment plans, and for general information, I encourage you to visit my website at www.marketurningpoints.com.
The above comments about the financial markets are based purely on what I consider to be sound technical analysis principles. They represent my own opinion and are not meant to be construed as trading or investment advice, but are offered as an analytical point of view which might be of interest to those who follow stock market cycles and technical analysis.
********

When Andre Gratian was a stock broker years ago, a friend introduced him to technical analysis of the market. Consequently, it is not an exaggeration to say that Andre fell in love with this approach! Ever since then, it has become an increasingly important part of his professional life. Gratian has studied the works of Wyckoff, Edwards & Magee, Edward J. Dewey (cycles) and many others. However, one of my most profitable undertaking has probably been to study Point & Figure charting, which he finds invaluable in analyzing stocks and indices. If he were restricted to one methodology, this is the one that he would choose. This well-rounded background has given him what he feels to be a special insight into the stock market, facilitating the recognition of meaningful patterns and the ‘turning points’ in all trends, whether they be short or long term. Andre feels very comfortable discussing the stock market and passing on meaningful information to others. His subscribers include individuals and money managers throughout the world. Moreover, his Newsletters are currently published on several financial sites, here and abroad.


