Technical Analysis Of The Markets


Current Position of the Market
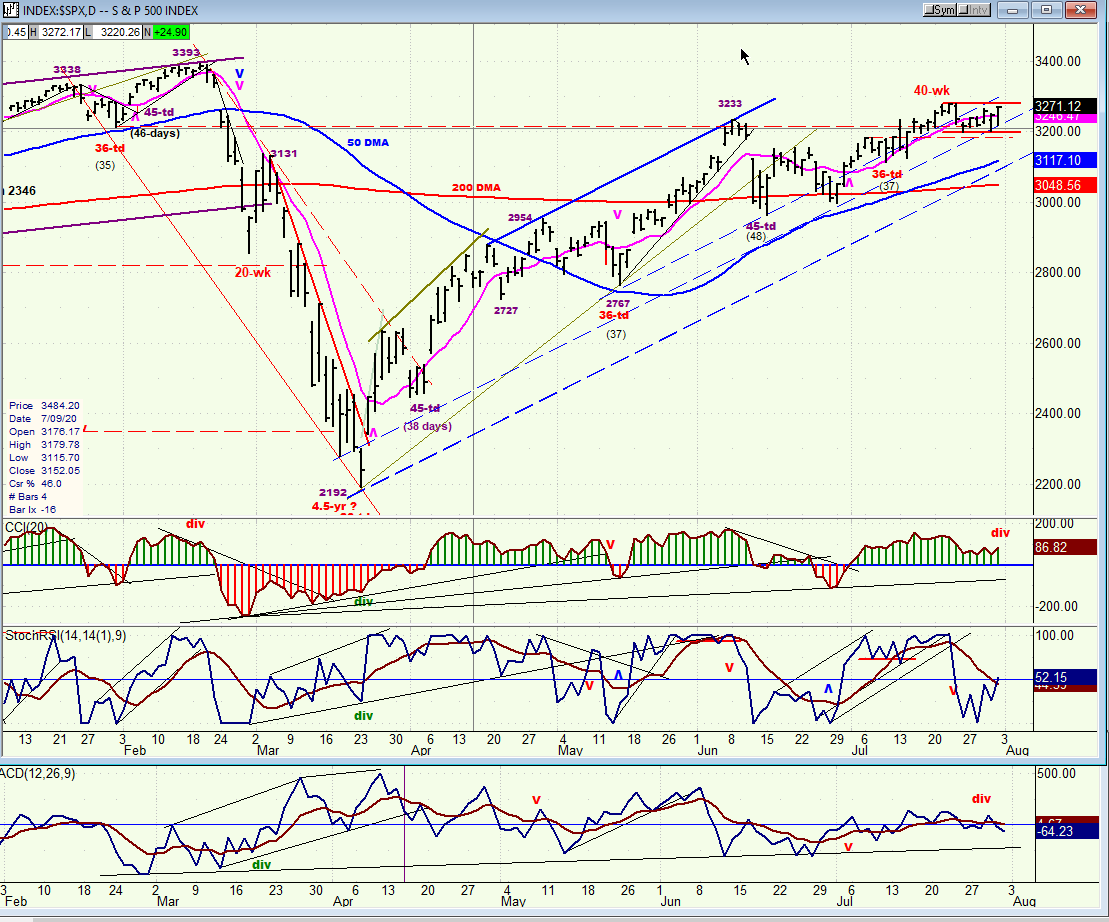
SPX Long-term trend: For now, the best guesstimate is that we are still in the bull market which started in 2009.
SPX Intermediate trend: We should be approaching an important high, with confirmation coming over the near term.
Analysis of the short-term trend is done daily with the help of hourly charts. It is an important adjunct to the analysis of daily and weekly charts which discuss longer market trends.
Uptrend Continues?
Cycle cluster ahead
45-td cycle ~8/14 – 26-day ~8/25 – 36-td ~8-31
Market Analysis (Charts courtesy of QCharts)
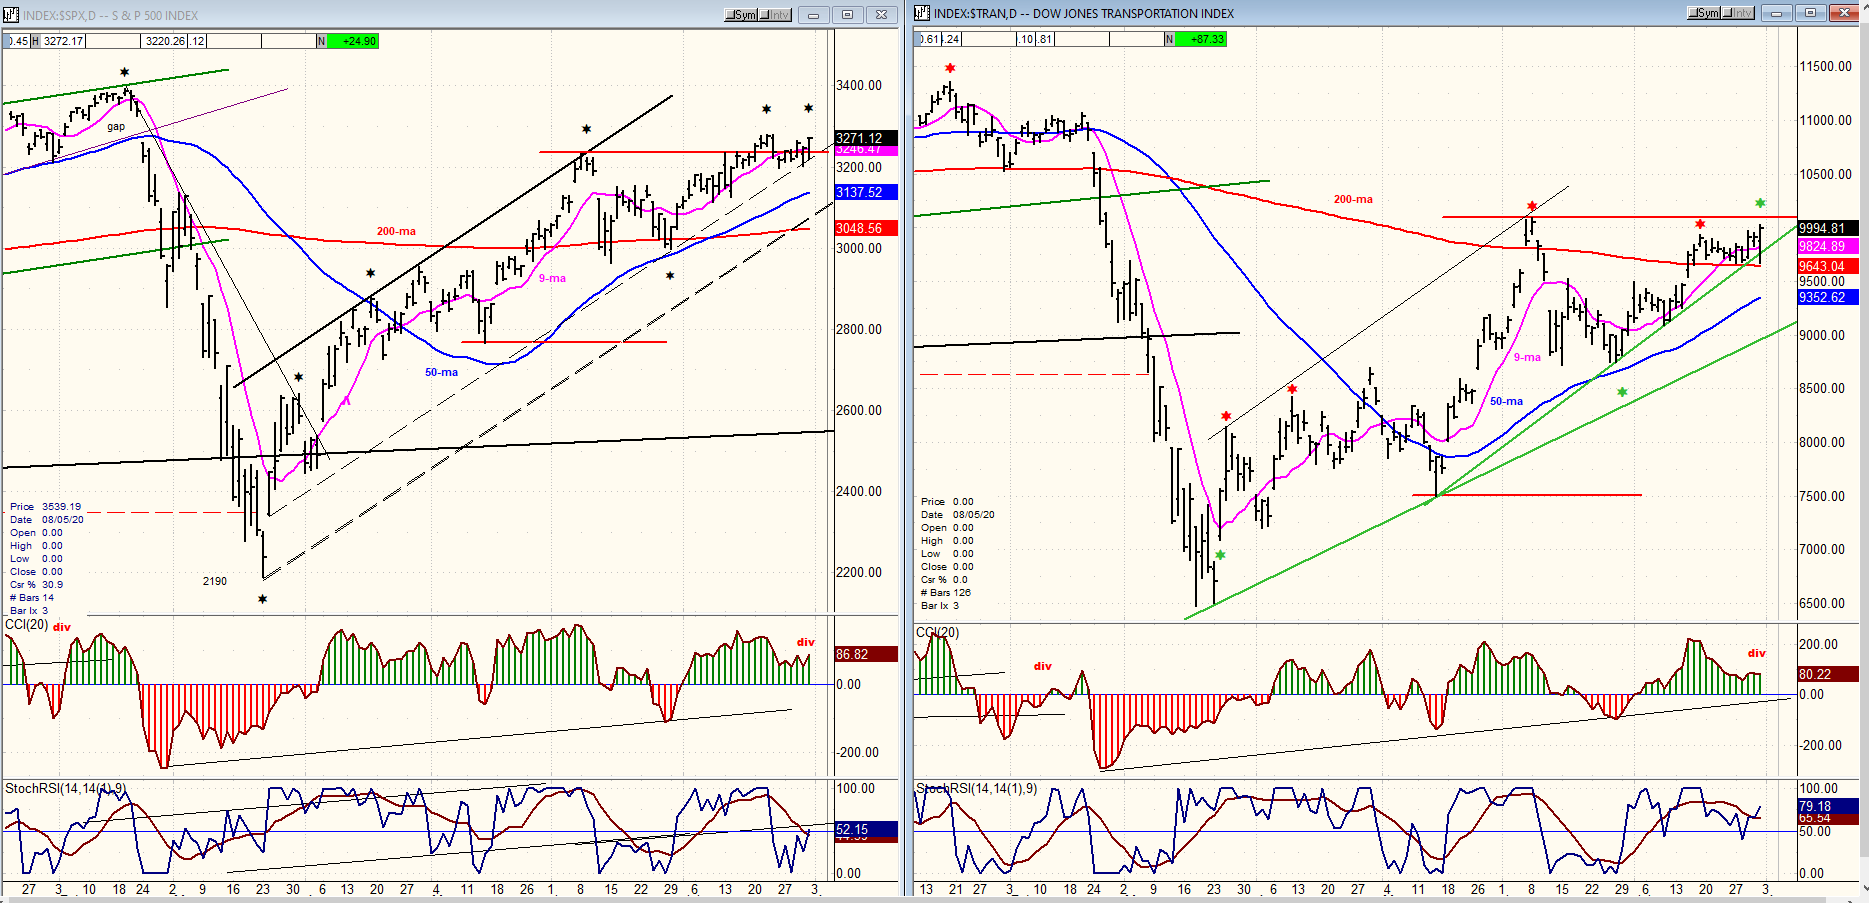
SPX- TRAN daily charts:
Both indexes continue in an uptrend from the March low with the TRAN still lagging but showing some minor relative strength (*) on Friday. This may mean that SPX could push higher next week. Note that since 6/29 both indexes have risen in a bullish structure which may be entering wave-5 from that date. When this 5th wave is complete, TRAN should signal it with a red asterisk a day or two ahead of SPX, followed by a reversal in both.
Also, the CCI of both indexes is showing negative divergence, hinting that a short-term high is near.
SPX daily chart
The 3200 SPX level is becoming important support which, after being tested several times, has held. Friday’s action suggests that we may be ready to move higher. After an important hold on Thursday in the light of a horrific economic report, on Friday the index closed strongly at the high of the trading range which was recently established above 3200. That, and the strong showing by the TRAN on Friday, can only suggest that higher prices lie directly ahead.
This is also suggested by the perception that both indexes are apparently starting their fifth and final wave from the 6/19 low. A minimum projection for this final wave is ~3320, but the index could rise as high as 3380 before completing the pattern. After this, a correction would be expected to take place into the end of the month and into the cycle cluster shown above.
The daily oscillators are confirming that we are approching the conclusion of an uptrend by exhibiting negative divergence in all three.
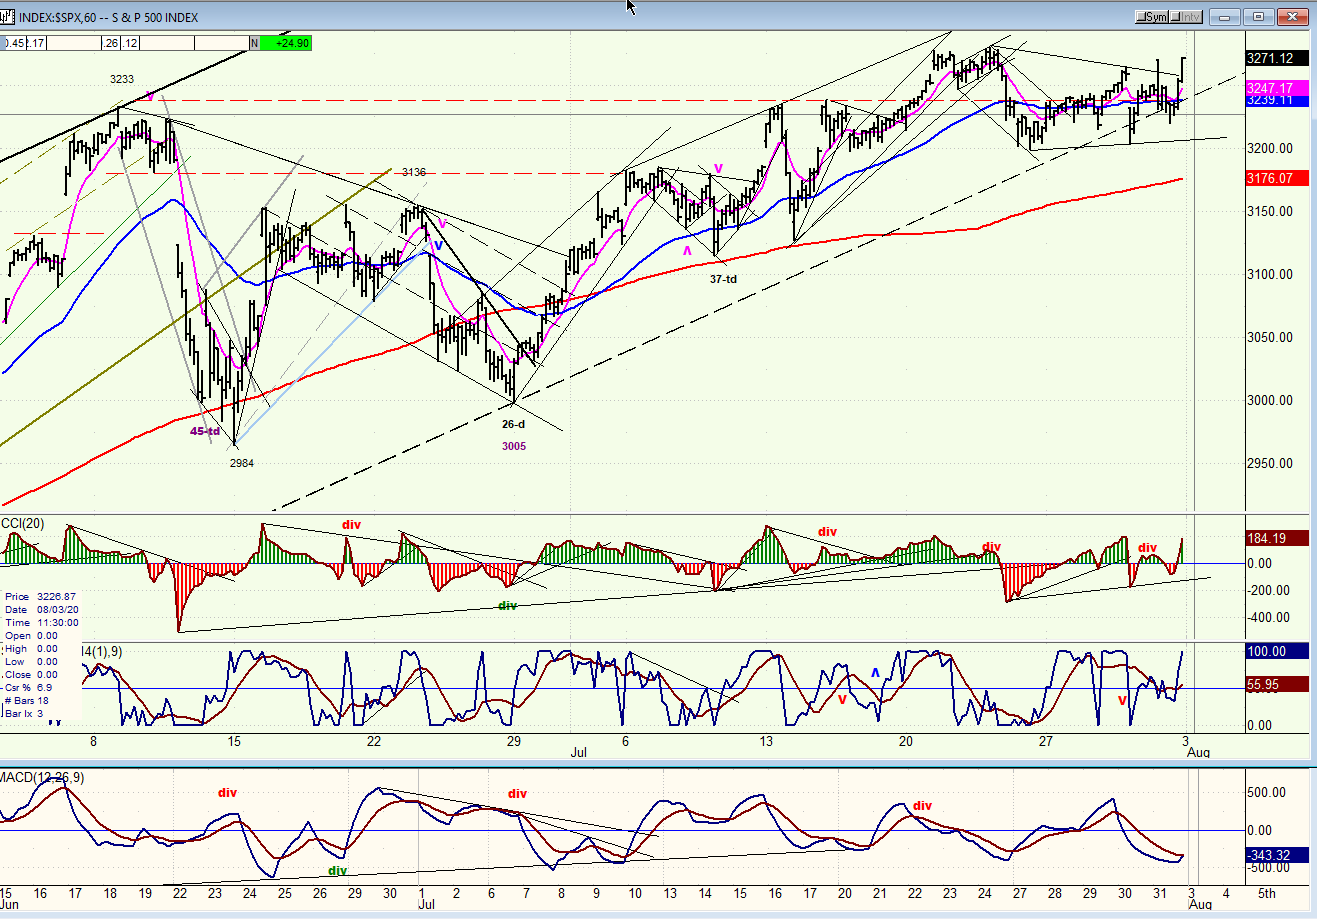
SPX hourly chart
When the index shot up in the last two hours of trading on Friday, it caused the momentum oscillators to rise sharply along with the price. This is another indication that SPX should continue higher on Monday. These oscillators display recognizable patterns at short-term highs and lows, whereby some deceleration is usually followed by negative (or positive) divergence before a reversal takes place. Since we have neither, we must assume that Friday’s move will be followed by additional appreciation next week.
The rising dashed trend line at the bottom of the chart is a parallel to the trend line connecting the tops. When this dashed line is decisively penetrated, it will be a confirmation that we have completed the wave pattern from 2984 and that we have started a correction into the cycle lows.
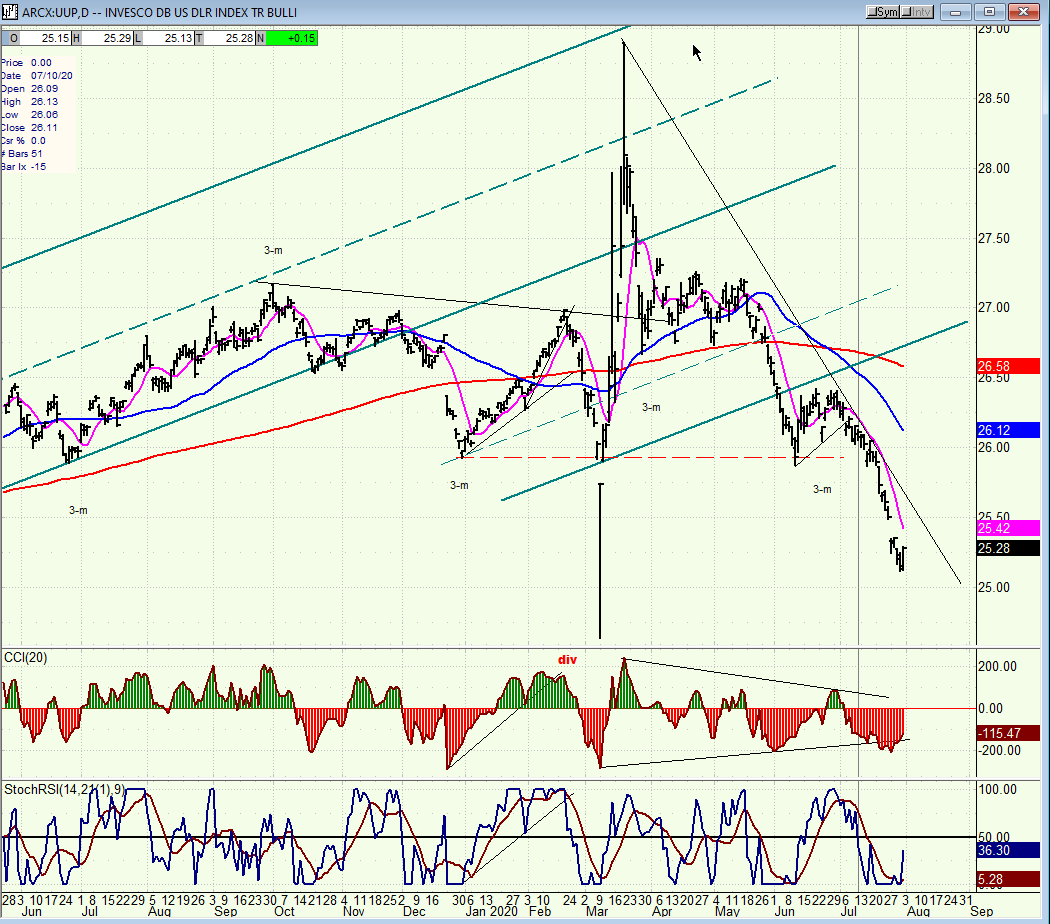
UUP (dollar ETF)
Last week, I mentioned that the dollar should reach 93 before UUP could find a low for this move. USD did indeed meet its projection of 93 last week, and this should mark a temporary low for UUP enabling it to start a consolidation phase. This also marks the completion of a 5-wave pattern from the high. A return move to about 26 is probable.
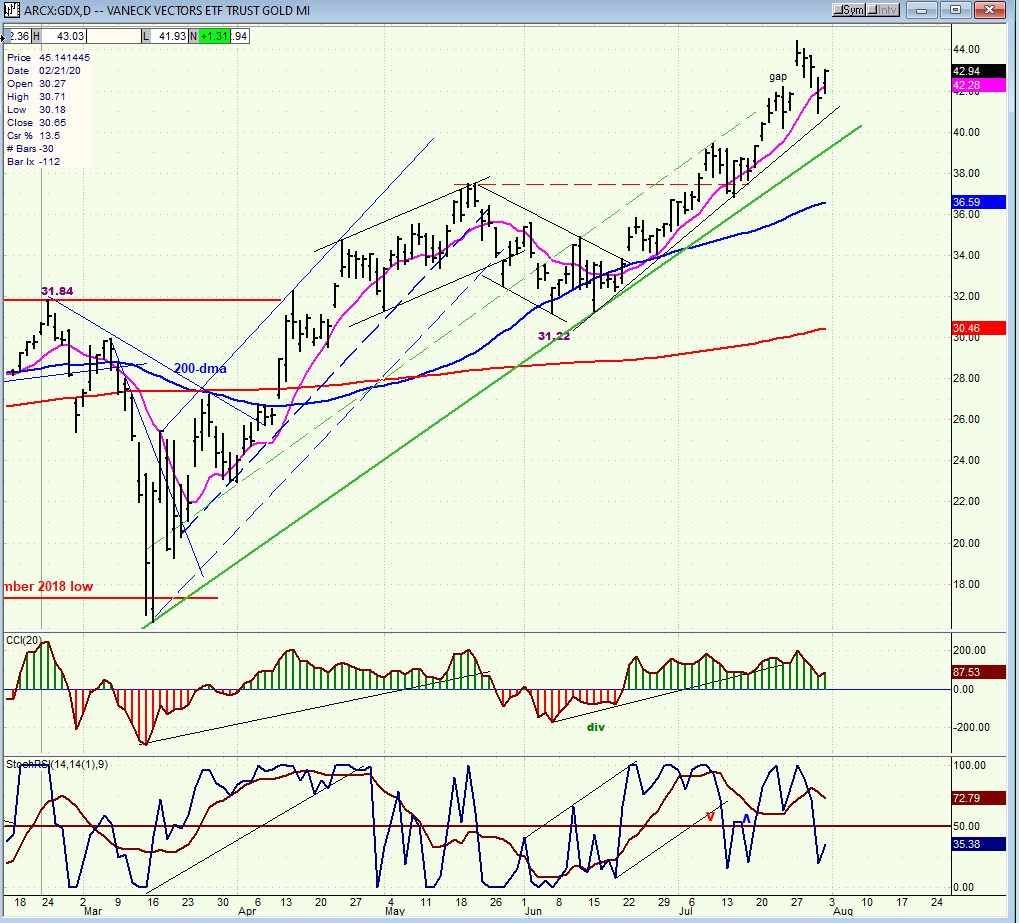
GDX (gold miners)
I had expected GDX to at least pause at about 40, which is what it did very briefly without generating a sell signal before moving on to 44.00 where it could linger slightly longer. There is no confirmed sell here either and, if none is created, the next target could be 47.
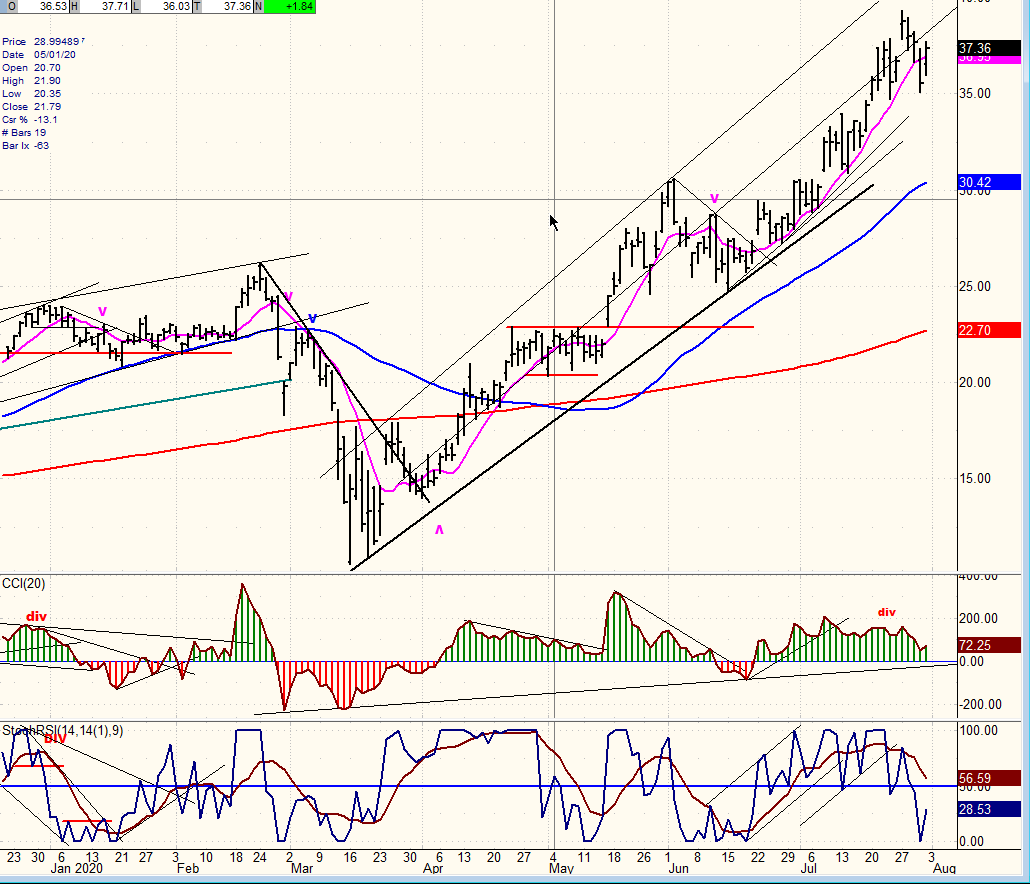
PAAS (Pan American Silver Corp)
PAAS and GDX have been moving in tandem and their price trends and oscillator patterns since 6/19 are identical, which means that PAAS has not given a confirmed sell signal either and could next move to about 44 if none is given.
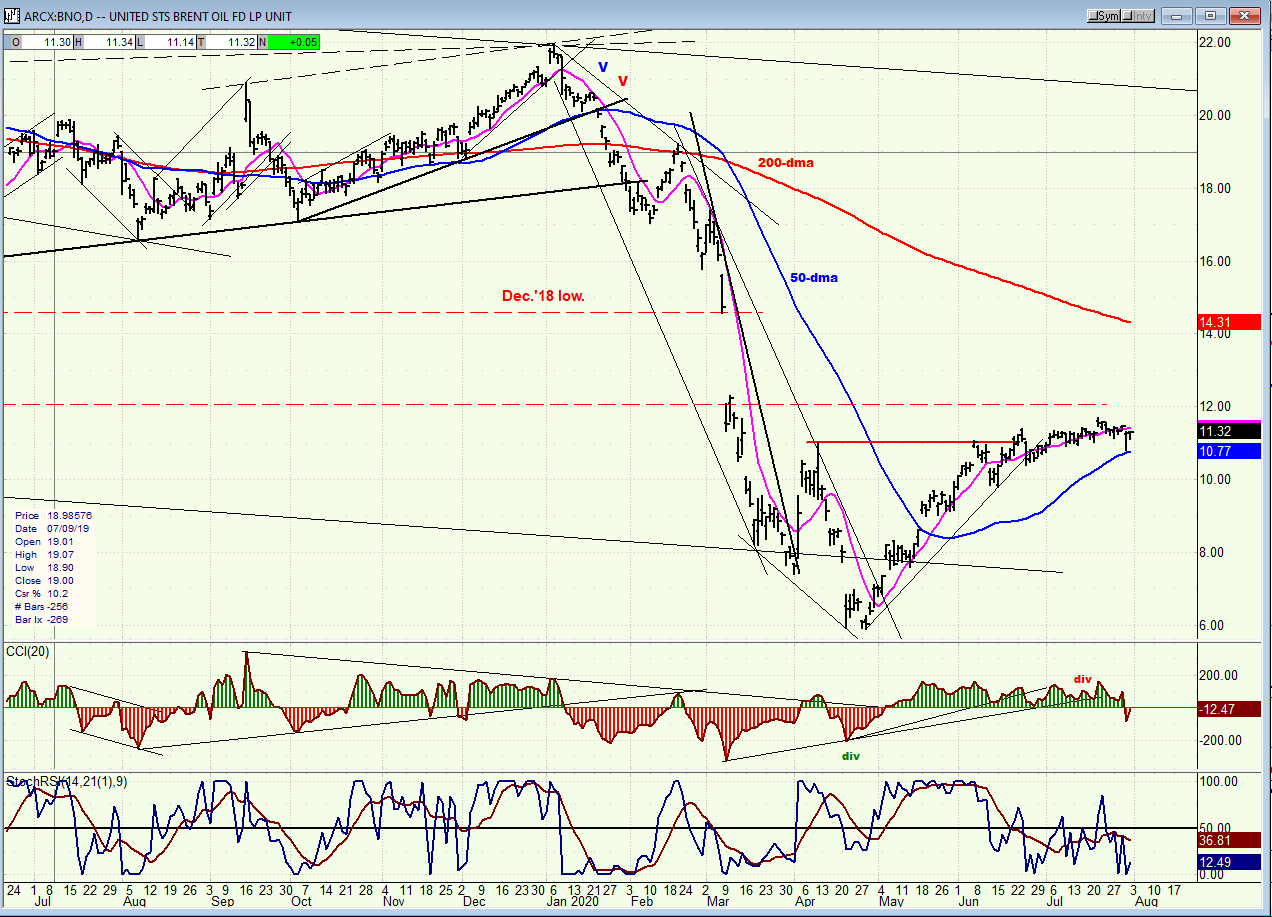
BNO (U.S. Brent Oil fund)
Last week, BNO pulled back to its 50-dma, found support, and rallied. However, its oscillators have given a sell signal which could mark the start of a correction.
Summary
SPX looks ready to complete the structure that it started building from 2965. Some time around the middle of the month would be a good time for completion before a retracement into the cycle lows.
Free trial subscription
With a trial subscription, you will have access to the same information that is given to paid subscribers, but for a limited time period. Over the years, I have developed an expertise in P&F charting (price projection), cycles (timing), EWT (structure), and general technical analysis which enables me to warn subscribers of pending reversals in market trends and how far that trend can potentially carry. For a FREE 4-week trial, subscription options and payment plans, I encourage you to visit my website at www.marketurningpoints.com.
The above comments and those made in the daily updates and the Market Summary about the financial markets are based purely on what I consider to be sound technical analysis principles. They represent my own opinion and are not meant to be construed as trading or investment advice but are offered as an analytical point of view which might be of interest to those who follow stock market cycles and technical analysis.
*********

When Andre Gratian was a stock broker years ago, a friend introduced him to technical analysis of the market. Consequently, it is not an exaggeration to say that Andre fell in love with this approach! Ever since then, it has become an increasingly important part of his professional life. Gratian has studied the works of Wyckoff, Edwards & Magee, Edward J. Dewey (cycles) and many others. However, one of my most profitable undertaking has probably been to study Point & Figure charting, which he finds invaluable in analyzing stocks and indices. If he were restricted to one methodology, this is the one that he would choose. This well-rounded background has given him what he feels to be a special insight into the stock market, facilitating the recognition of meaningful patterns and the ‘turning points’ in all trends, whether they be short or long term. Andre feels very comfortable discussing the stock market and passing on meaningful information to others. His subscribers include individuals and money managers throughout the world. Moreover, his Newsletters are currently published on several financial sites, here and abroad.


