Technical Analysis Of The Markets


Current Position of the Market
SPX Long-term trend: For now, the best guesstimate is that we are still in the bull market which started in 2009.
SPX Intermediate trend: We should be approaching an important high, with confirmation coming over the near term.
Analysis of the short-term trend is done daily with the help of hourly charts. It is an important adjunct to the analysis of daily and weekly charts which discuss longer market trends.
Correction Approaching
P&F target for near-term top: 3365/3390
Cycle cluster ahead: 45-td cycle ~8/14 – 26-day ~8/25 – 36-td ~8-31
Market Analysis (Charts courtesy of QCharts)
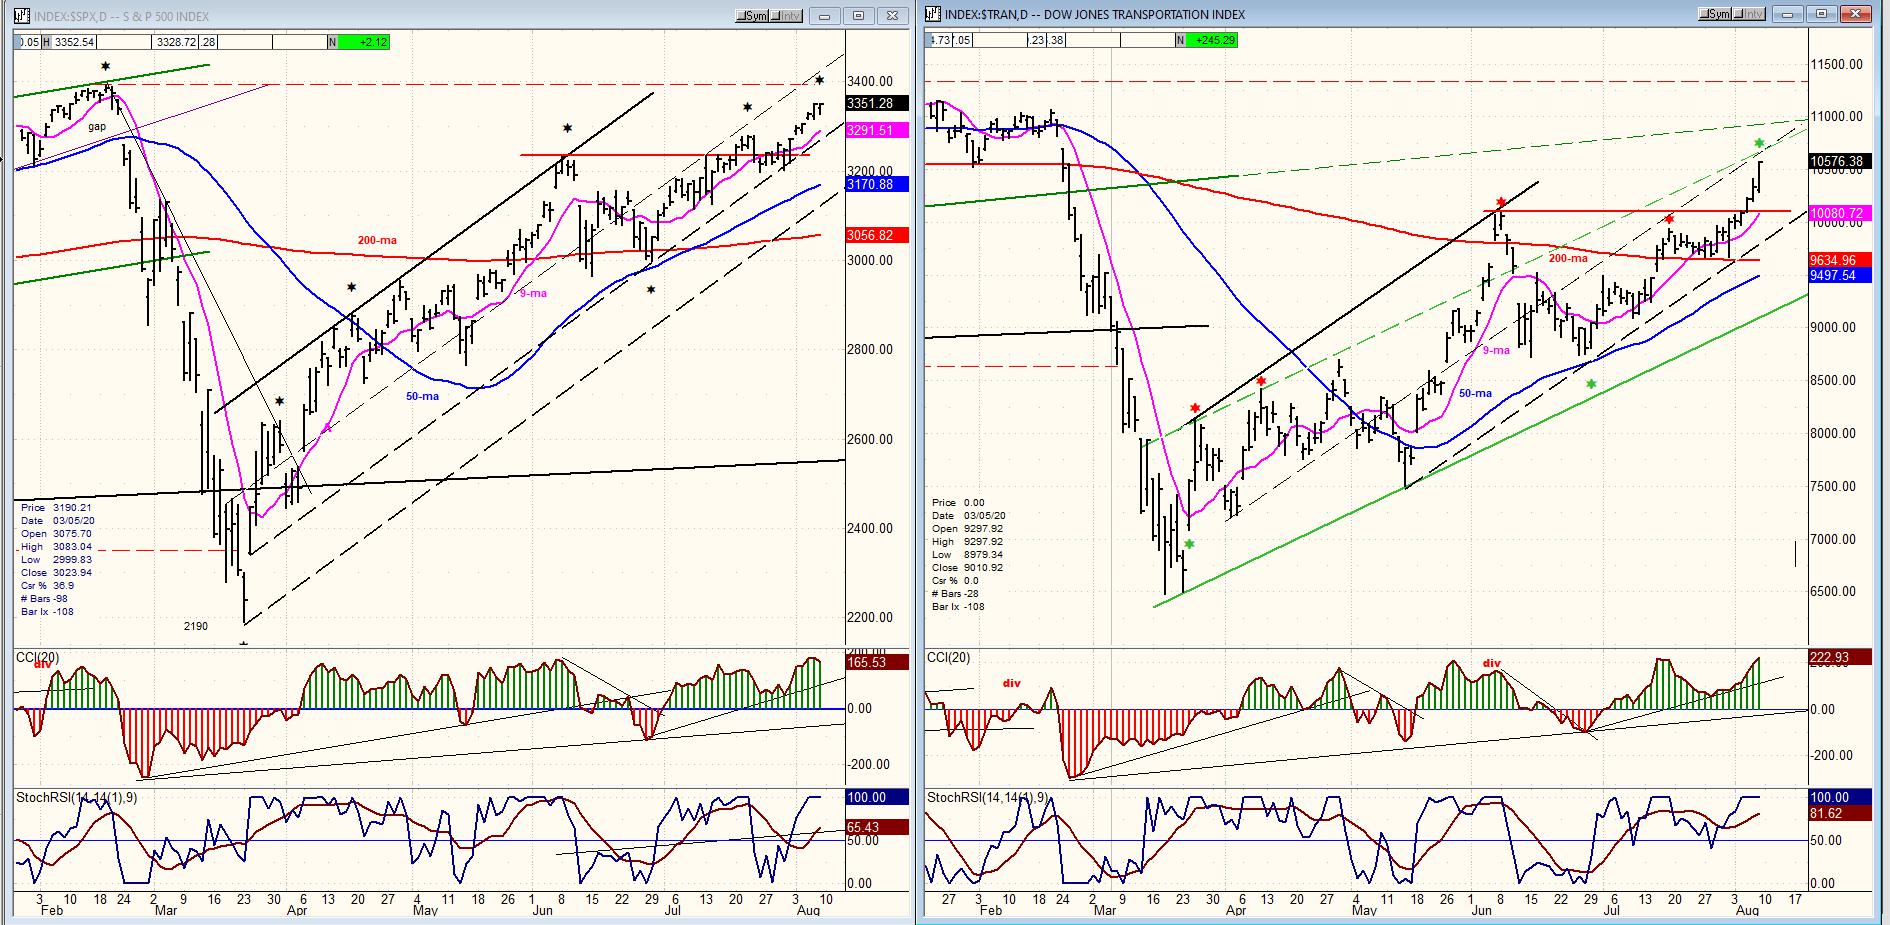
SPX- TRAN daily charts:
For the first time since the March low, TRAN is displaying some clear short-term relative strength vis-à-vis the SPX. It remains well behind on an intermediate basis, but this short-term surge may have some interesting implications for the market trend if it persists.
During the early phase of the bull market of 2009, TRAN took the lead but soon fell in step with SPX until August 2018. After that date, it started to diverge significantly, implying that a correction was coming. It is too soon to determine what this short-term positive divergence signifies. Let’s see where it leads us.
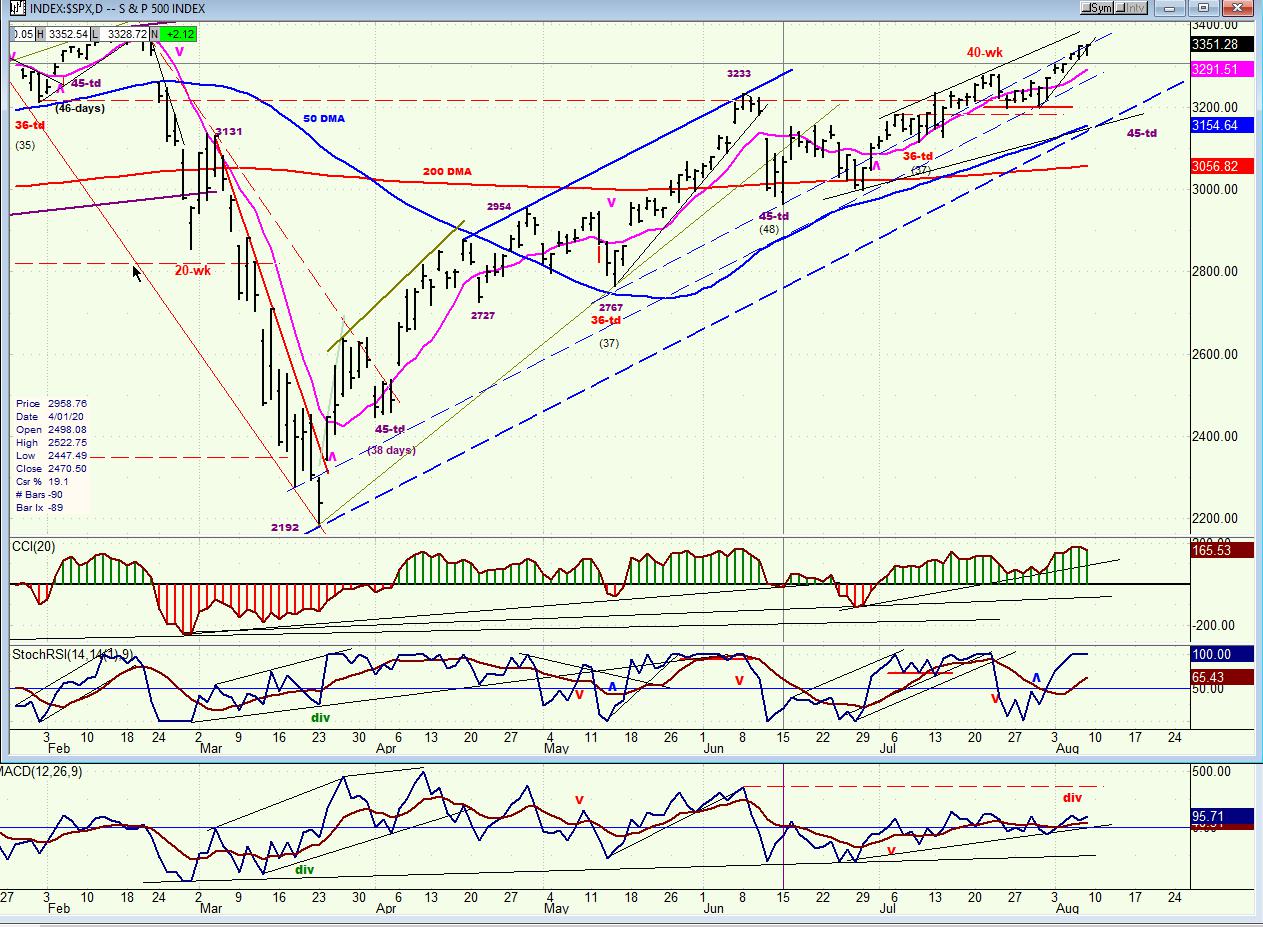
SPX daily chart
We are quickly approaching the low of the 45-td cycle. This means that the next few days should be marked by a price reversal and, because of the extreme right translation of this cycle, a quick drop is likely when the projection target has been reached. The high could come between 3360 and 3390, or even push higher to 3430.
There are additional cycles bottoming after this one, forming a cluster of lows which could create a two or three-week correction before the index continues its uptrend. By making new highs, the momentum indicators have lost the mild negative divergence which had developed about three weeks earlier. The A-Ds, however, have been diverging since June, the date when the last correction occurred. The CCI went on to make a new high, but the A-D oscillator has remained below its June peak, since.
A normal correction should take us down to between 3015 and 2905.
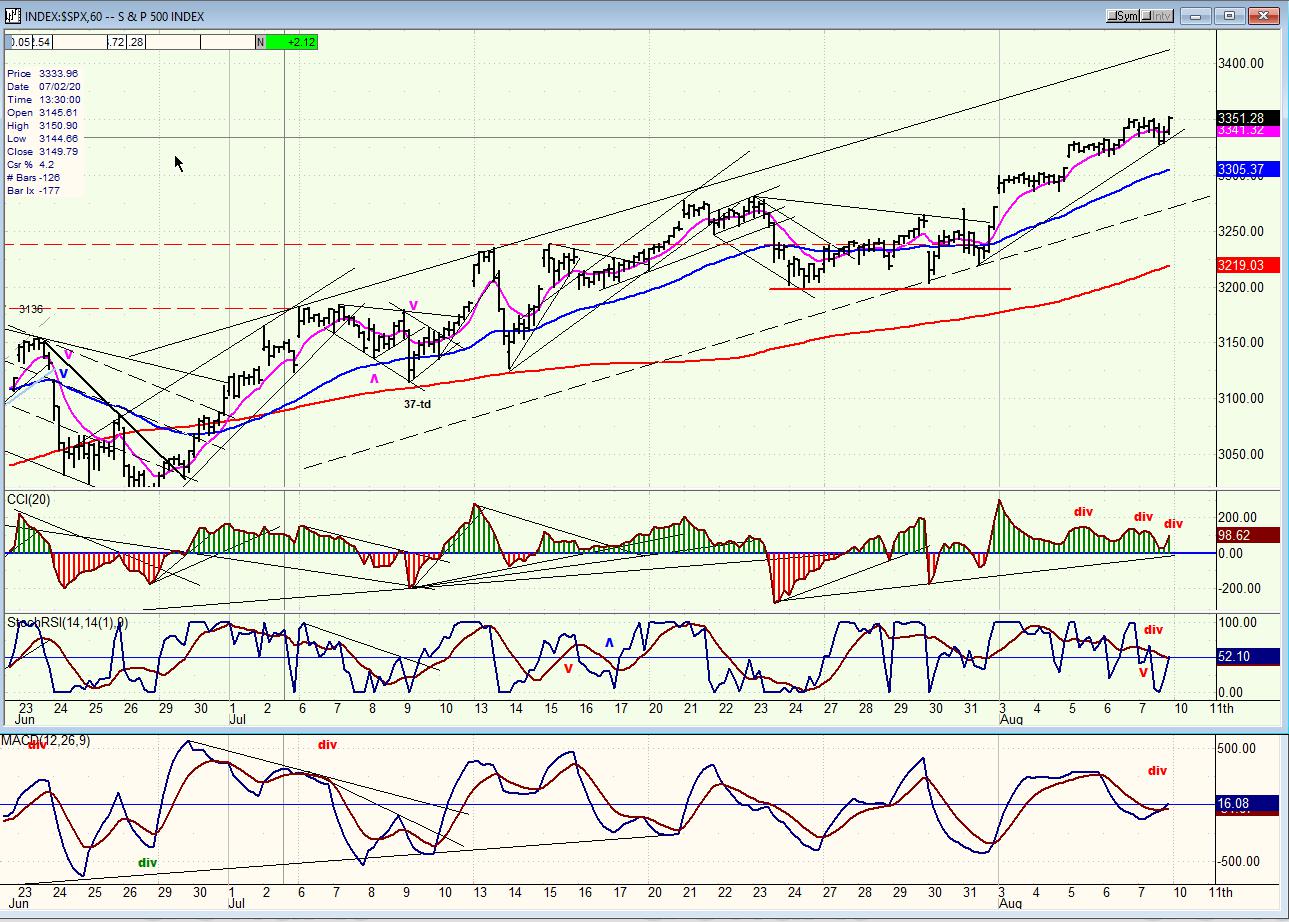
SPX hourly chart
The hourly chart oscillators, in contrast to the daily ones, are riddled with negative divergence which call for an imminent reversal, although it is not certain that we will make the final high immediately. There could be one more minor pull-back before the final high. Also, the ideal date for the high comes around the end of next week, but this is not assured either. I thought that the high would come with a rally into the announcement that a compromise had been met for the next relief bill. I am not sure what kind of a market reaction can be expected from Trump’s Saturday afternoon executive action since it falls far short of what a relief bill would have provided.
Technically, because of the hourly negative divergences, it would make sense to have a minor retracement followed by the final rally. The target was derived from the count provided by the P&F version of the last consolidation, above the heavy red line. But this is actually a confirmation of the same count appearing at a lower level, which gives it more credibility.
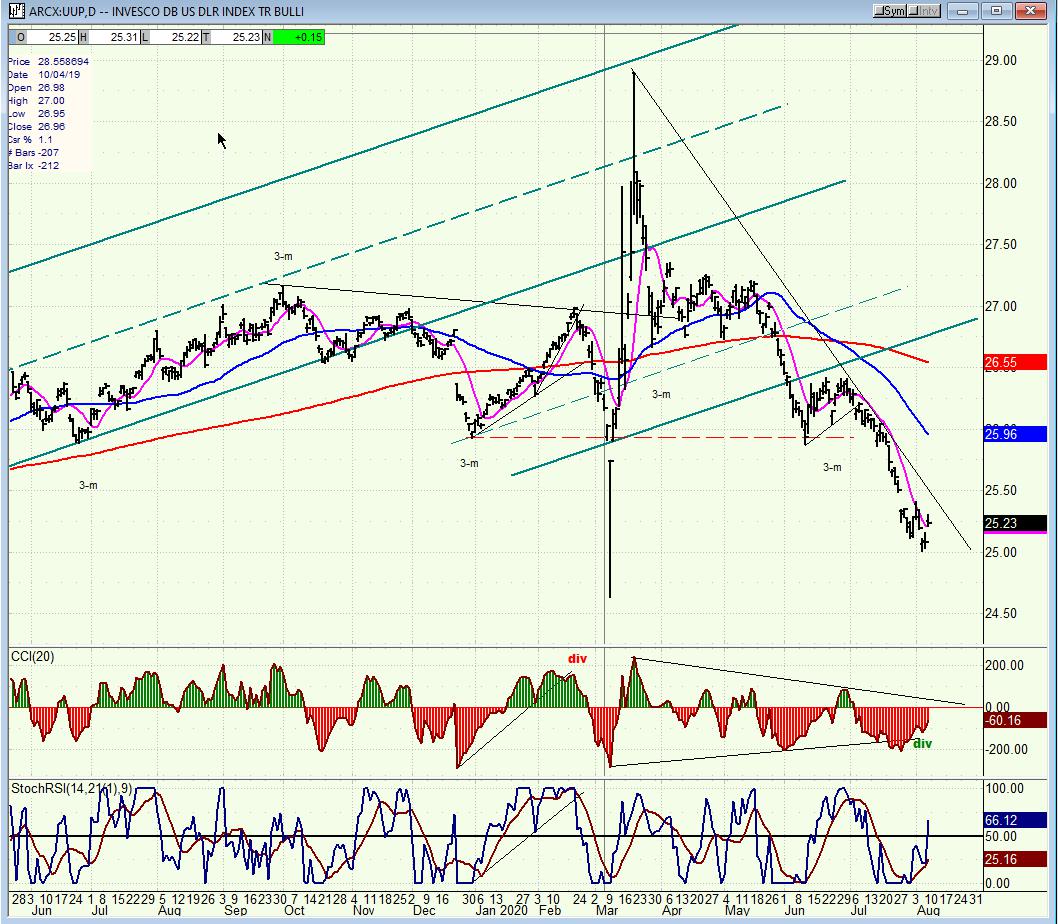
UUP (dollar ETF)
UUP made a slightly lower low in conjunction with $USD (which did not exceed its 93 downside-target), and is making a little consolidation pattern similar to the one being made by UUP). The lower low in UUP created positive divergence in the oscillators followed by a preliminary buy signal. We can therefore deduce that UUP is starting to reverse its downtrend. If so, we should get a confirmation by next week.
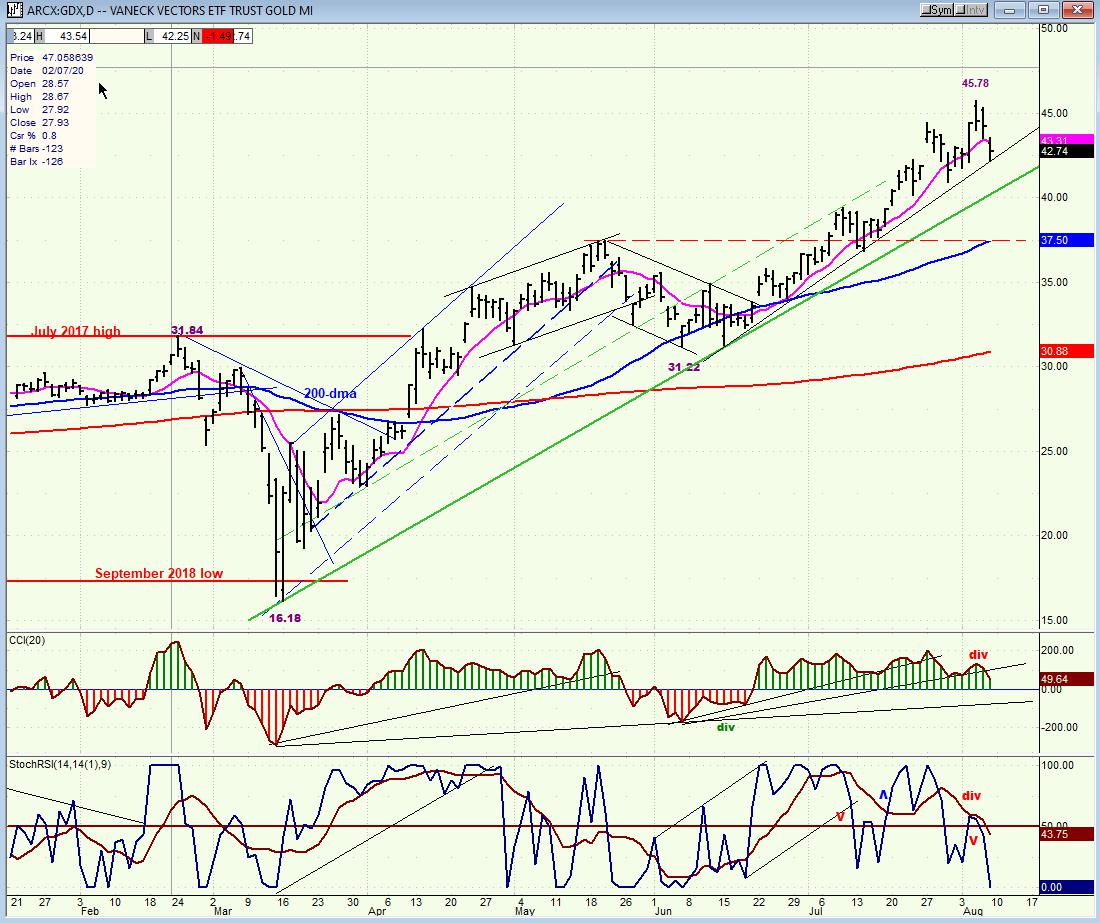
GDX (gold miners)
GDX, which had given me a conservative count of about 40, has gone a little beyond 45 and is probably trying for 47, but it may finally be calling it quits for the moment. It has given a preliminary sell signal which will be fully confirmed if it continues to drop right away, breaks its secondary trend-line and sends the CCI into the red. Since UUP seems ready to give a buy signal, it would coincide with a short-term sell signal in GDX. A more consequential sell signal would trigger if the main trend line is broken. Since the topping formation is still in progress, there is no valid P&F downside projection.
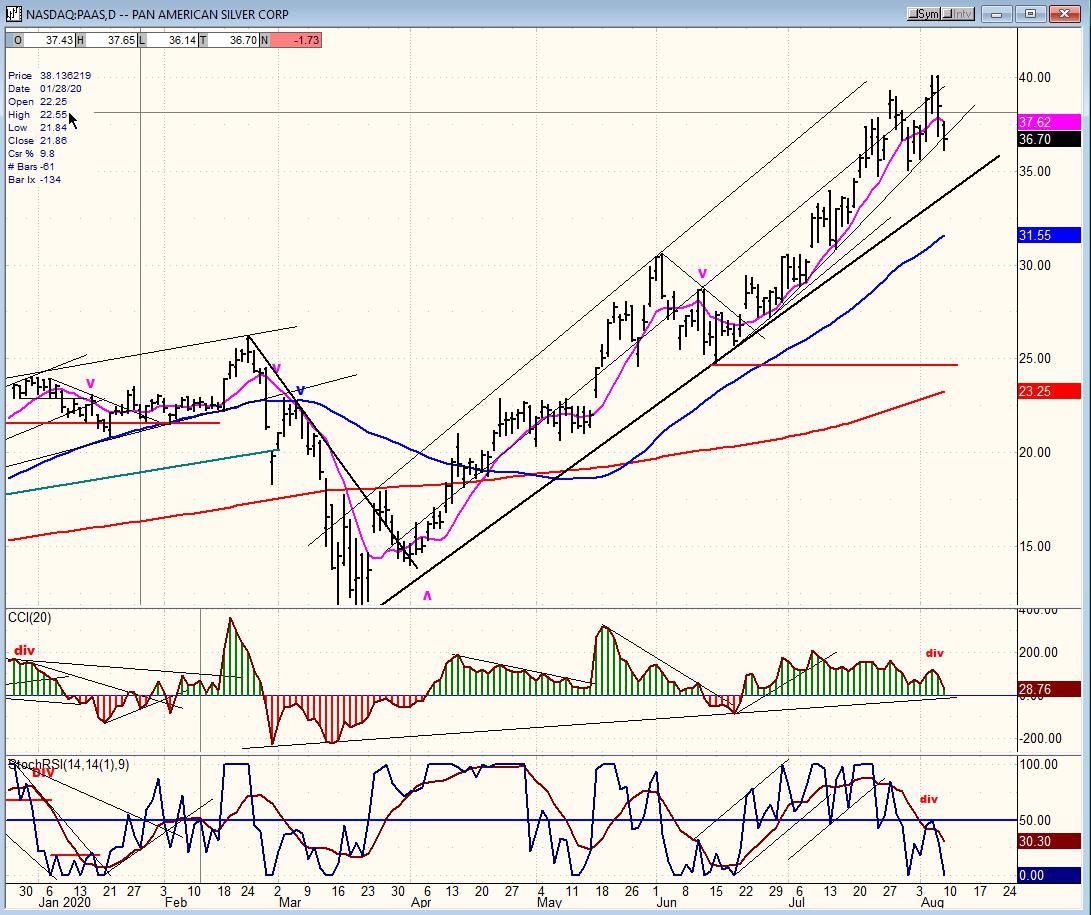
PAAS (Pan American Silver Corp)
PAAS is in the same relative technical position as GDX and is probably not ready for an important correction until it breaks below its primary trend line, followed by a break of the 50-dma. That risk does not appear to be imminent while additional upside progress is still possible over the near term. Long term, both have much higher price targets.
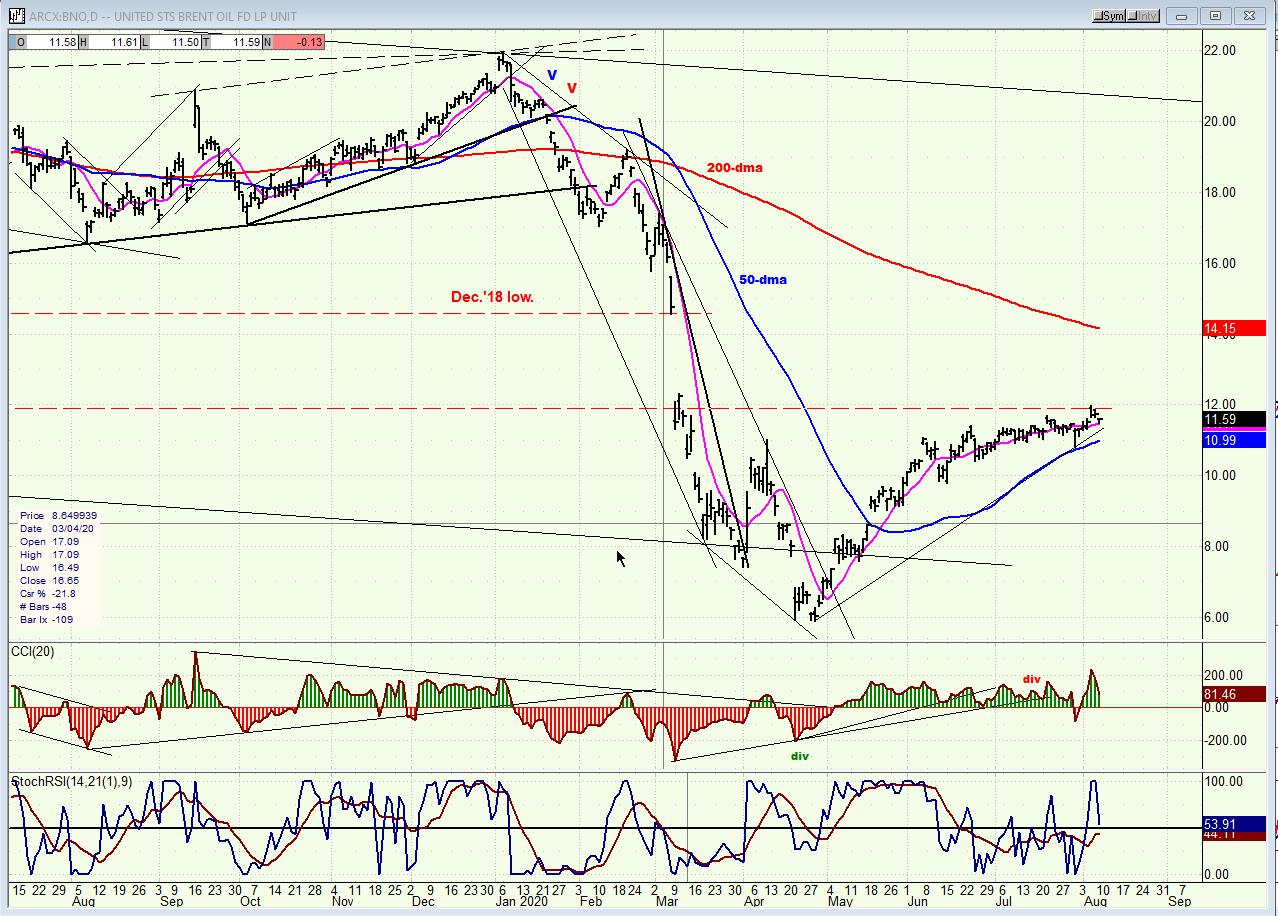
BNO (U.S. Brent Oil fund)
BNO is currently hovering between support from the 50-dma and resistance from the June 2017 low. With its current P&F “base”, it could extend its move to ~14, but would have to create a larger accumulation pattern to be able to extend its uptrend higher.
Summary
“SPX looks ready to complete the structure that it started building from 2965. Some time around the middle of the month would be a good time for completion before a retracement into the cycle lows.” We are getting closer to the cycle cluster which lies directly ahead as well as the price target for this move. These conditions should result in a two to three-week correction which could start by the end of the coming week.
Free trial subscription
With a trial subscription, you will have access to the same information that is given to paid subscribers, but for a limited time-period. Over the years, I have developed an expertise in P&F charting (price projection), cycles (timing), EWT (structure), and general technical analysis which enables me to warn subscribers of pending reversals in market trends and how far that trend can potentially carry. For a FREE 4-week trial, subscription options and payment plans, I encourage you to visit my website at www.marketurningpoints.com.
The above comments and those made in the daily updates and the Market Summary about the financial markets are based purely on what I consider to be sound technical analysis principles. They represent my own opinion and are not meant to be construed as trading or investment advice but are offered as an analytical point of view which might be of interest to those who follow stock market cycles and technical analysis.
********

When Andre Gratian was a stock broker years ago, a friend introduced him to technical analysis of the market. Consequently, it is not an exaggeration to say that Andre fell in love with this approach! Ever since then, it has become an increasingly important part of his professional life. Gratian has studied the works of Wyckoff, Edwards & Magee, Edward J. Dewey (cycles) and many others. However, one of my most profitable undertaking has probably been to study Point & Figure charting, which he finds invaluable in analyzing stocks and indices. If he were restricted to one methodology, this is the one that he would choose. This well-rounded background has given him what he feels to be a special insight into the stock market, facilitating the recognition of meaningful patterns and the ‘turning points’ in all trends, whether they be short or long term. Andre feels very comfortable discussing the stock market and passing on meaningful information to others. His subscribers include individuals and money managers throughout the world. Moreover, his Newsletters are currently published on several financial sites, here and abroad.
More from Gold-Eagle


