Technical Analysis Of The Markets


Current Position of the Market
SPX Long-term trend: For now, the best guesstimate is that we are still in the bull market which started in 2009.
SPX Intermediate trend: We should be approaching an important high, with confirmation coming over the near term.
Analysis of the short-term trend is done daily with the help of hourly charts. It is an important adjunct to the analysis of daily and weekly charts which discuss longer market trends.
Continued Topping Behavior
P&F target for near-term top: 3365/3390 (projection met)
Cycle cluster ahead: 45-td cycle ~8/18, 26-day ~8/25, 36-td ~8-31
Market Analysis (Charts courtesy of QCharts
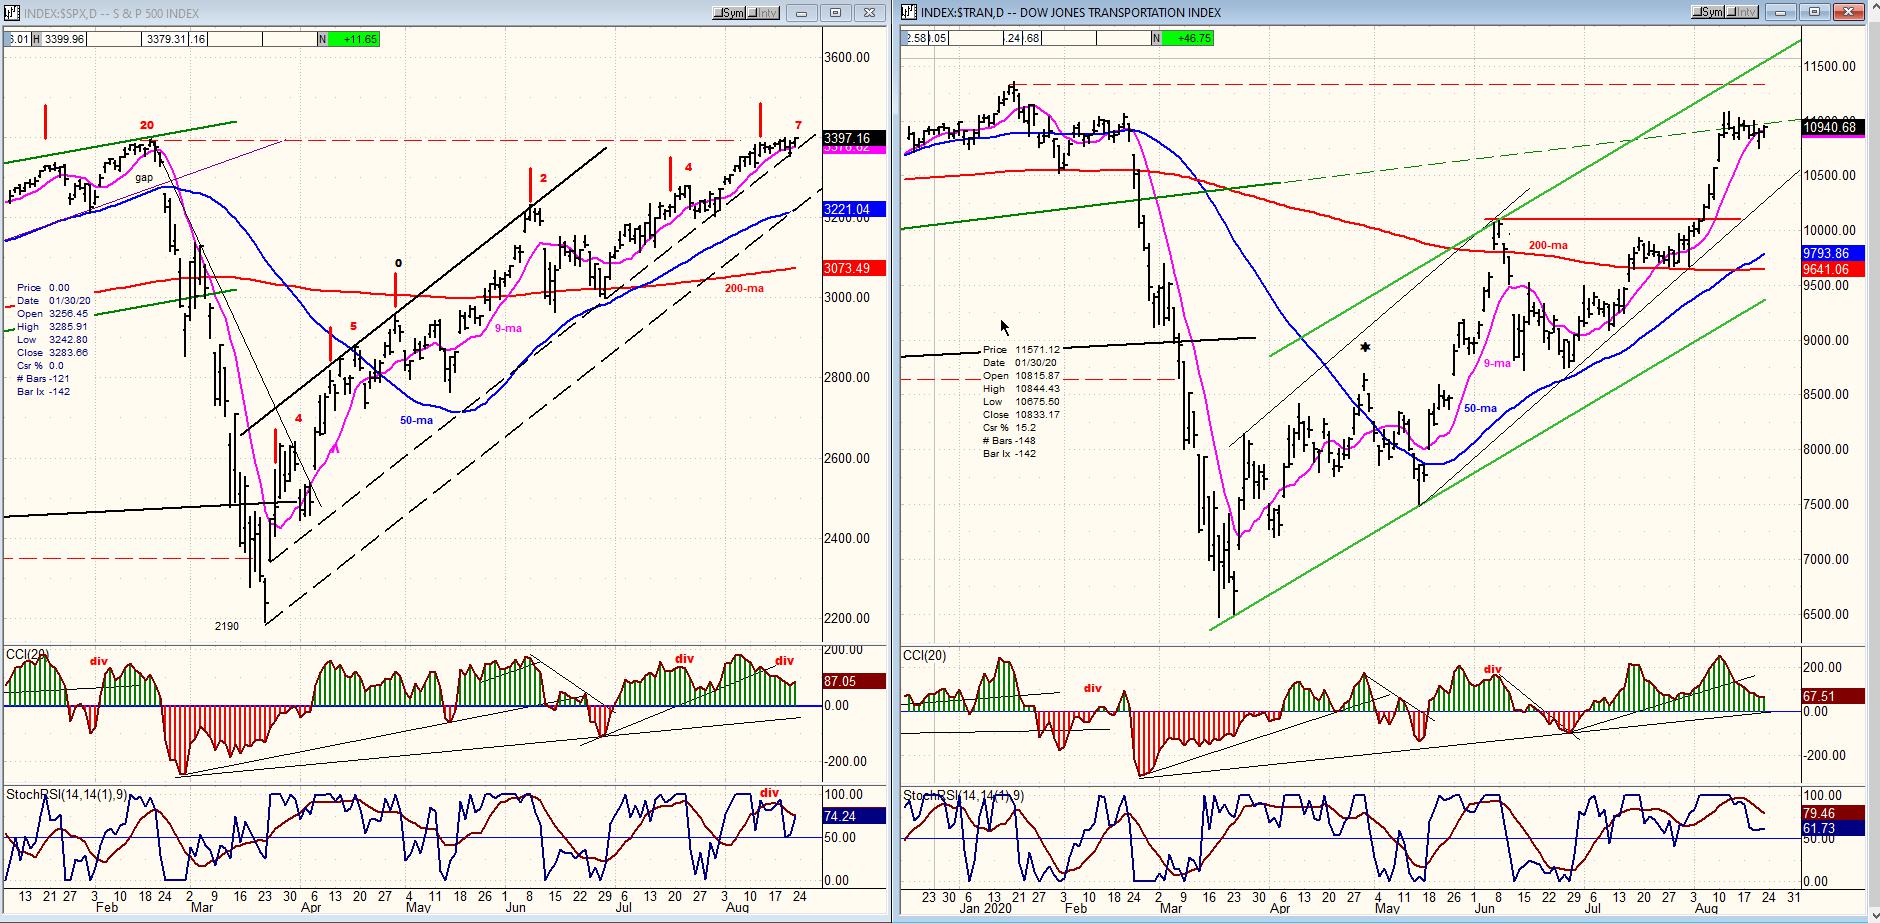
SPX-TRAN daily charts:
I have sought to make clearer the divergences warning of a top between the TRAN and SPX by marking on the SPX chart with a red vertical line, the dates on which TRAN made its high, followed by a number indicating how many days elapsed before the SPX high. Since the March low, only once (4/29) did their tops coincide, time wise. We are again forming another top with the TRAN having reached its high 7 days ago, while SPX made a new all-time high on Friday. If history is a valid precedent, we should see SPX reverse soon.
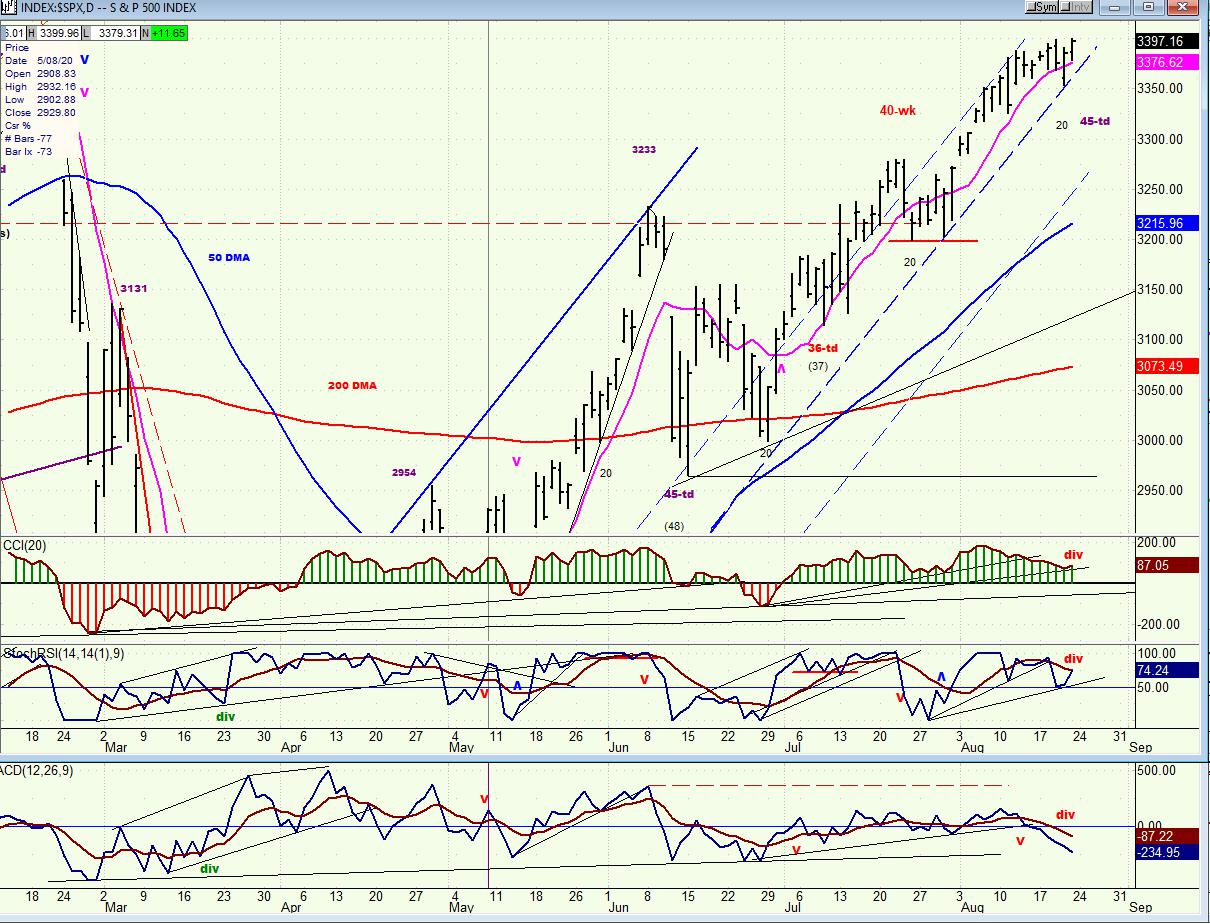
SPX daily chart
On Wednesday, a minor top was followed by a two-day decline of 45 points with an immediate rally to a new all-time high on Friday, but by the smallest of margins. I had expected two cycles to bottom in this time frame, and originally thought that both had made their lows, but I was reminded that the larger of the two was probably still ahead of us, which makes sense because, being larger, it should bring about a deeper correction. This would logically occur early next week and also be brief since the cycle is already extended. If we do not touch 3400 (on Friday we reached 3399.96), we could have a quick drop of 60-80 points before the next rebound. If, however, 3400 is touched, it could curtail the extent of the next dip.
It is not clear precisely what comes after that retracement. It should not be the end of the correction since it is slated to last into September with more cycles ready to make their lows ahead, and I cannot predict the exact refinements of what I see in my crystal ball, but the deceleration which has brought significant negative divergence to the daily oscillators is indicative of an imminent reversal, and is further enhanced by the disparity building up between SPX and TRAN; and to a greater extent between SPX and IWM, our other early bird indicator.
Because some modification to the congestion top is likely over the next few days, we cannot have a clear idea of the correction depth, but Fibonacci measurements point to a retracement of at least 200-250 points.
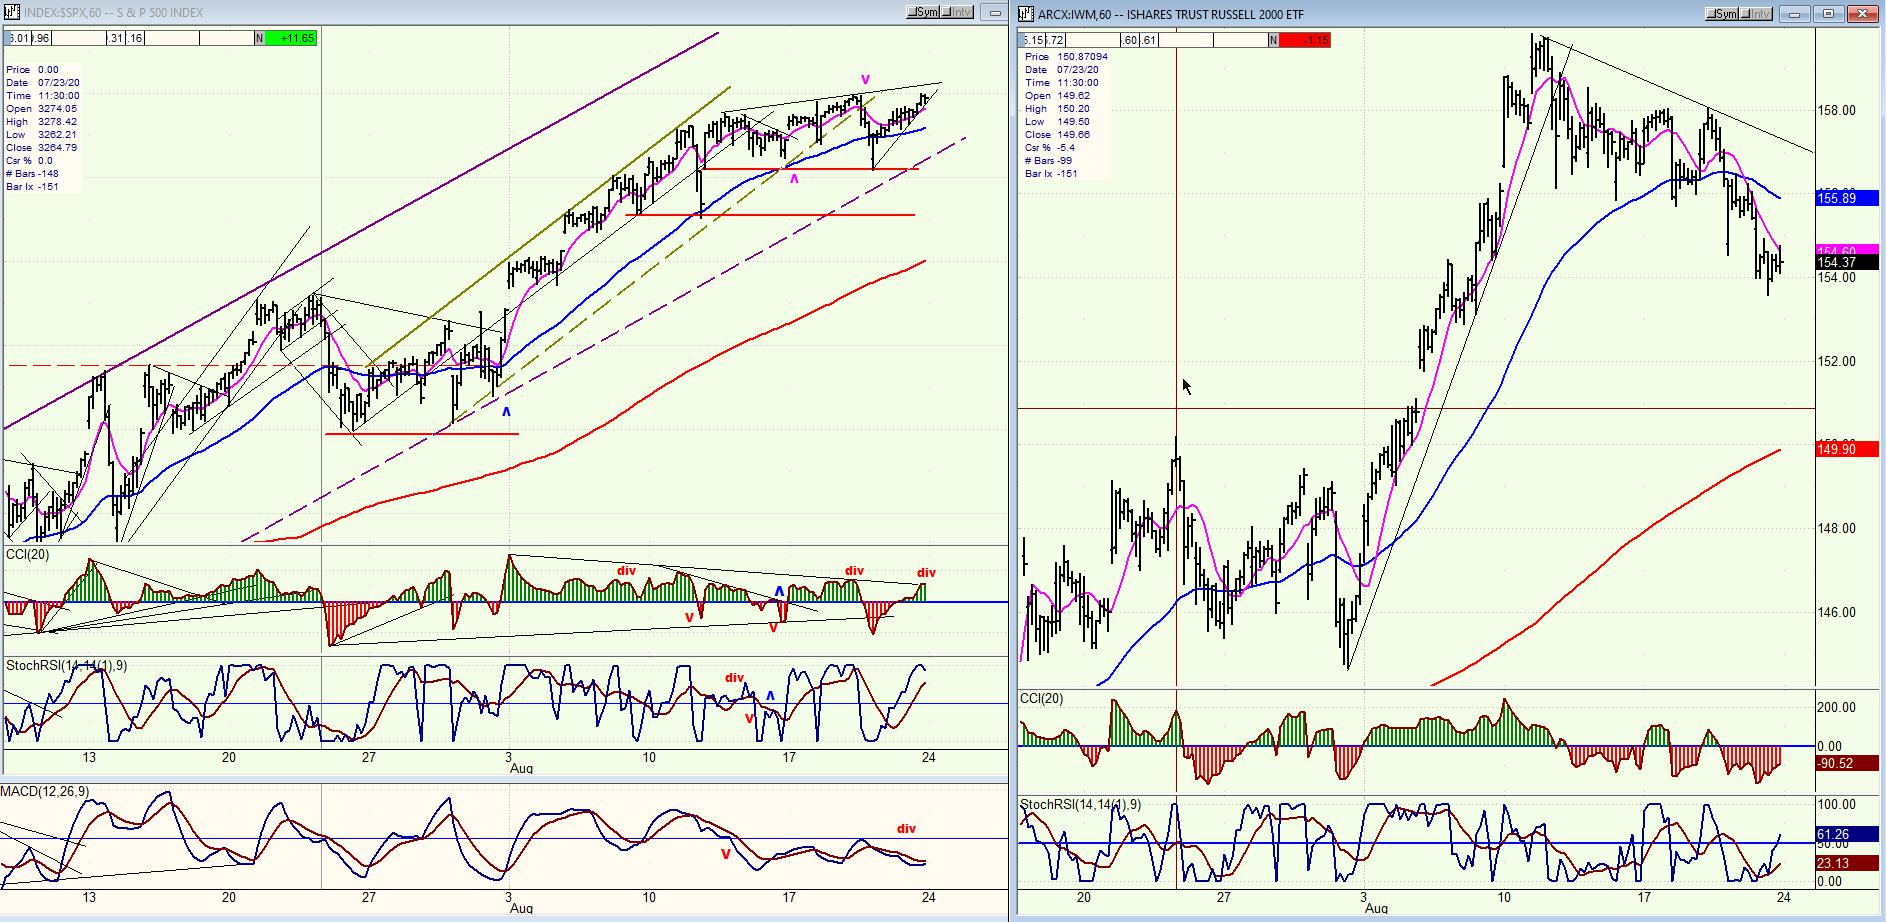
SPX hourly chart
I wanted you to see the relative weakness which has built up in IWM, so I have included its chart to the right of that of SPX! The disparity speaks for itself but, by analyzing the SPX chart separately, we can see that negative divergence has been building up in the CCI and that the final touch may have been made on Friday with overbought diverging indicators beginning to turn down. Nevertheless, it is not conclusive, and we will need confirmation.
Last week, I mentioned that we needed to come out of the small channel within the larger one, and we have now done that. For the correction to get under way in earnest, we need to come out of the larger channel as well. When we do, daily oscillators will become negative and remain in that mode until the correction is over – which is expected to be in early September.
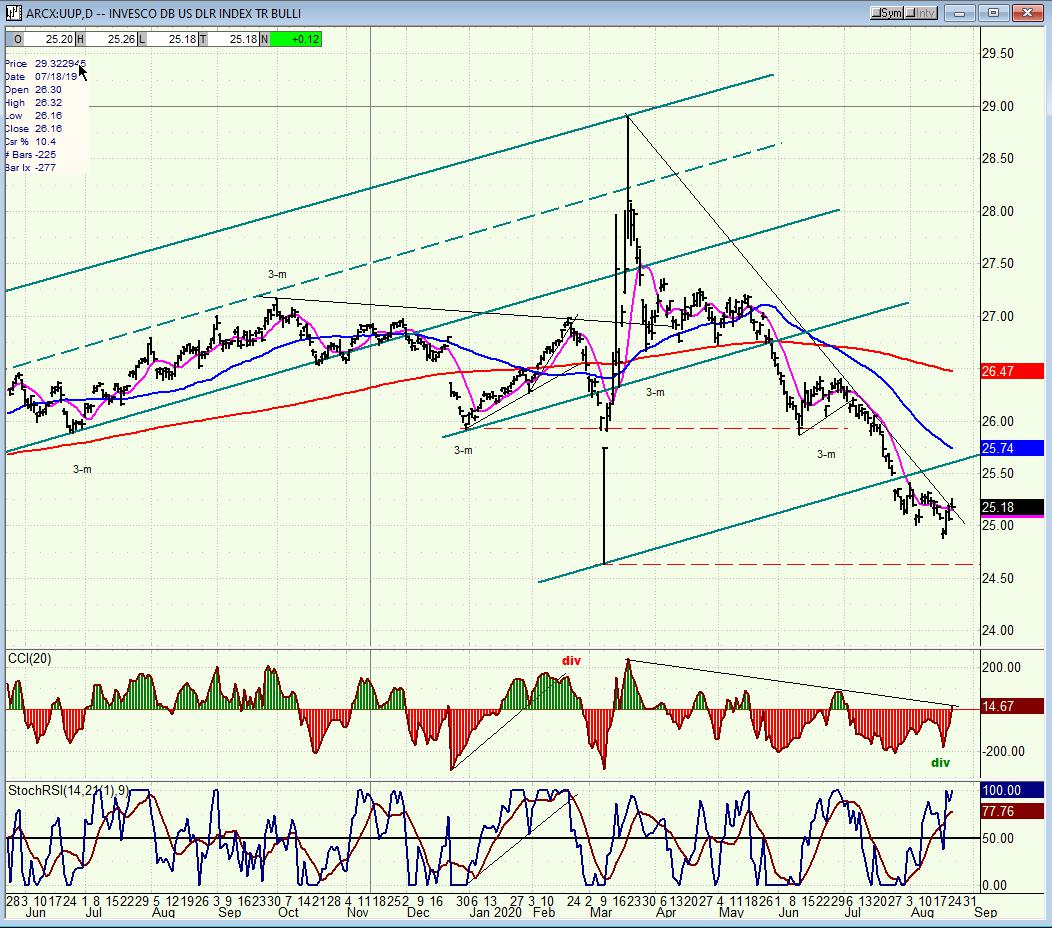
UUP (dollar ETF) ($USD chart not available from this data provider)
UUP needed a final dip before reversing. The oscillators suggest that it now has, but it will need to clear its downtrend line by a larger margin to confirm. It’s likely that this would start a move to the blue 50-dma or a little higher before finding resistance near the dashed trend line.
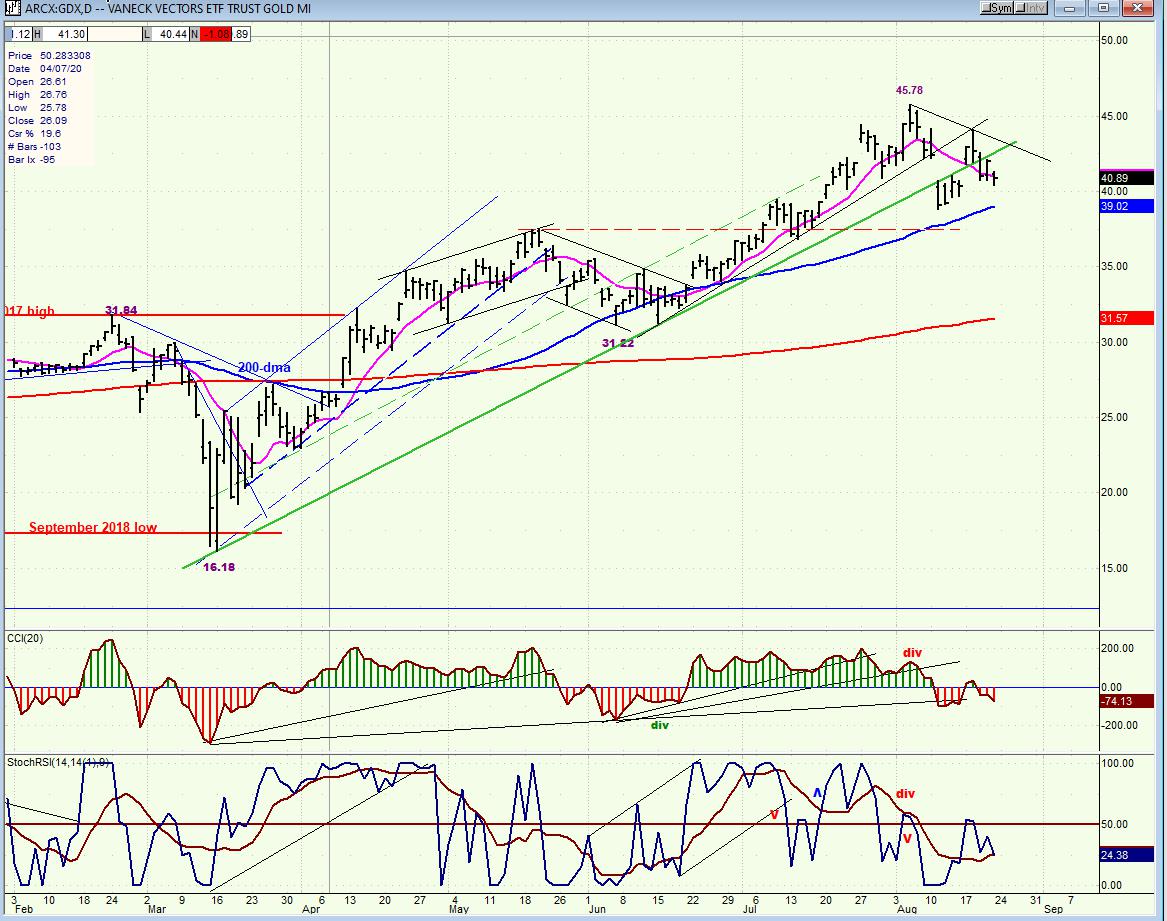
GDX (gold miners)
GDX is correcting after tripling is price from the March low. A good target for the entire correction would be the dashed line drawn across the mid-rally high or a little lower. The P&F chart gives it a potential target of about 35.00 before it is positioned to resume its long-term uptrend.
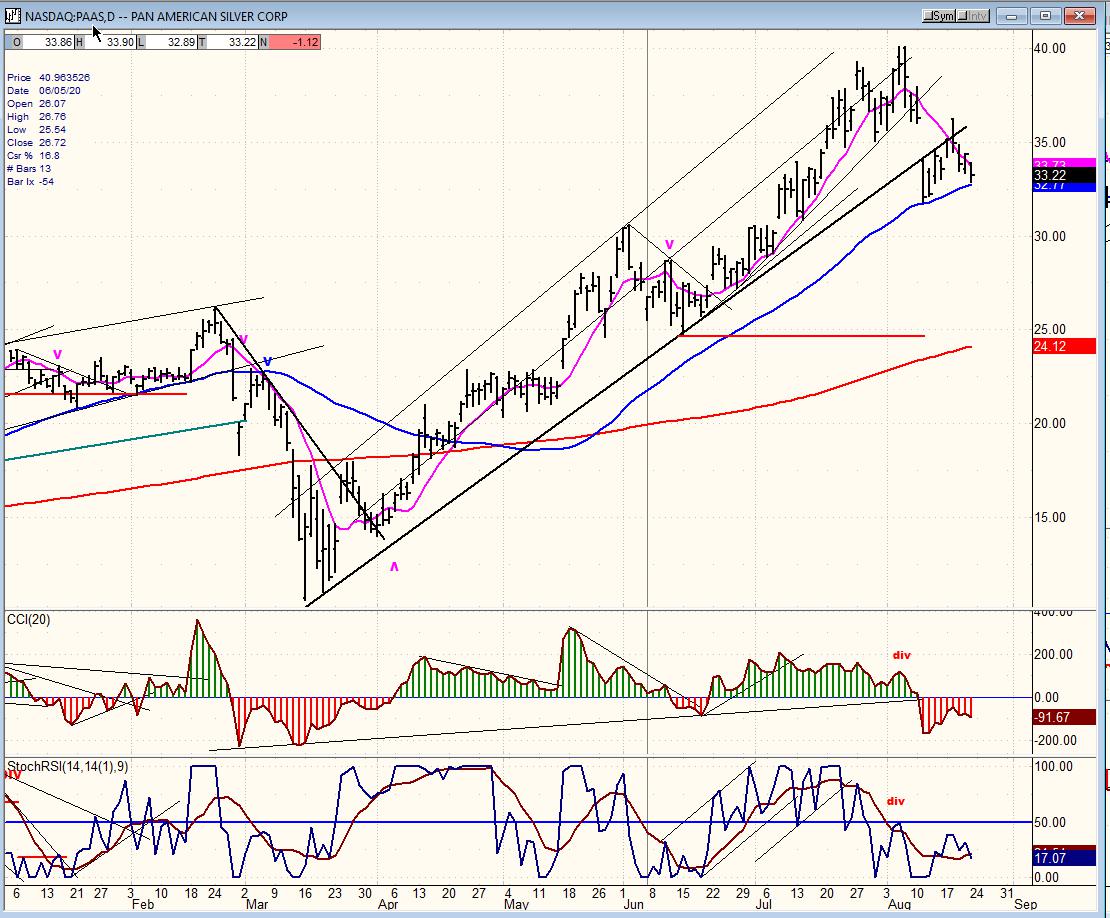
PAAS (Pan American Silver Corp)
PAAS is also correcting and has a short-term P&F target of about 30.
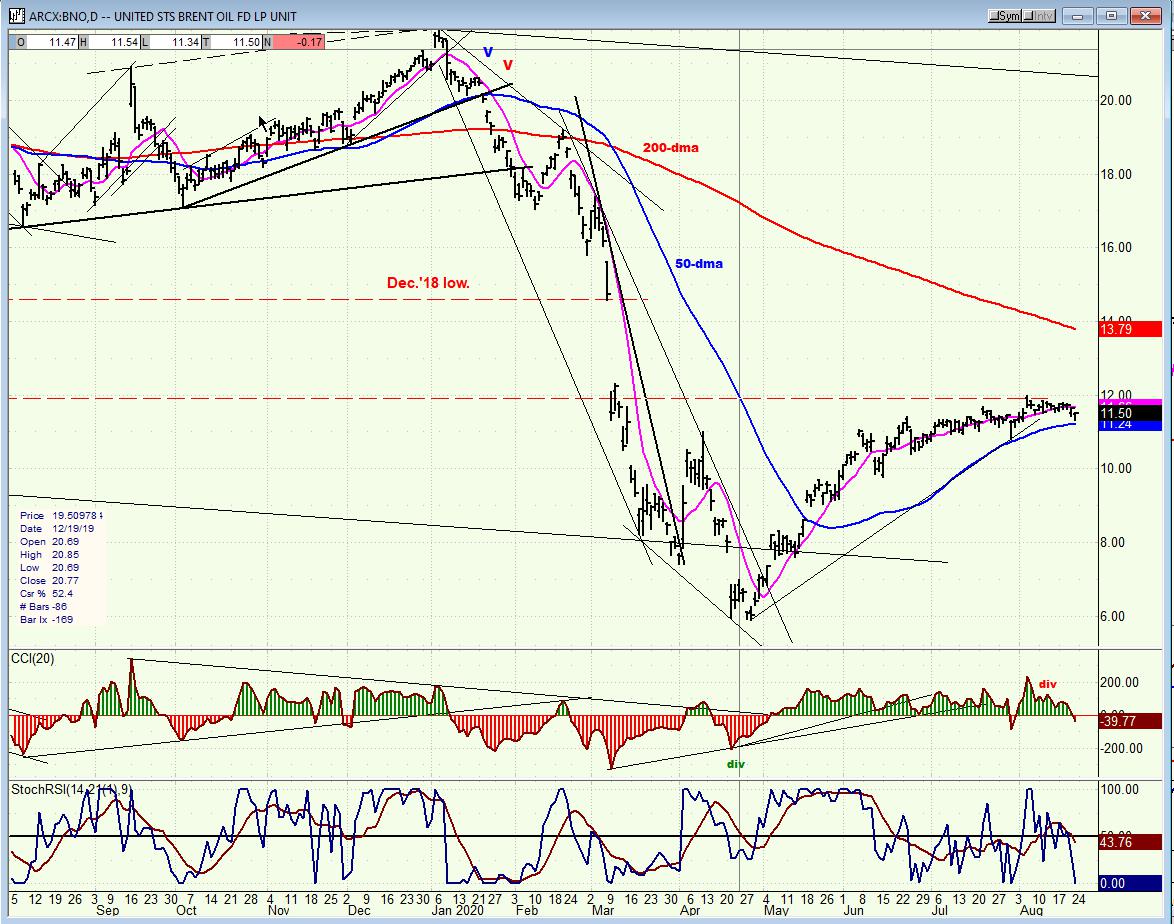
BNO (U.S. Brent Oil fund)
BNO repeatedly tried and failed to reach and surpass 12.00 over the past couple of months. Now, it may have started its correction. This will be confirmed if it closes below its blue 50-dma. A target of ~ 9 could suffice for now.
Summary
Signs that SPX is ready to correct are increasing. The first cycle to make its low could only take it down 45 points before it rebounded to a fractional new all-time high of 3399.96. The next cycle is ready to trigger the next correction which should be deeper.
Free trial subscription
With a trial subscription, you will have access to the same information that is given to paid subscribers, but for a limited time-period. Over the years, I have developed an expertise in P&F charting (price projection), cycles (timing), EWT (structure), and general technical analysis which enables me to warn subscribers of pending reversals in market trends and how far that trend can potentially carry. For a FREE 4-week trial, subscription options and payment plans, I encourage you to visit my website at www.marketurningpoints.com.
The above comments and those made in the daily updates and the Market Summary about the financial markets are based purely on what I consider to be sound technical analysis principles. They represent my own opinion and are not meant to be construed as trading or investment advice but are offered as an analytical point of view which might be of interest to those who follow stock market cycles and technical analysis.
********

When Andre Gratian was a stock broker years ago, a friend introduced him to technical analysis of the market. Consequently, it is not an exaggeration to say that Andre fell in love with this approach! Ever since then, it has become an increasingly important part of his professional life. Gratian has studied the works of Wyckoff, Edwards & Magee, Edward J. Dewey (cycles) and many others. However, one of my most profitable undertaking has probably been to study Point & Figure charting, which he finds invaluable in analyzing stocks and indices. If he were restricted to one methodology, this is the one that he would choose. This well-rounded background has given him what he feels to be a special insight into the stock market, facilitating the recognition of meaningful patterns and the ‘turning points’ in all trends, whether they be short or long term. Andre feels very comfortable discussing the stock market and passing on meaningful information to others. His subscribers include individuals and money managers throughout the world. Moreover, his Newsletters are currently published on several financial sites, here and abroad.


