Technical Analysis Of The Markets


Current Position of the Market
SPX Long-term trend: For now, the best guesstimate is that we are still in the bull market which started in 2009.
SPX Intermediate trend: Potential intermediate correction in progress.
Analysis of the short-term trend is done daily with the help of hourly charts. It is an important adjunct to the analysis of daily and weekly charts which discuss longer market trends
Correction Under Way
P&F: Top projection ~ 3490 met
Cycles: Looking ahead! 90-yr cycle – last low: 1932. Next low: 2022
7-yr cycle – last lows: 2008-2016. Next low: 2023
20-td – 9/17
Market Analysis (Charts courtesy of QCharts
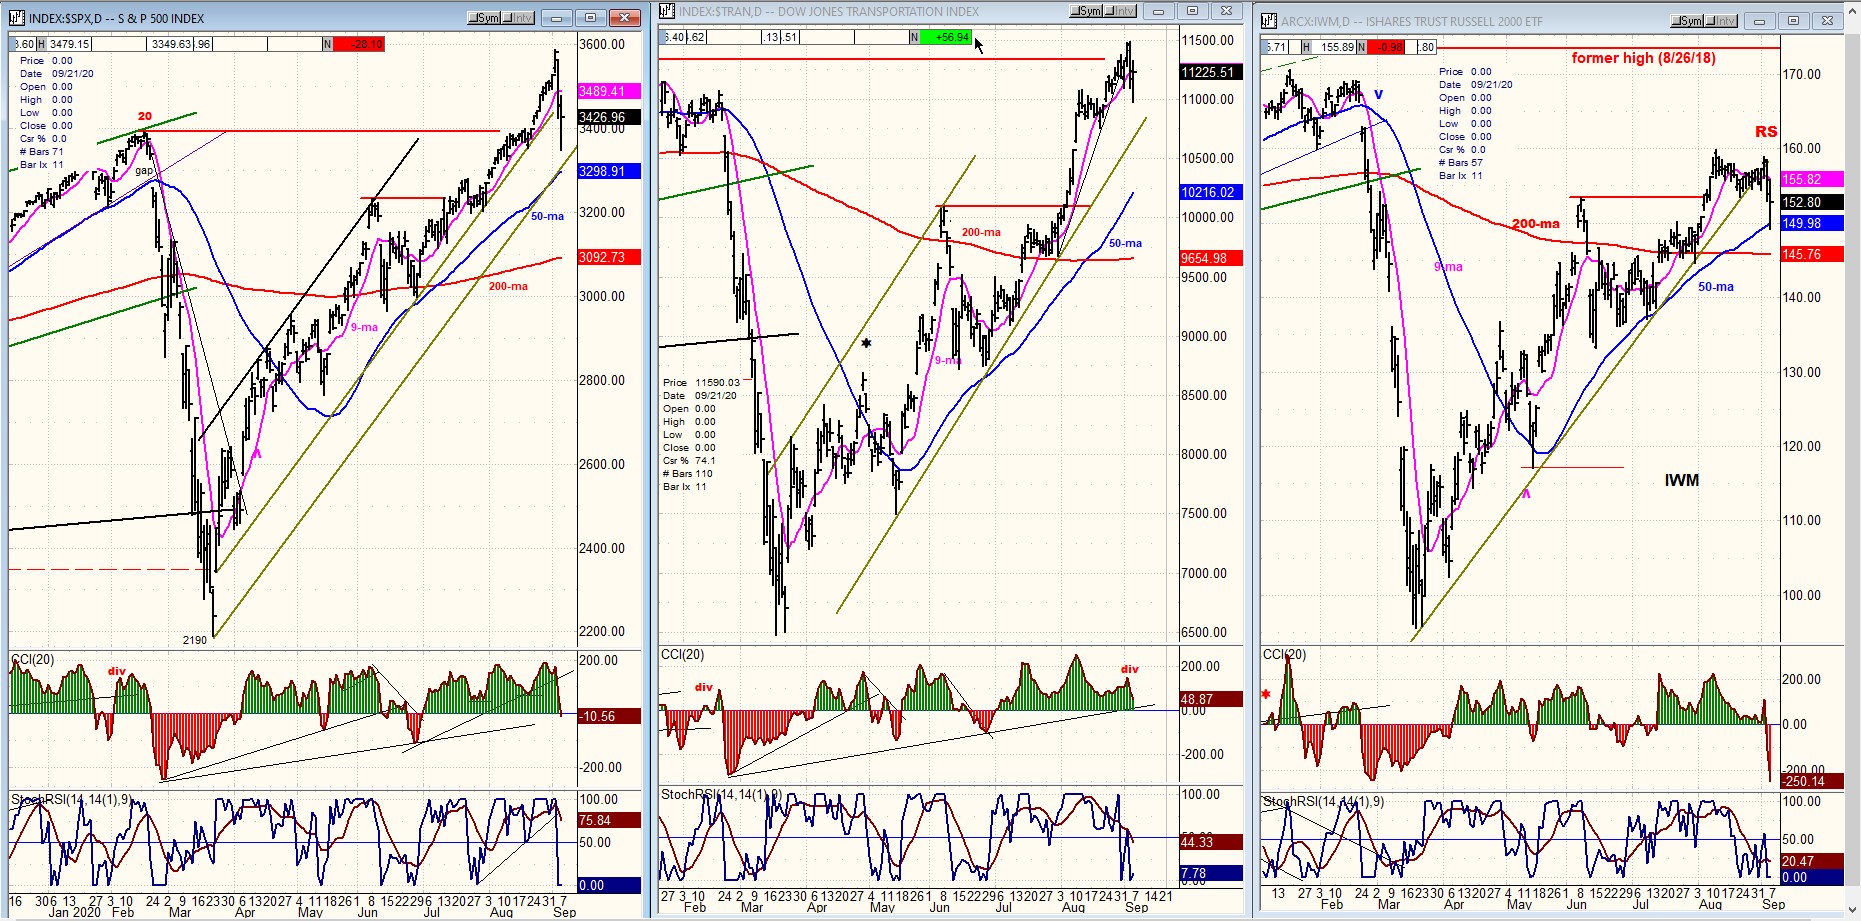
SPX-TRAN-IWM daily charts:
Comparing the three charts below, it seems that IWM is better at predicting tops than TRAN. During the last stretch of the rally since June, TRAN essentially duplicated the performance of SPX, even making a new all-time high just before correcting. IWM, by contrast, not only remained a laggard, but even gave us a three-week warning that a top was imminent.
It is note-worthy that IWM made its all-time high in 8-26-’18, thereby registering long-term relative weakness versus SPX. If this continues over the weeks ahead, we may have to conclude that it is warning us, not only of an intermediate top, but of a longer-term one as well.
On the other hand, the strength in TRAN cannot be dismissed and could be telling us that no significant correction is likely in the near future. When it strongly agrees with IWM, it will be time to exercise caution about the possibility of a more important reversal.
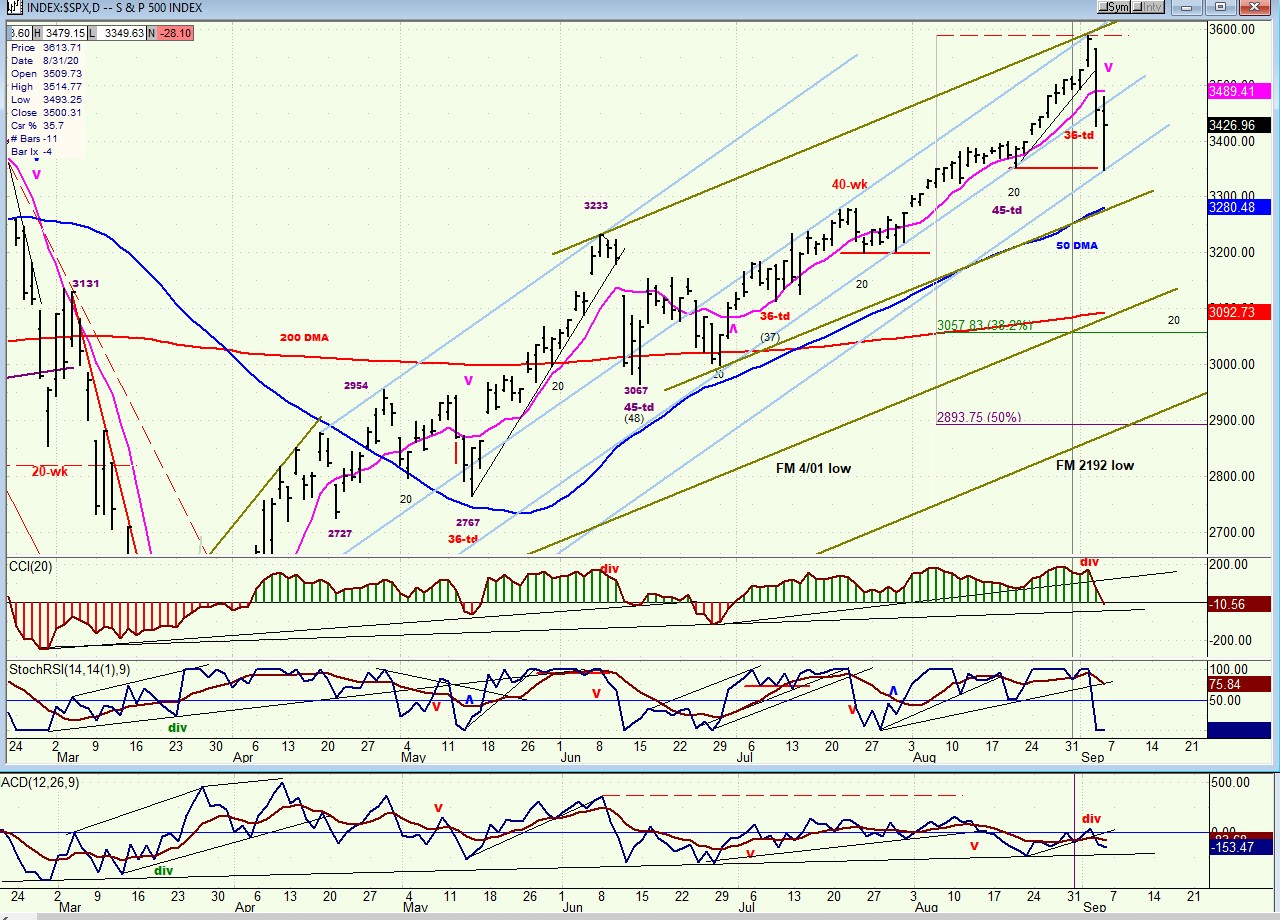
SPX daily chart
SPX made its high at the top of the small blue channel discussed last week and, on the second day of a 238 point decline, found support on the lower trend line of the large blue channel. This produced a fast and furious rally of 129 points which weakened into Friday’s close. There is no evidence at this time pointing to anything more than a much needed correction with limited impact on the market trend. A break and continued decline outside of the blue channel would, however, suggest that a longer and deeper correction has started. If it has, I have drawn potential new trend lines which could support prices.
Last week’s decline can be attributed to a number of things: overbought market which had not had a significant correction or even consolidation in the last six hundred points, a structural pattern completion, entering the weakest period of the year, etc… Take your pick and feel free to add reasons that suit you better. If September weakness has anything to do with it, we may consider that we have started a correction which will last several weeks and take SPX to lower levels, perhaps even into mid-October before we are ready to challenge the highs one more time.
We can always rely on the logic of Fibonacci retracements to help us gauge the depth of a correction so, in this case, a .382 retracement can take us to 3147 and a 50% pullback to 3013. Fibonacci and P&F projections normally suport each other, but there has not been enough top congestion from which to derive a valid count. Perhaps a little later.
Two oscillators, normally the first to do so, have given a daily sell signal. CCI stopped just short of doing it. So, we will need to see some additional weakness to get a full confirmation. For now, they have to be considered neutral with a positive bias.
Let’s go to the hourly chart to analyze the short-term market position.
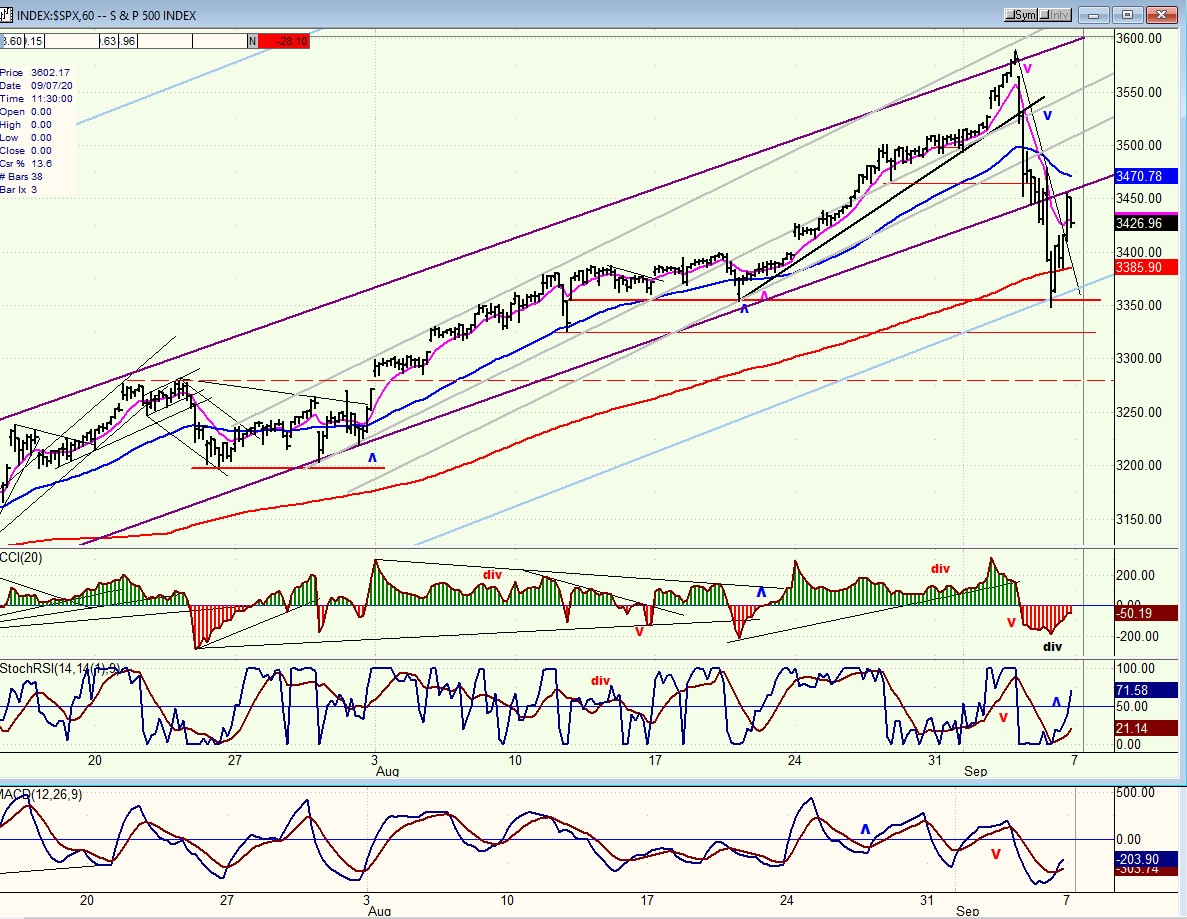
SPX hourly chart
The analysis of the hourly chart is pretty straight forward. The index found resistance at the top of two converging channel lines on Wednesday, reversed with a gap on Thursday breaking out of the first channel and below the 50-hr MA, found temporary support on the lower trend line of the second channel and, after a brief consolidation, continued the decline down to the primary blue channel line, finding some better support which triggered a good rally to the second channel line followed by a retracement into the close. The 200-hr MA was also a factor in providing a low and a reversal.
Where does that leave us? There are two immediate choices: 1) retesting and holding the blue channel line, which could lead to a retesting of the high, or even a new high. Or 2) breaking the blue channel line and continuing the decline. There has been a sufficient rally from the initial low so that a drop back to the bottom of the blue channel should again find at least temporary support, and then we would have to gauge the strength of another rally from that level.
Keeping it simple, a move back above the blue 50 MA would be a sign of strength. Remaining below it will be a sign of weakness. Currently, the hourly indicators are negative but turning neutral.
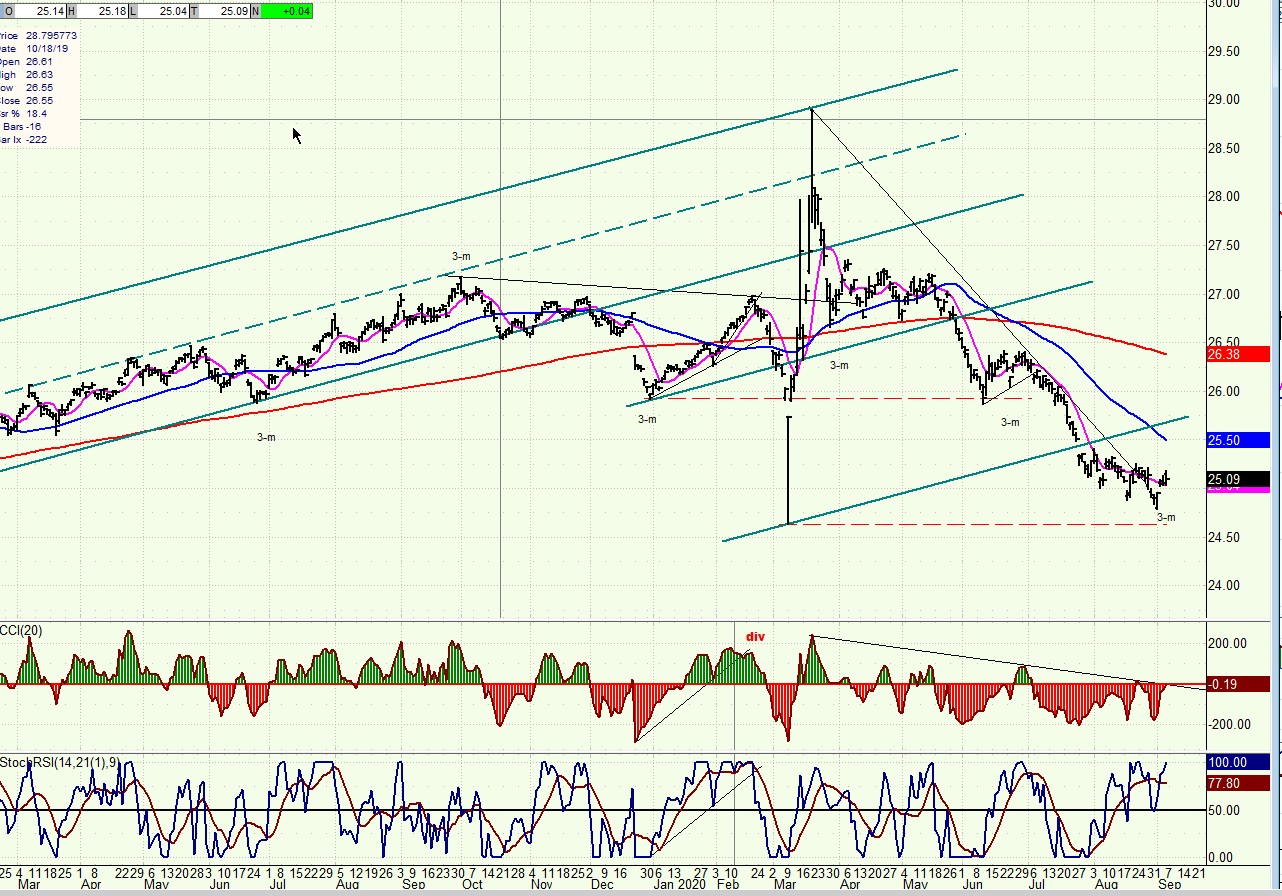
UUP (dollar ETF) ($USD chart not available from this data provider
UUP may have made a low in conjunction with its 3-mo cycle and has moved outside of its downtrend line. It now needs to exceed is former short-term high of 25.26 to get back into a short-term uptrend. Getting above 25.50 will be a greater challenge but necessary, at a minimum, if it wants to get back into an intermediate uptrend.
GDX (gold miners)
GDX may be challenged to hold its correction low this week but must do so in order to re-establish a short-term uptrend. There is good support at 27.50 if it continues to correct. If it holds, it may soon be able to challenge the recent high.

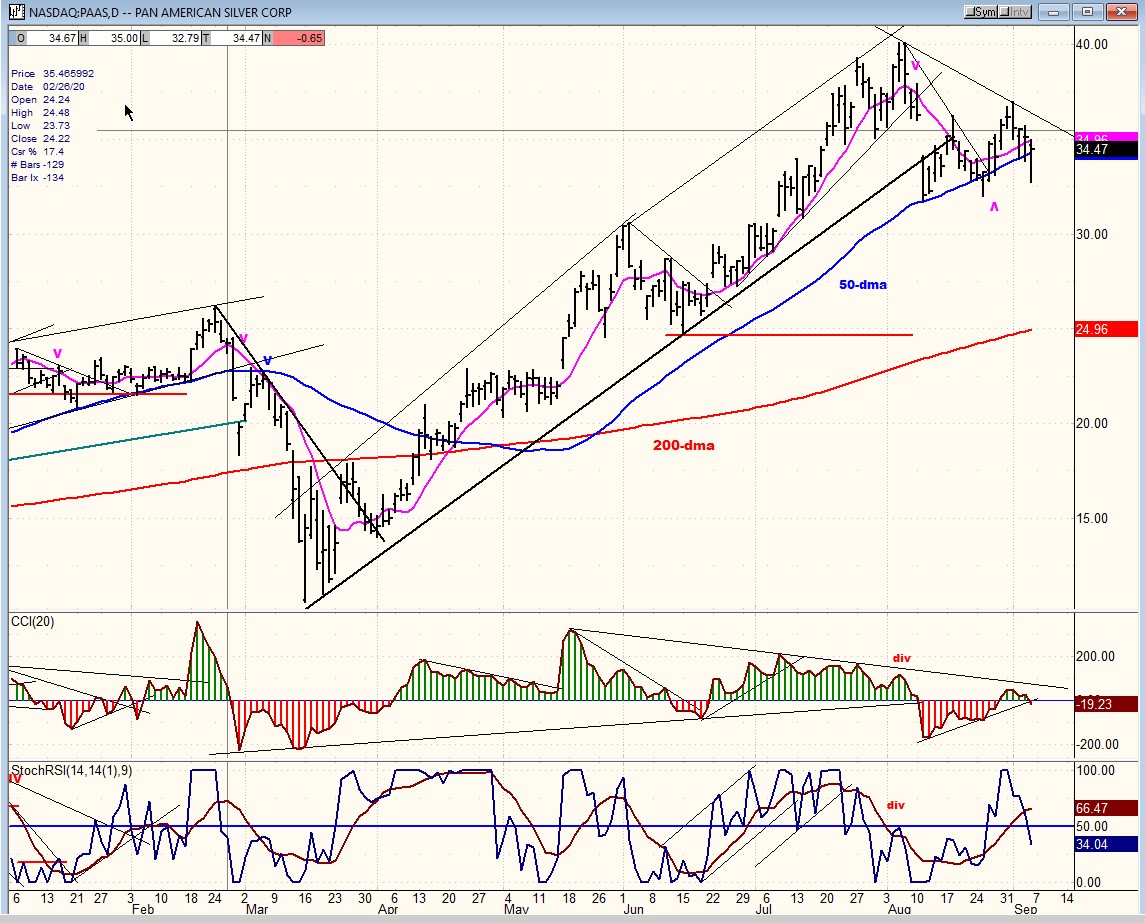
PAAS (Pan American Silver Corp)
It is difficult to find something different to say about PAAS. Technically, it moves almost identically to GDX and their chart patterns, as you can see are similar. Both have had big moves since March, but have only made shallow corrections, which is a sign of strength, suggesting that a resumption of the uptrend is not far away if they continue to hold as well as they have.
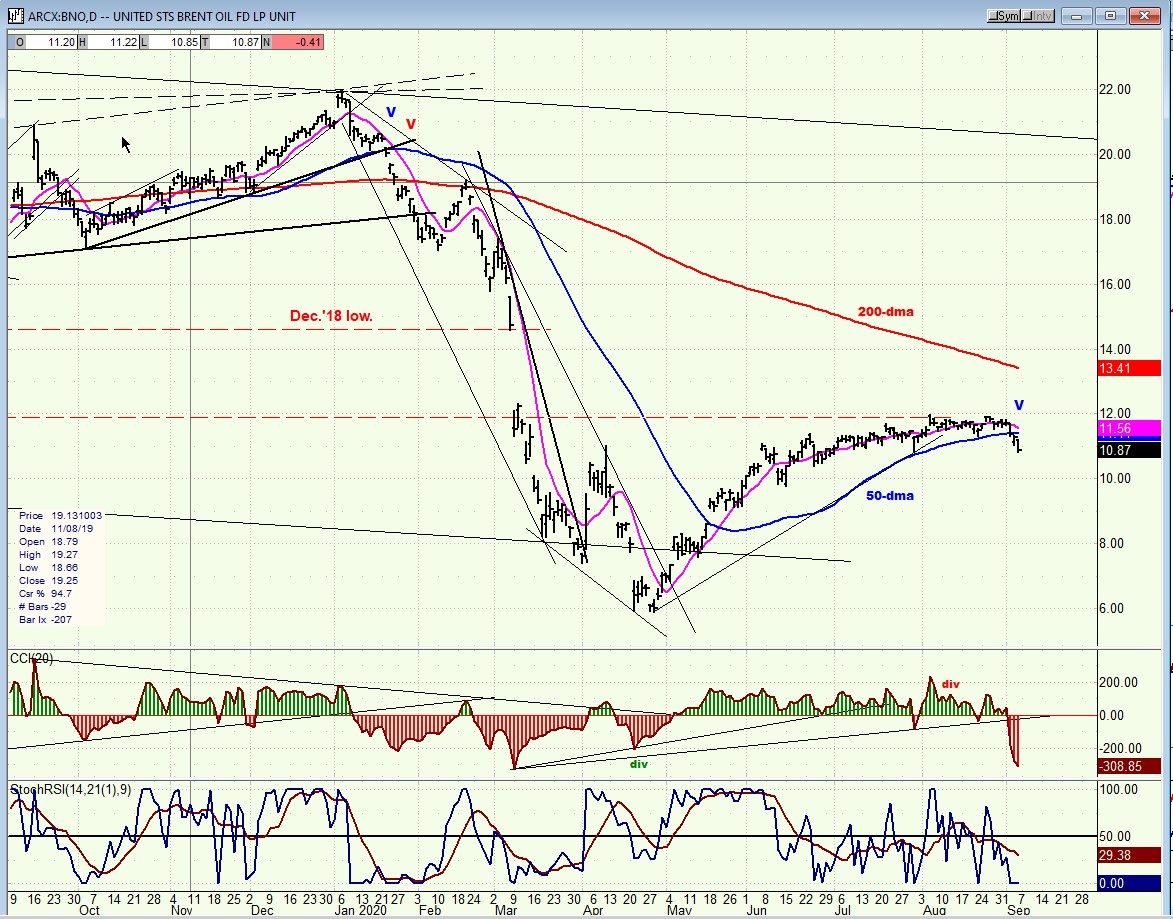
BNO (U.S. Brent Oil fund)
After crawling below 12.00 for several weeks without touching it as it tried to hold above its 50-dma, BNO has finally broken below. That MA is an important marker for this index, and breaking it is not a good sign -- suggesting that a new correction could be starting.
Summary
Last week SPX experienced a sharp decline which many analysts considered overdue, followed by a sharp retracement and another pullback into Friday’s close. It has been a while since the index has experienced this kind of volatility. It is too soon to know how much more of a downtrend is underway, but the index stopped on the bottom line of the bullish channel it established since the March low; and must hold it for this correction to be short-lived.
Free trial subscription
With a trial subscription, you will have access to the same information that is given to paid subscribers, but for a limited time-period. Over the years, I have developed an expertise in P&F charting (price projection), cycles (timing), EWT (structure), and general technical analysis which enables me to warn subscribers of pending reversals in market trends and how far that trend can potentially carry. For a FREE 4-week trial, subscription options and payment plans, I encourage you to visit my website at www.marketurningpoints.com.
The above comments and those made in the daily updates and the Market Summary about the financial markets are based purely on what I consider to be sound technical analysis principles. They represent my own opinion and are not meant to be construed as trading or investment advice but are offered as an analytical point of view which might be of interest to those who follow stock market cycles and technical analysis.
********

When Andre Gratian was a stock broker years ago, a friend introduced him to technical analysis of the market. Consequently, it is not an exaggeration to say that Andre fell in love with this approach! Ever since then, it has become an increasingly important part of his professional life. Gratian has studied the works of Wyckoff, Edwards & Magee, Edward J. Dewey (cycles) and many others. However, one of my most profitable undertaking has probably been to study Point & Figure charting, which he finds invaluable in analyzing stocks and indices. If he were restricted to one methodology, this is the one that he would choose. This well-rounded background has given him what he feels to be a special insight into the stock market, facilitating the recognition of meaningful patterns and the ‘turning points’ in all trends, whether they be short or long term. Andre feels very comfortable discussing the stock market and passing on meaningful information to others. His subscribers include individuals and money managers throughout the world. Moreover, his Newsletters are currently published on several financial sites, here and abroad.


