Technical Analysis Of The Markets


Current Position of the Market
SPX Long-term trend: For now, the best guesstimate is that we are still in the bull market which started in 2009.
SPX Intermediate trend: Potential intermediate correction in progress.
Analysis of the short-term trend is done daily with the help of hourly charts. It is an important adjunct to the analysis of daily and weekly charts which discuss longer market trends.
Approaching Initial Objective
P&F: Short-term projection: 3300-3260
Cycles: Looking ahead! 90-yr cycle – last low: 1932. Next low: 2022
7-yr cycle – last lows: 2008-2016. Next low: 2023
20-td – 9/17
Market Analysis (Charts courtesy of QCharts
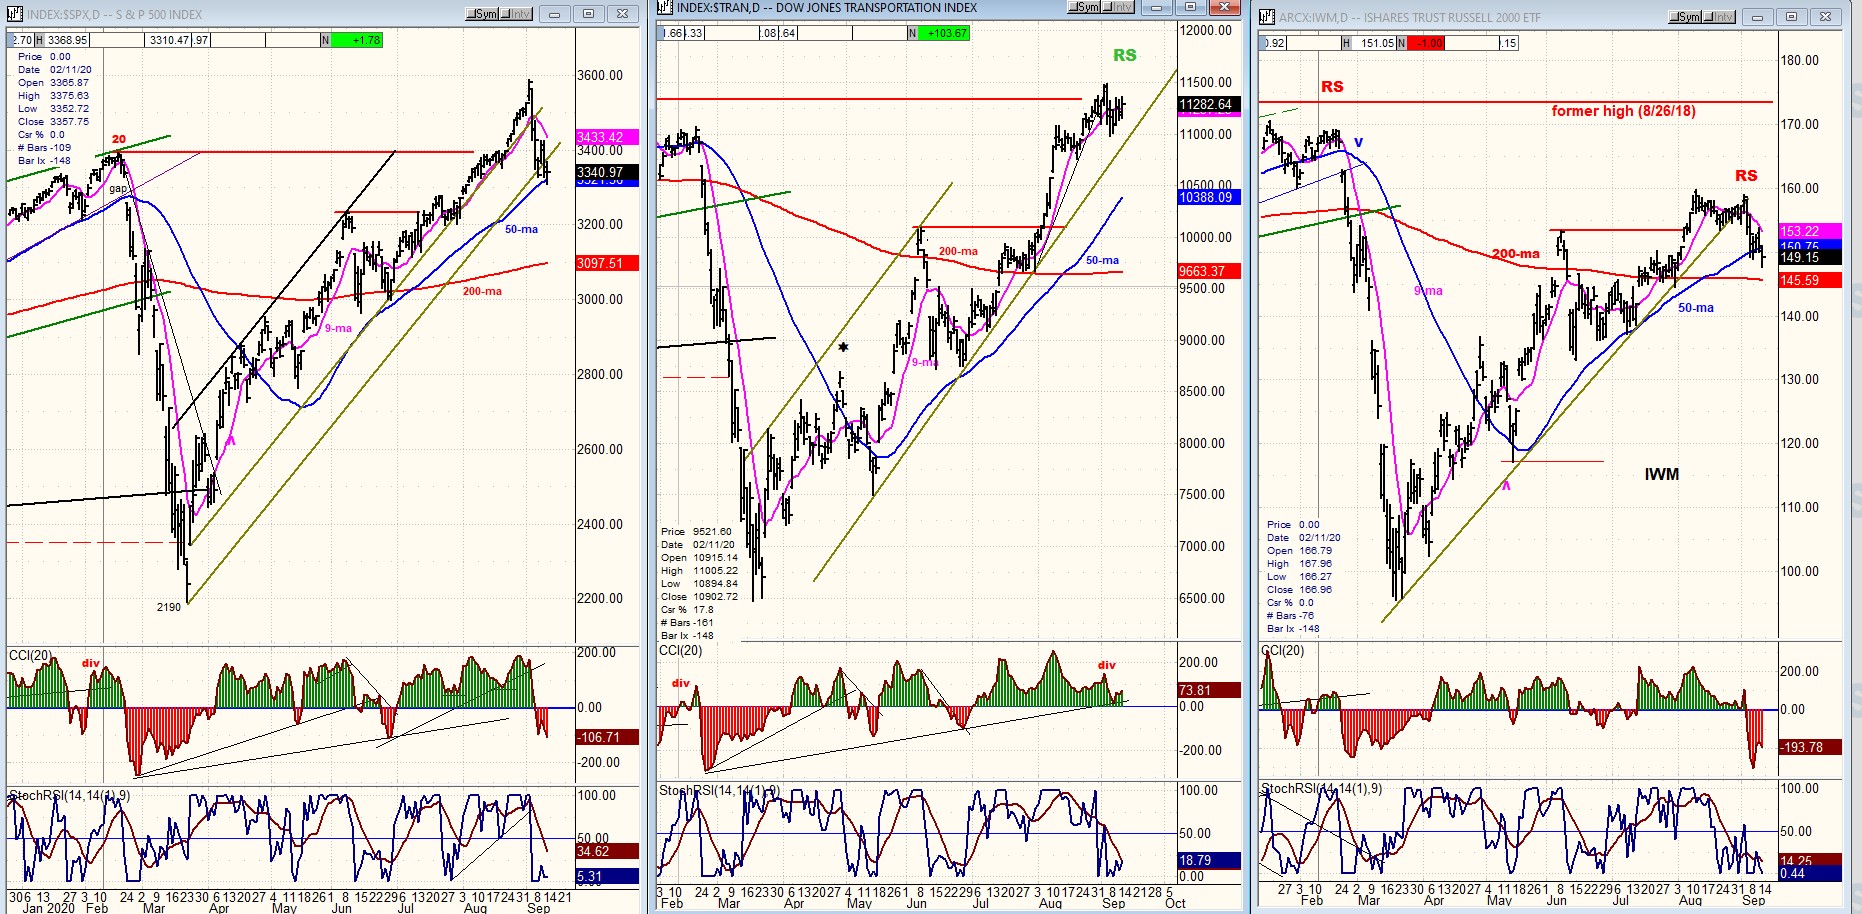
SPX-TRAN-IWM daily charts:
The most significant change in last week’s charts is that TRAN has improved its relative strength to SPX. This should mean that this is not a market top, but a correction in an uptrend. IWM was in step with SPX and does not forecast any change in the trend.
This is the best correction since June, and some technical factors suggests that a low of sorts could come next week. More time will be required learn what kind of a low.
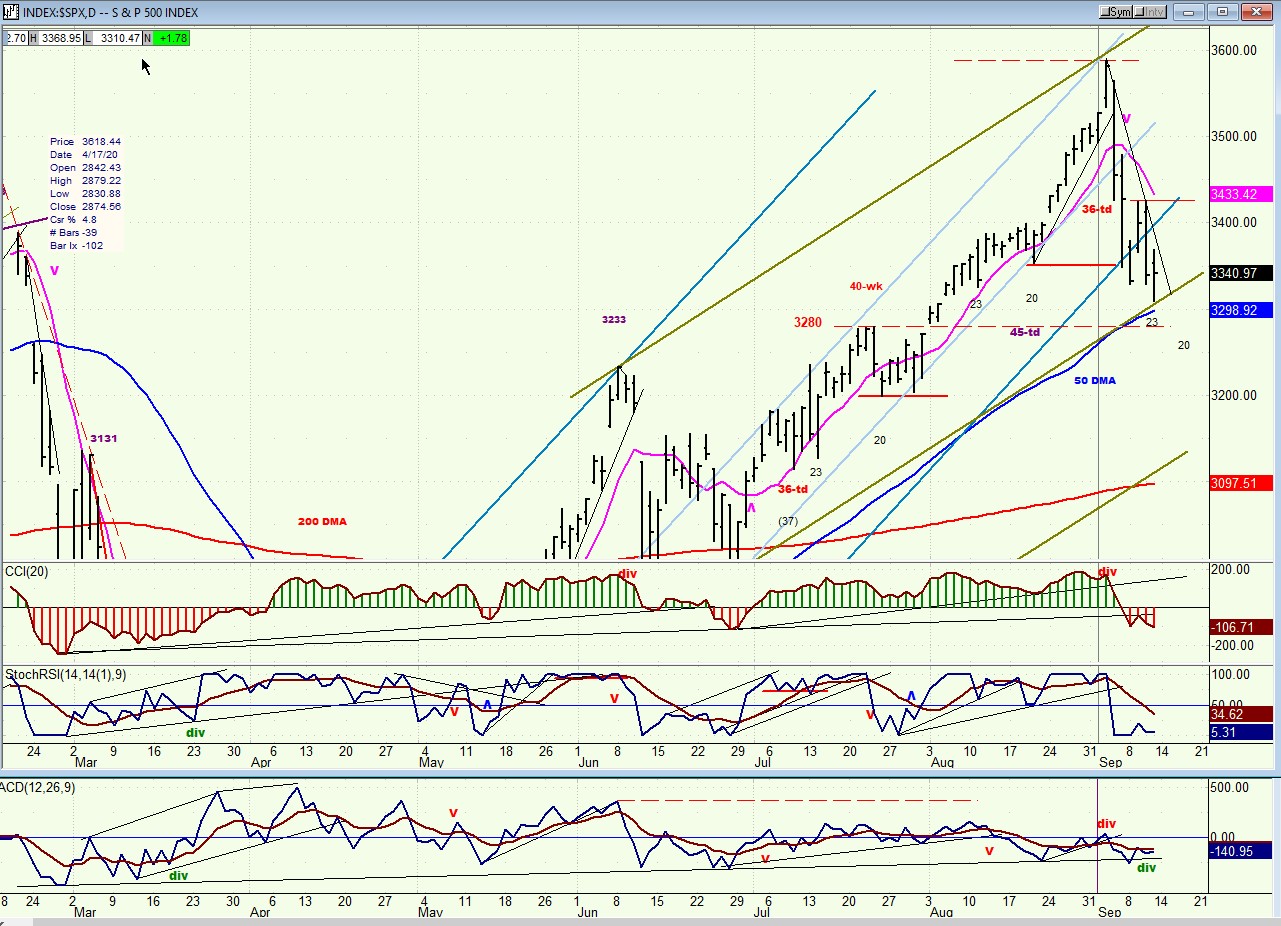
SPX daily chart
Last week SPX made a new correction low, found support on the first parallel green line and bounced. In the process, it broke outside of the blue channel, but not by much and it may hold ~3000, which should be a strong support level combining the parallel line with the 50-dma. In addition, it is also the level of the short-term P&F projection from the top (3260-3000). Another factor is that 3275 is a 50% retracement of the uptrend which started with the June low of 3067. These three factors combined provide a reasonable case for a low to be made in that area, especially since it is reinforced by a short-term cycle bottoming on about 9/17.
Although the momentum oscillators are still negative, they showed some deceleration and the A-D oscillator managed some positive divergence. A rally starting next week is therefore possible and even likely, but what kind of a rally will it be? If it is only a rally to the broken blue channel line, followed by more weakness, we will have the option of stopping at the current low, or going lower. There is no concrete base formation completed in the P&F chart, and therefore we cannot assess the extent of the rally, but a little more work on the right of the current pattern would produce a formation which could easily take SPX to a new all-time high. There are too many possibilities to contemplate, so we had better wait until we have the rally to evaluate what it does.
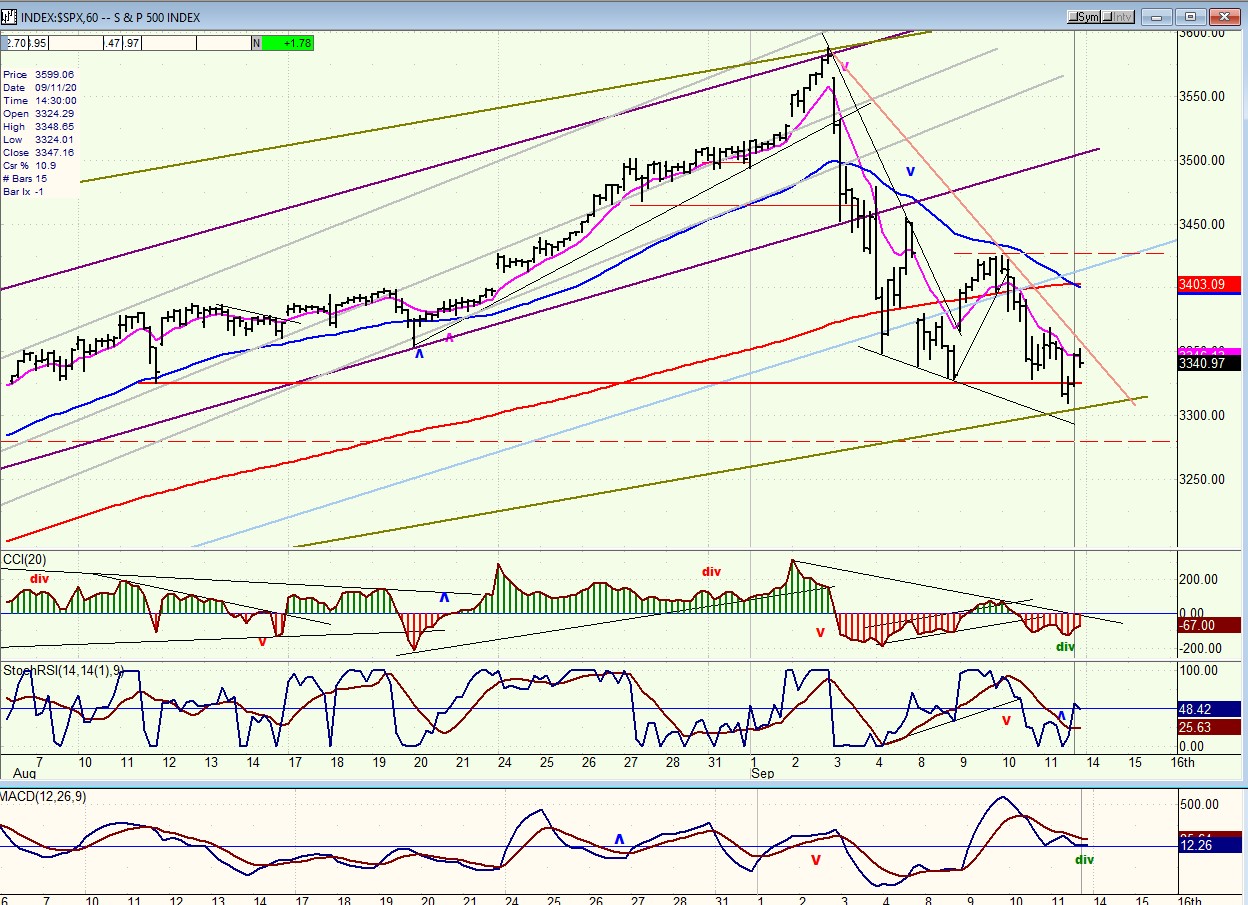
SPX hourly chart
The SPX is making a diagonal pattern which looks nearly complete, and it would probably be with one more dip into the cycle low due next week -- providing it remains above 3260. Hopefully, the short-term cycles going forward will become a little more visible than they were during the uptrend.
There are many signs that the correction or, at least this phase of the correction is coming to an end. Besides the pattern itself which depicts price deceleration, I discussed above the likely support which is just below the market. In addition, the oscillators are all showing positive divergence. In fact, Friday’s low was most likely a 32-cd cycle low which gives the index an outside chance of having already made its low.
If next week is not the final low of the correction, the next P&F count would be down to about 3220.
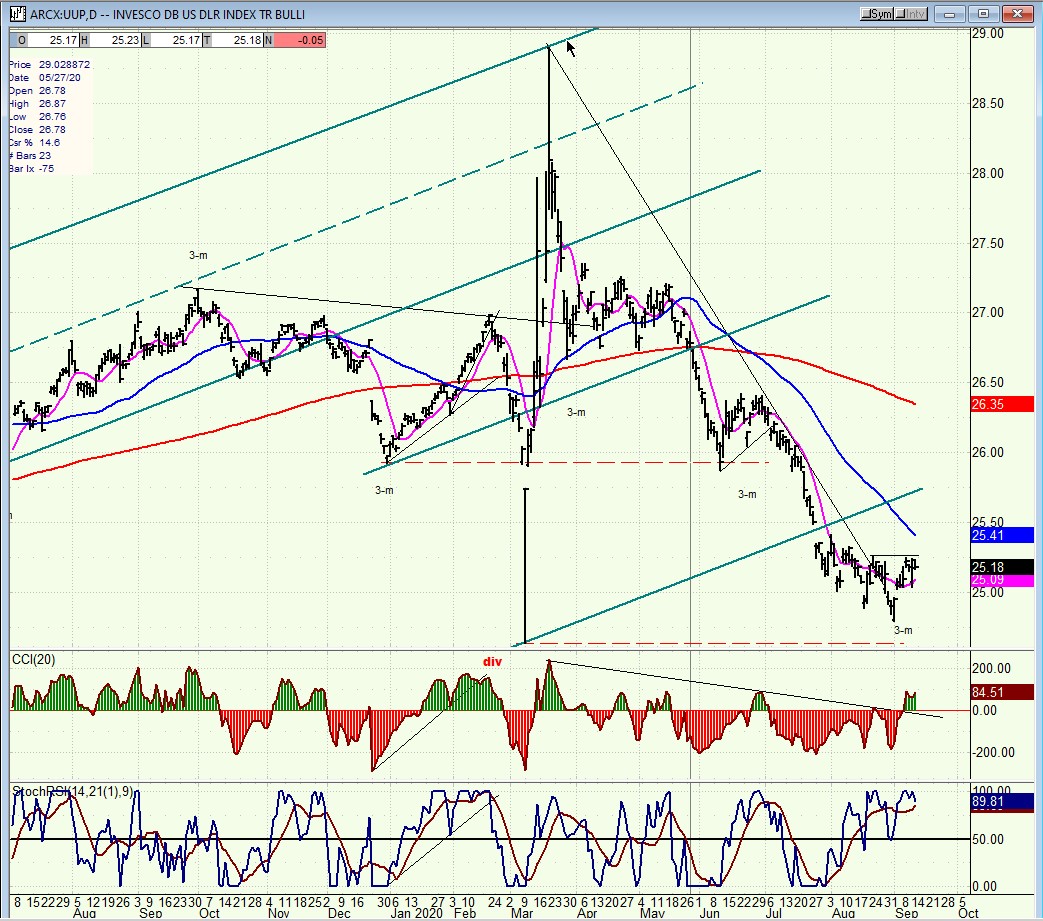
UUP (dollar ETF) ($USD chart not available from this data provider)
As expected, UUP has rallied (bounced) from its low which is likely to be the 3m cycle low. So far, it’s more of a holding action than a rally since it has not yet been able to move above the former short-term high; but as long as the oscillators remain positive, it has a chance of moving higher.
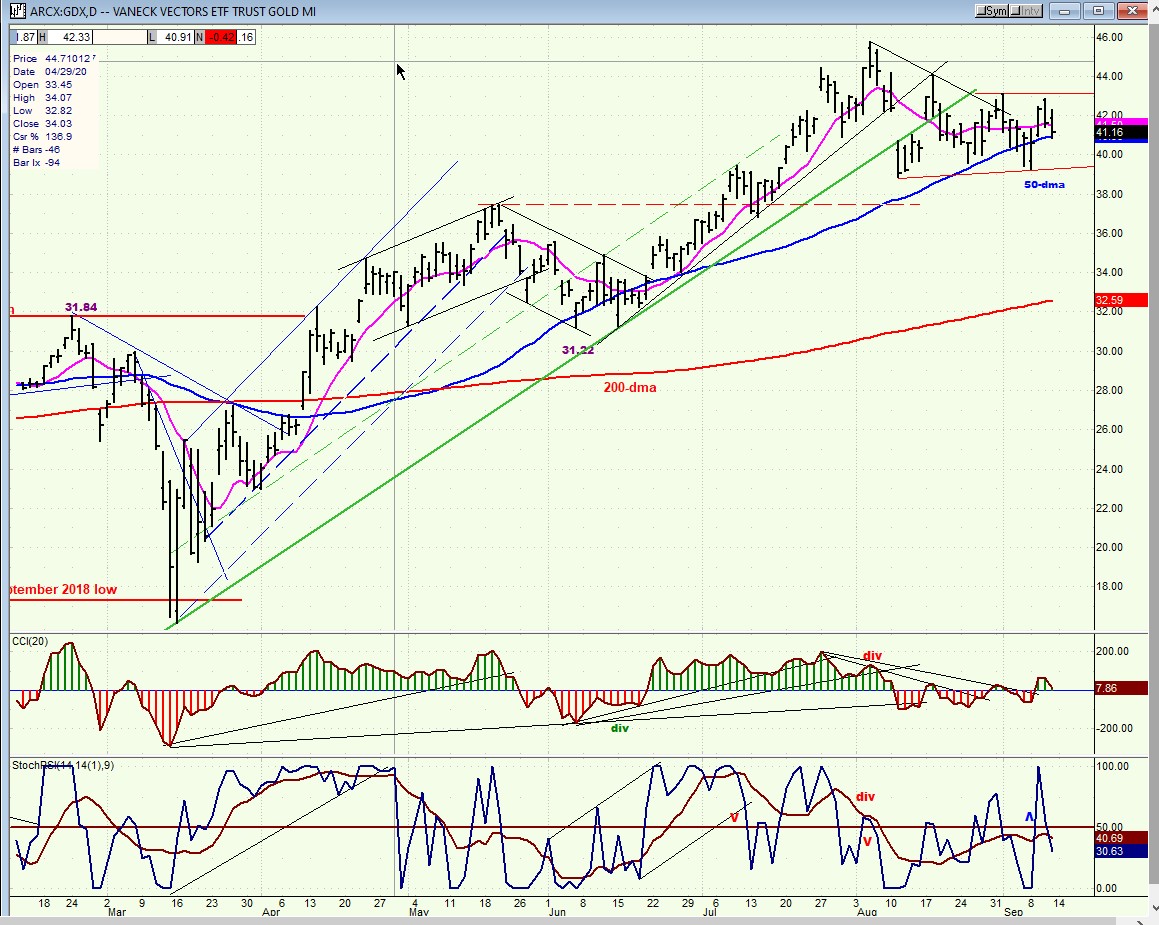
GDX (gold miners)
GDX has not given much ground since more than doubling in price from the low. This is a sign of strength which suggests that another move to a new high could be ready. It has produced enough of a base (?) to take it to at least 53 on the next move. But if it cannot clear the former high soon, it will have to extend its consolidation. The oscillators started an uptrend, which is bullish, but now they require some follow through on the upside.
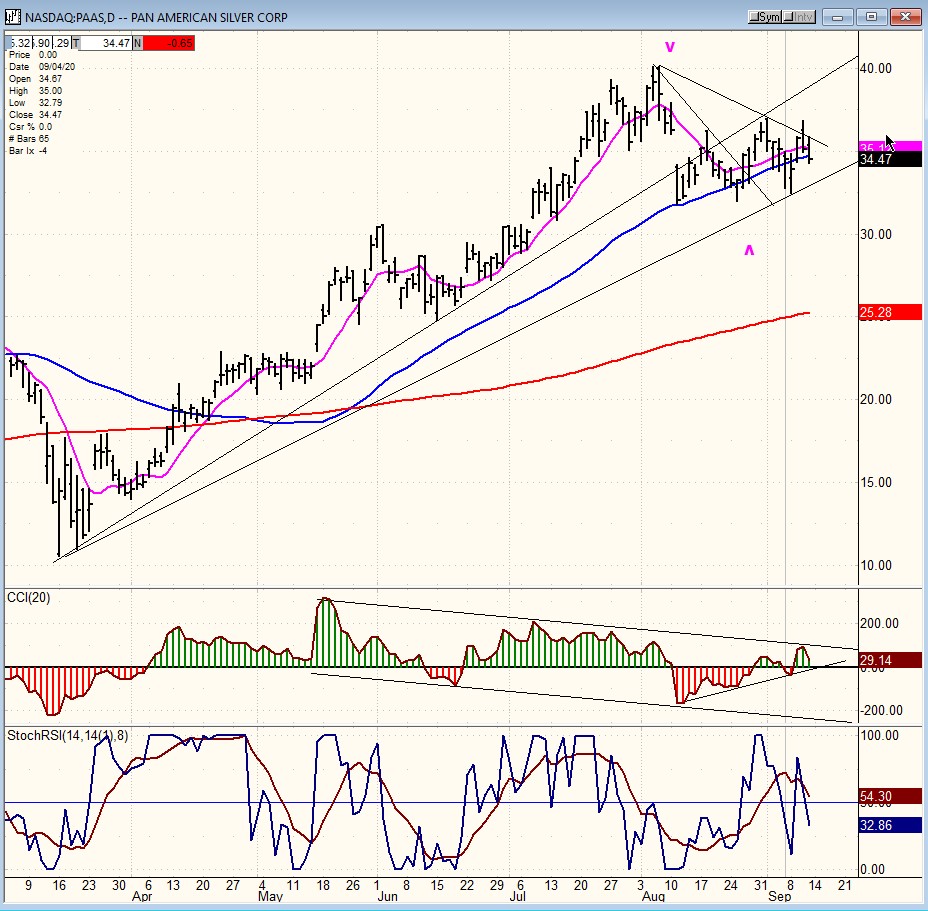
PAAS (Pan American Silver Corp)
PAAS, which has already nearly quadrupled in price is also making a strong consolidation pattern, giving back little in this correction. Like GDX, if it can clear the former high, it may be able to reach close to 50 before its next consolidation. Its indicators are in the same position as those of GDX. If they turn negative, it would mean another phase down.
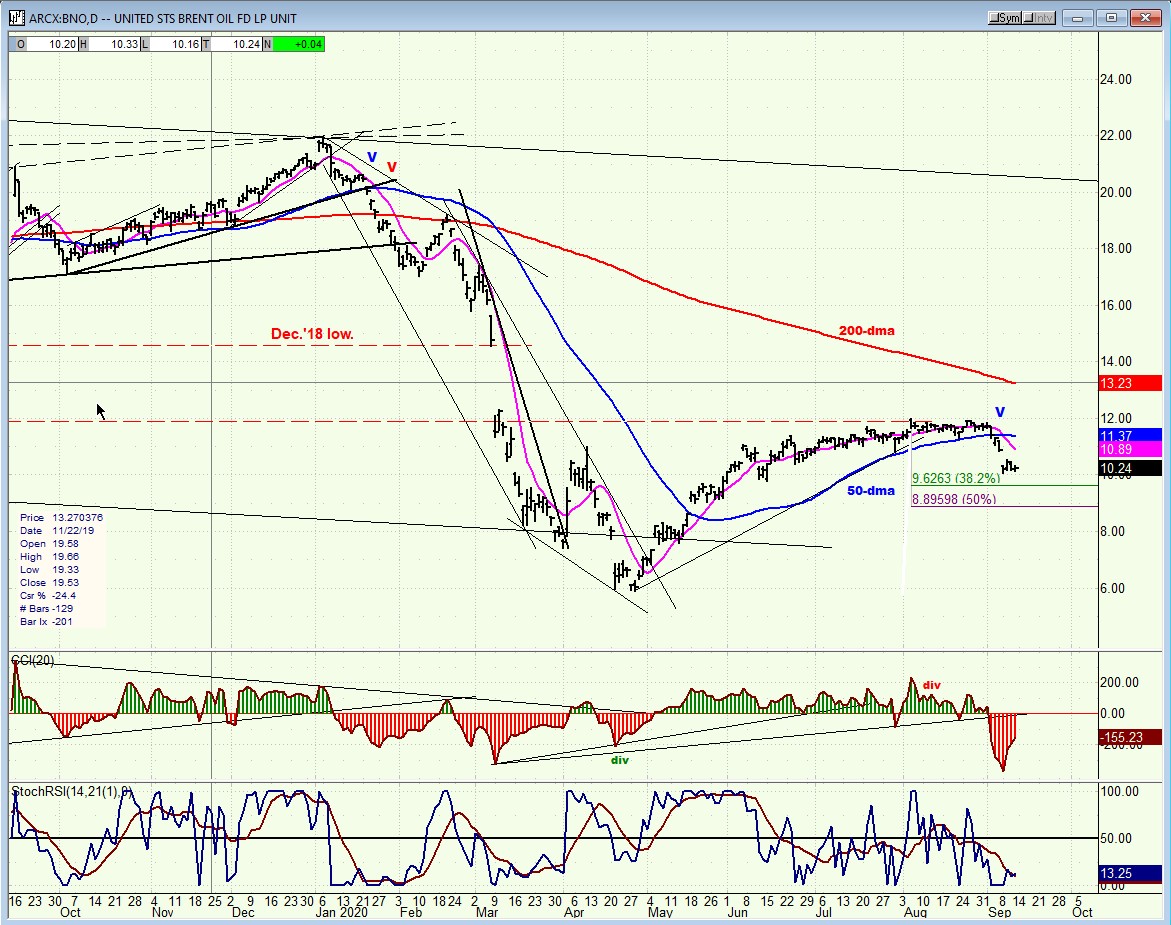
BNO (U.S. Brent Oil fund)
BNO is behaving as expected. It is close to reaching the .382 retracement level and would have to drop a little below 9 for a 50% correction from the low.
Summary
SPX is close to finding a low for this phase of the correction and this could happen next week. It is not clear at this time if this will be a resumption of the uptrend, or if more short-term downtrend lies ahead. The original thinking was that, due to seasonal patterns, this consolidation/correction could last until the early part of October.
Free trial subscription
With a trial subscription, you will have access to the same information that is given to paid subscribers, but for a limited time-period. Over the years, I have developed an expertise in P&F charting (price projection), cycles (timing), EWT (structure), and general technical analysis which enables me to warn subscribers of pending reversals in market trends and how far that trend can potentially carry. For a FREE 4-week trial, subscription options and payment plans, I encourage you to visit my website at www.marketurningpoints.com.
The above comments and those made in the daily updates and the Market Summary about the financial markets are based purely on what I consider to be sound technical analysis principles. They represent my own opinion and are not meant to be construed as trading or investment advice but are offered as an analytical point of view which might be of interest to those who follow stock market cycles and technical analysis.
********

When Andre Gratian was a stock broker years ago, a friend introduced him to technical analysis of the market. Consequently, it is not an exaggeration to say that Andre fell in love with this approach! Ever since then, it has become an increasingly important part of his professional life. Gratian has studied the works of Wyckoff, Edwards & Magee, Edward J. Dewey (cycles) and many others. However, one of my most profitable undertaking has probably been to study Point & Figure charting, which he finds invaluable in analyzing stocks and indices. If he were restricted to one methodology, this is the one that he would choose. This well-rounded background has given him what he feels to be a special insight into the stock market, facilitating the recognition of meaningful patterns and the ‘turning points’ in all trends, whether they be short or long term. Andre feels very comfortable discussing the stock market and passing on meaningful information to others. His subscribers include individuals and money managers throughout the world. Moreover, his Newsletters are currently published on several financial sites, here and abroad.


