Technical Analysis Of The Markets


Current Position of the Market
SPX Long-term trend: For now, the best guesstimate is that we are still in the bull market which started in 2009. Where we go from here and how far will be gauged after the September-November correction.
SPX Intermediate trend: Intermediate correction could continue as a large sideways pattern at least into mid-November, and perhaps until the end of the year.
Analysis of the short-term trend is done daily with the help of hourly charts. It is an important adjunct to the analysis of daily and weekly charts which discuss longer market trends.
Correction Continues
Cycles: Looking ahead! 90-yr cycle – last low: 1932. Next low: 2022
7-yr cycle – last low: 2016. Next low: 2023
New minor low about mid-November.
Market Analysis (Charts courtesy of QCharts
SPX-IWM weekly charts
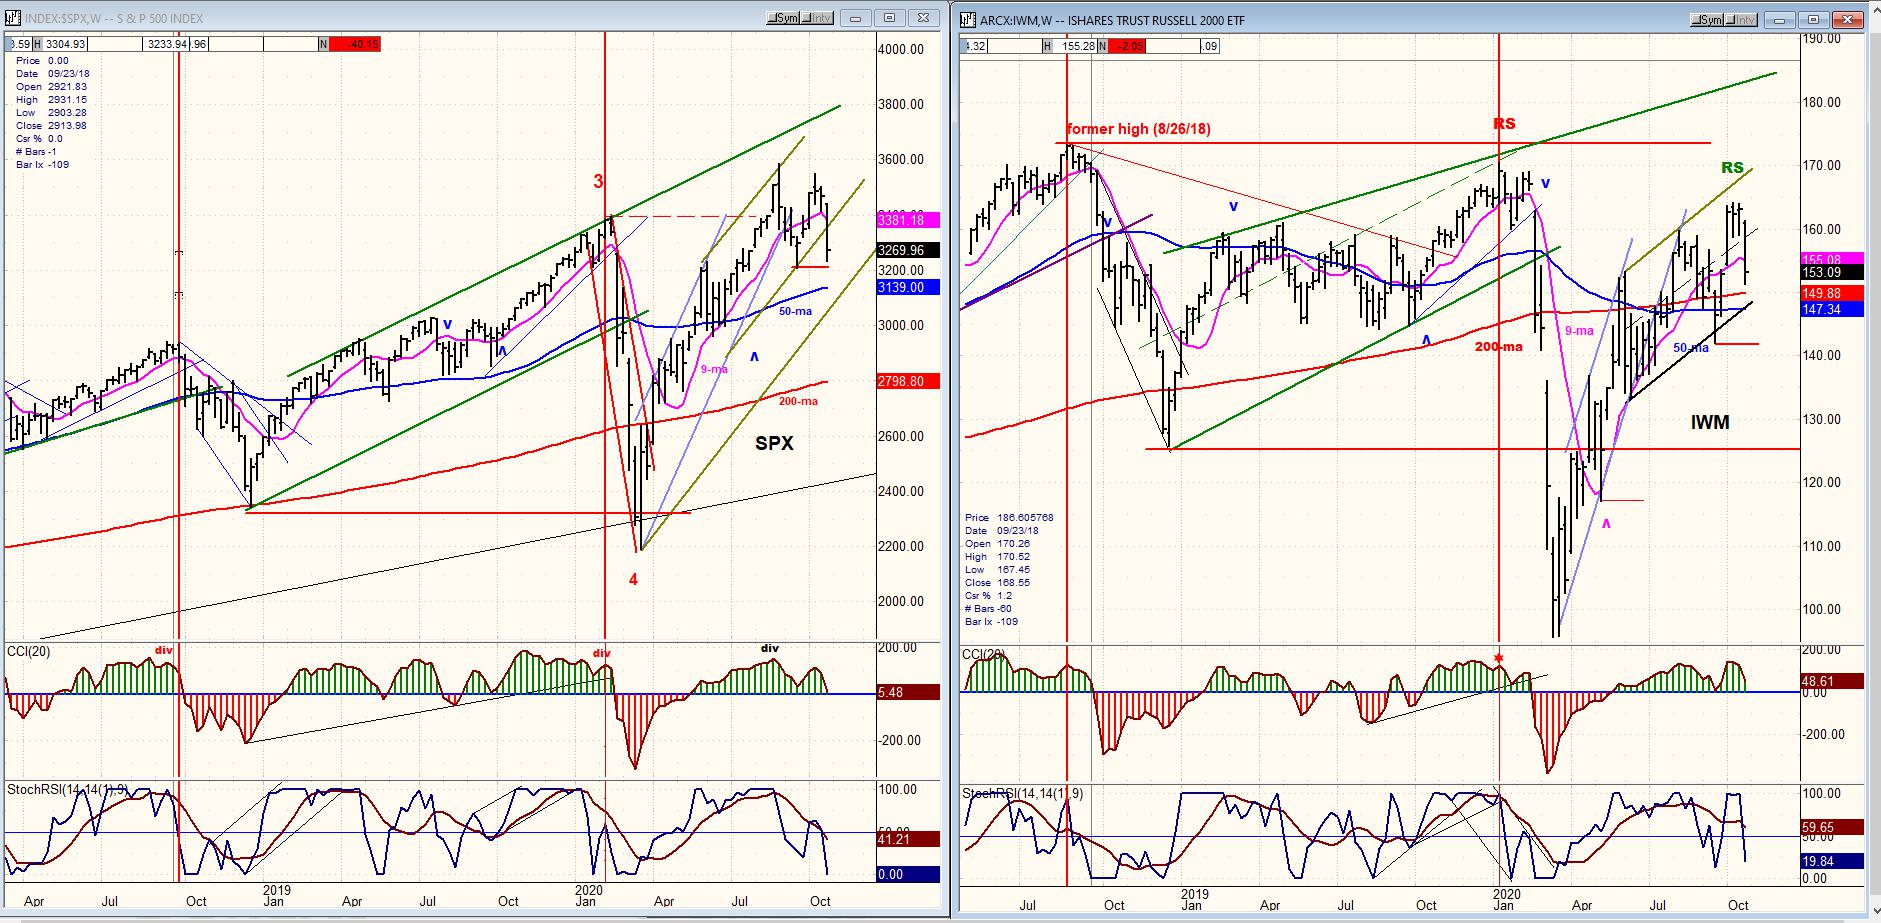
IWM (RUT EFF) is a proven leading indicator. When its relative strength is compared to SPX on an intermediate and long-term basis, it has a flawless track record, having forecasted major tops in 2000 and 2007, and more recently the 9/18 and 2/20 intermediate tops. It stands to reason that we should continue to follow its relative performance to SPX if we want to be warned about the next important market top, especially since it will very likely mark the end of the 2009 bull market.
For now, and in spite of the recent market weakness, the bulls do not have to worry. IWM is outperforming SPX over the short-term, telling us that the index is only undergoing a short-term correction which will resolve itself to the upside when it is complete – ostensibly by mid-November according to short-term cycles.
SPX daily chart
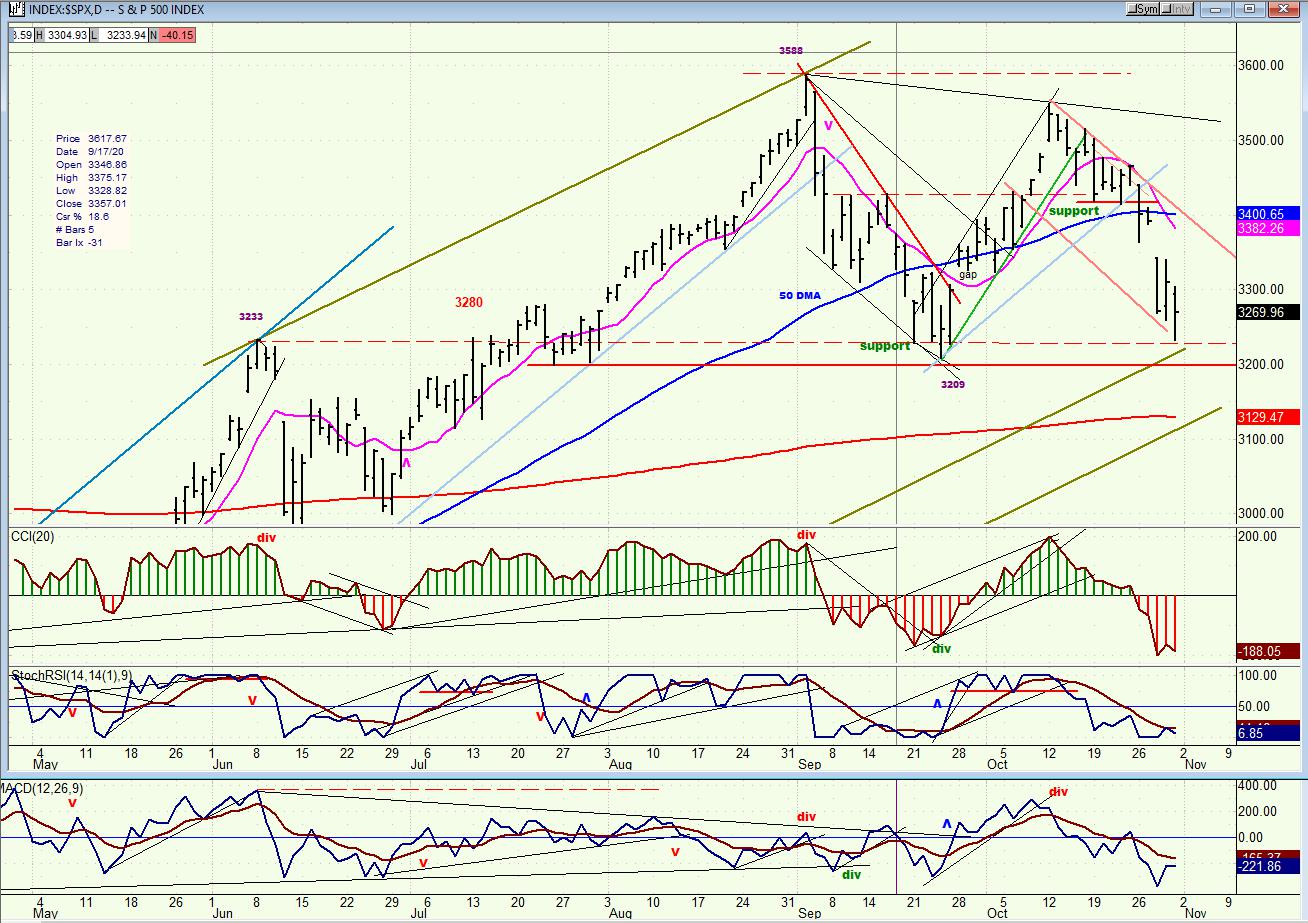
After some hesitation at the 3420 level, SPX opted to continue a decline which started from the 3550 level and arrived at 3234 on Friday, where it found support and bounced back to 3270 by the close. I had foreseen a near-term target for Friday’s move to 3230, but the index failed to reach it by a fraction.
Although Friday’s action, which ended with a good bounce at the end of the day suggests that a low has been struck, it is likely to be only a near-term bounce which could extend to 3320 if the short-term base which was created at the low is not extended on Monday. In any case, this should only be a minor rally which, after it is completed, should see SPX drop down to 3200-3180 and possibly lower on its next short-term down-phase.
I had expected to retrace back down to about 3050 (.382 retracement) before the end of this correction, but the P&F path to that level could be a bit of a stretch and it would have to take place by mid-November since this is when the next cycle low is due.
The indicators (oscillators-MAs) are not ready to signal a correction low, and you can see by the red channel on the chart, we would have to get out of it before the end of the correction is confirmed. After next week’s market action, we should have a much better insight into the market’s position.
SPX hourly chart
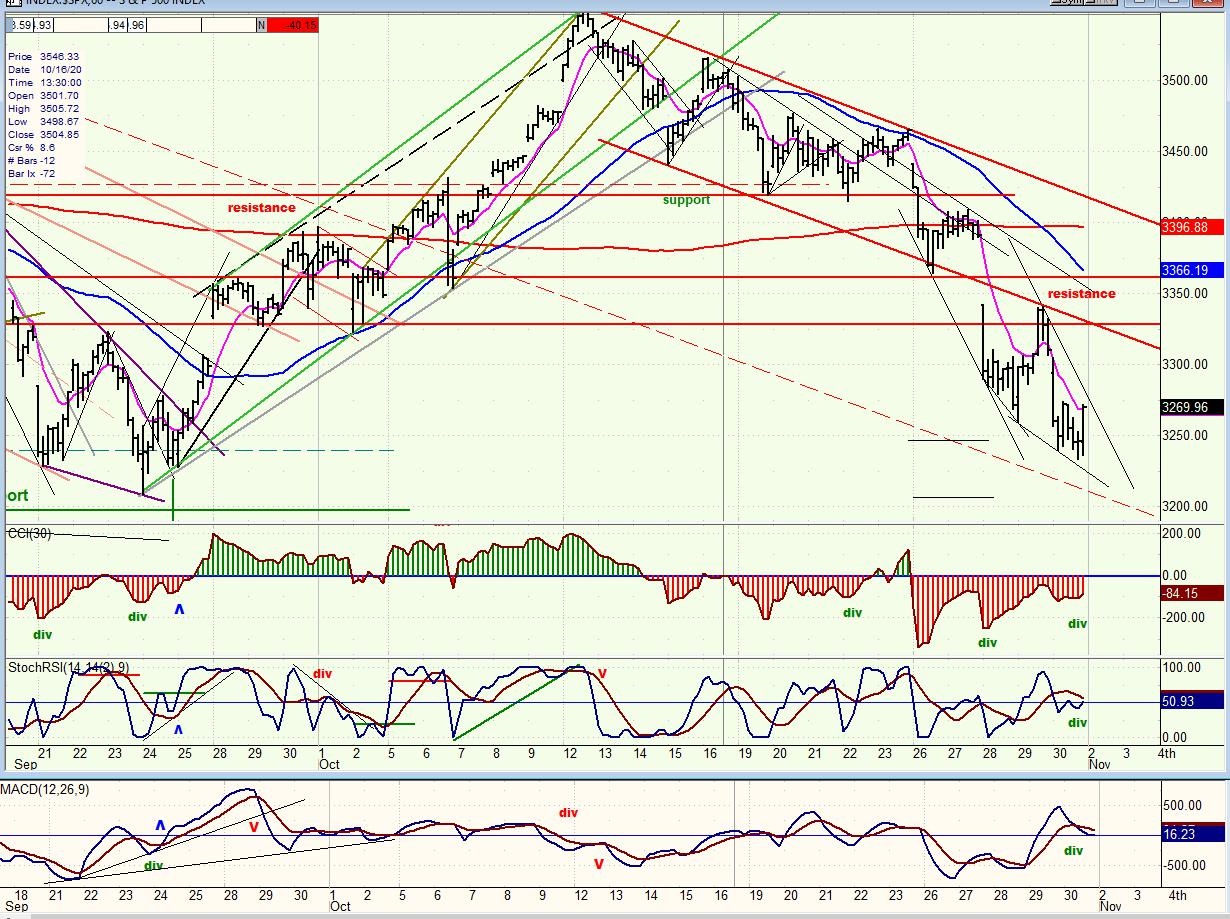
From the break of 3450, we could see that some deceleration was taking place into Friday since the index price was having more and more difficulty reaching the bottom of the secondary channel line. This is reflected in the positive divergence showing in the oscillators as they pulled away from their lows with the A-Ds registering the greatest returning strength. At the end of the session, enough buying appeared to drive prices higher into the close.
This action suggests that Friday’s bounce should continue into Monday with the most likely target being the heavy overhead, downward-slanting red line which, combined with the price zone between 3330 and 3360 should offer enough resistance to stop the uptick -- at least temporarily. Also, the short-term count from 3250 calls for a move to 3320. Whether we stop there or go a little higher, the most likely short-term scenario is for the correction to continue into the middle of November.
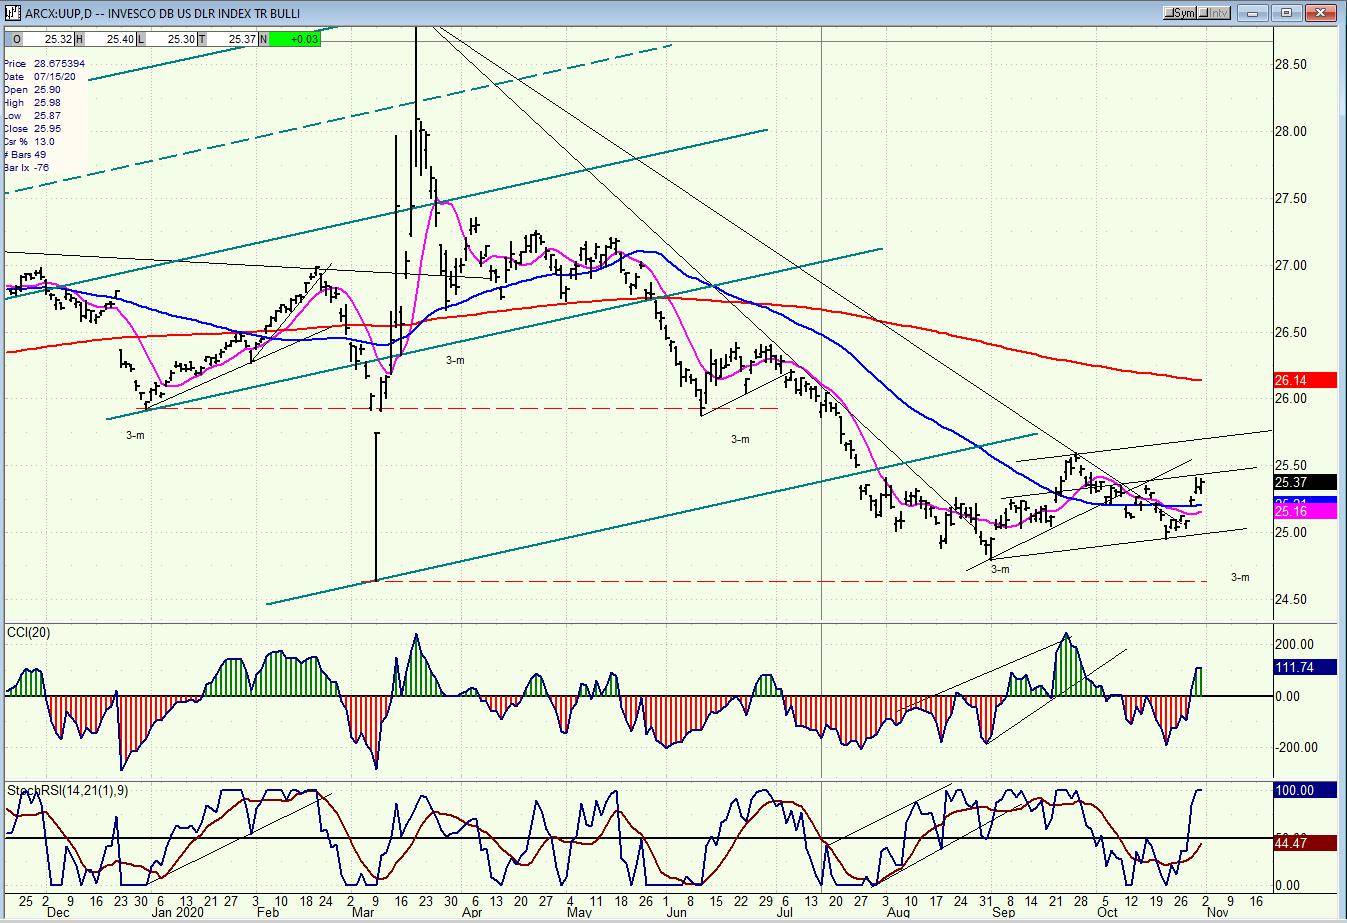
UUP (dollar ETF) ($USD chart not available from this data provider)
UUP is holding in a sideways move which should see another pull-back into its 3-mo cycle low before continuing the shallow incline pattern. This is probably a consolidation in a downtrend which will result in another retest of the low by the next 3-mo cycle (after the current one). It does not look as if much up or down movement is going to take place over the next few weeks.
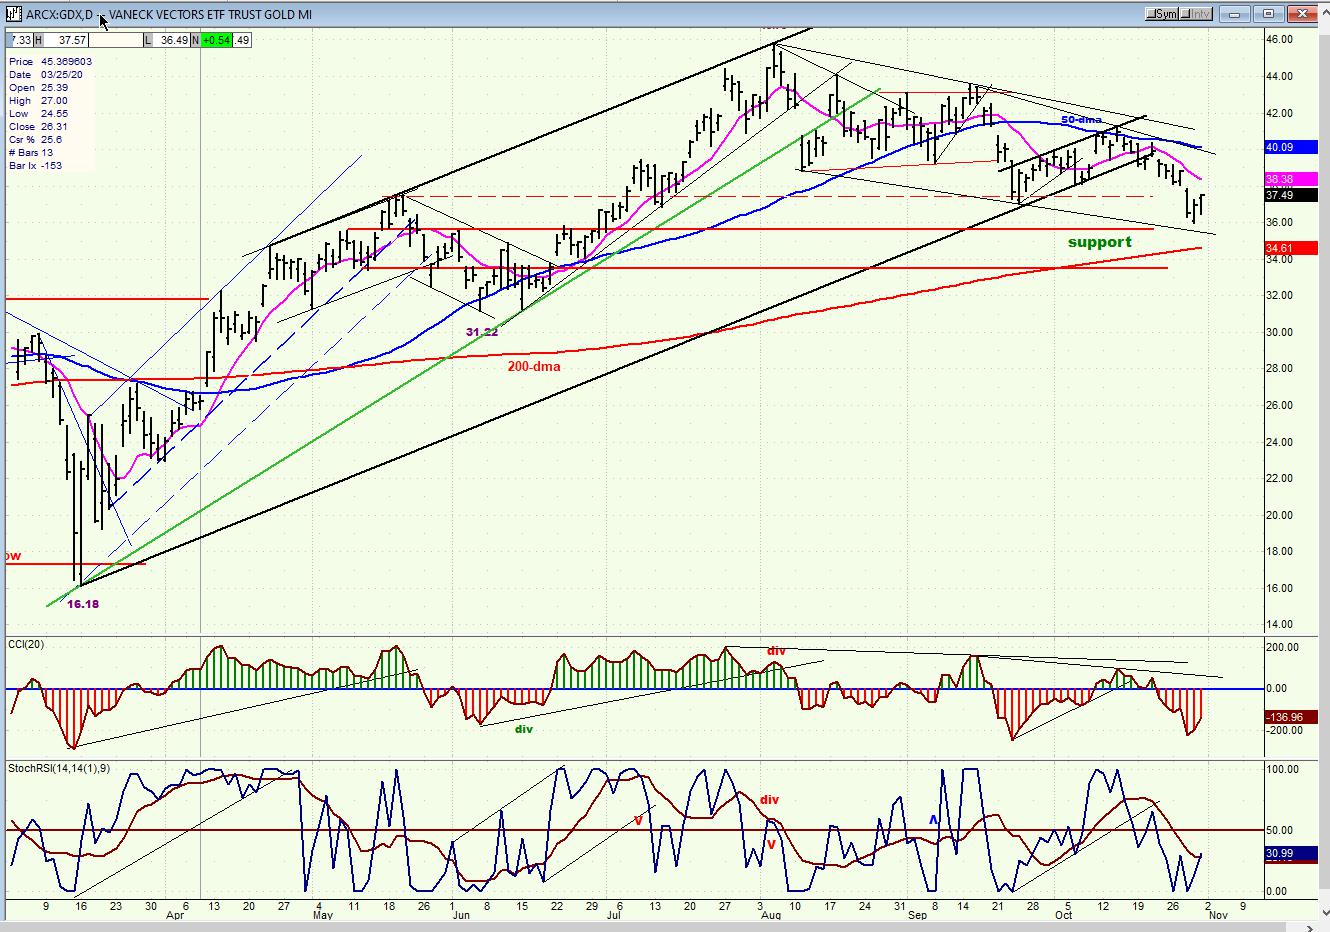
GDX (gold miners)
GDX continues to correct after breaking below its channel line. 34.50-35 is still likely to be reached before a new uptrend gets under way.
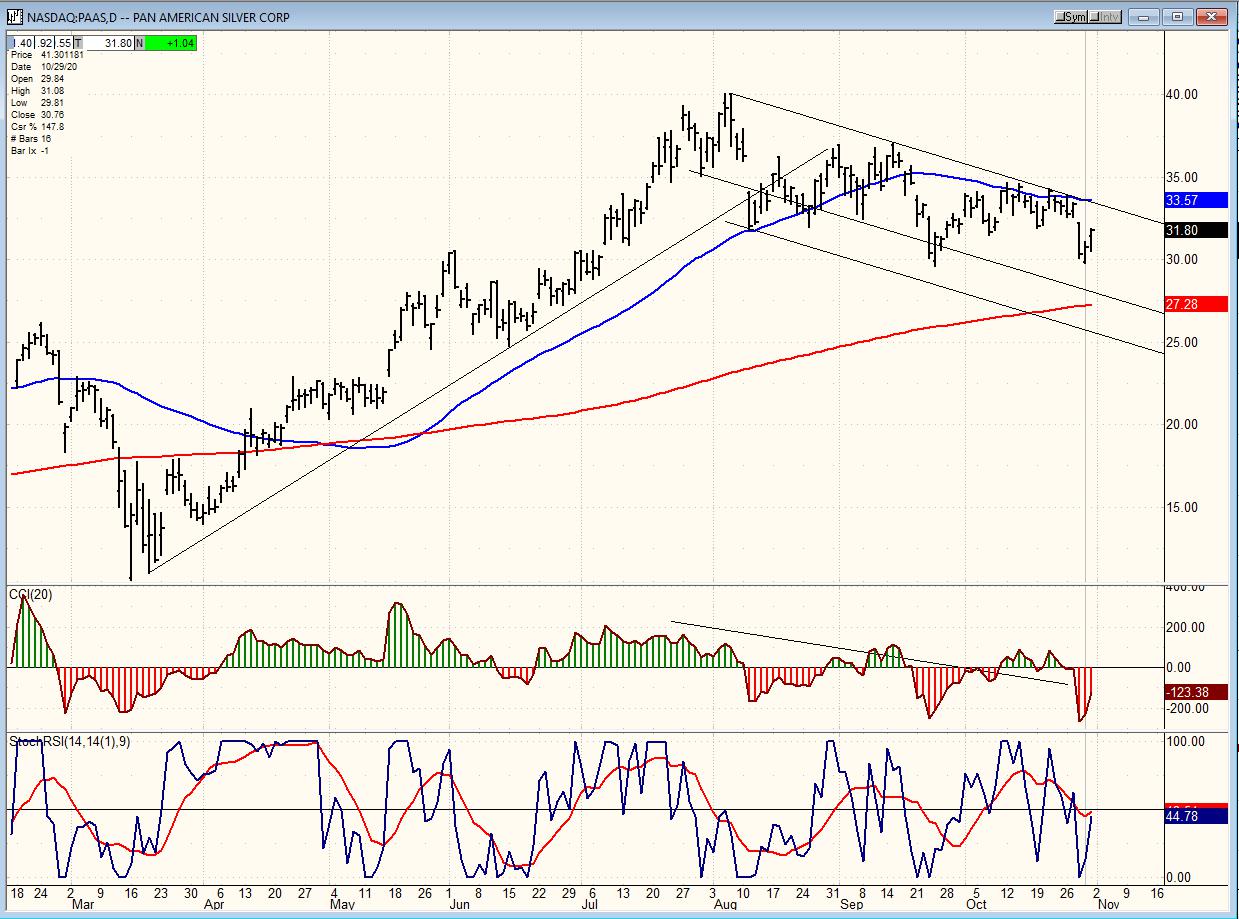
PAAS (Pan American Silver Corp)
PAAS is expected to continue a consolidation which is similar to that of GDX, but perhaps even more shallow. Both could end their correction in conjunction with a stock market low about the middle of November.
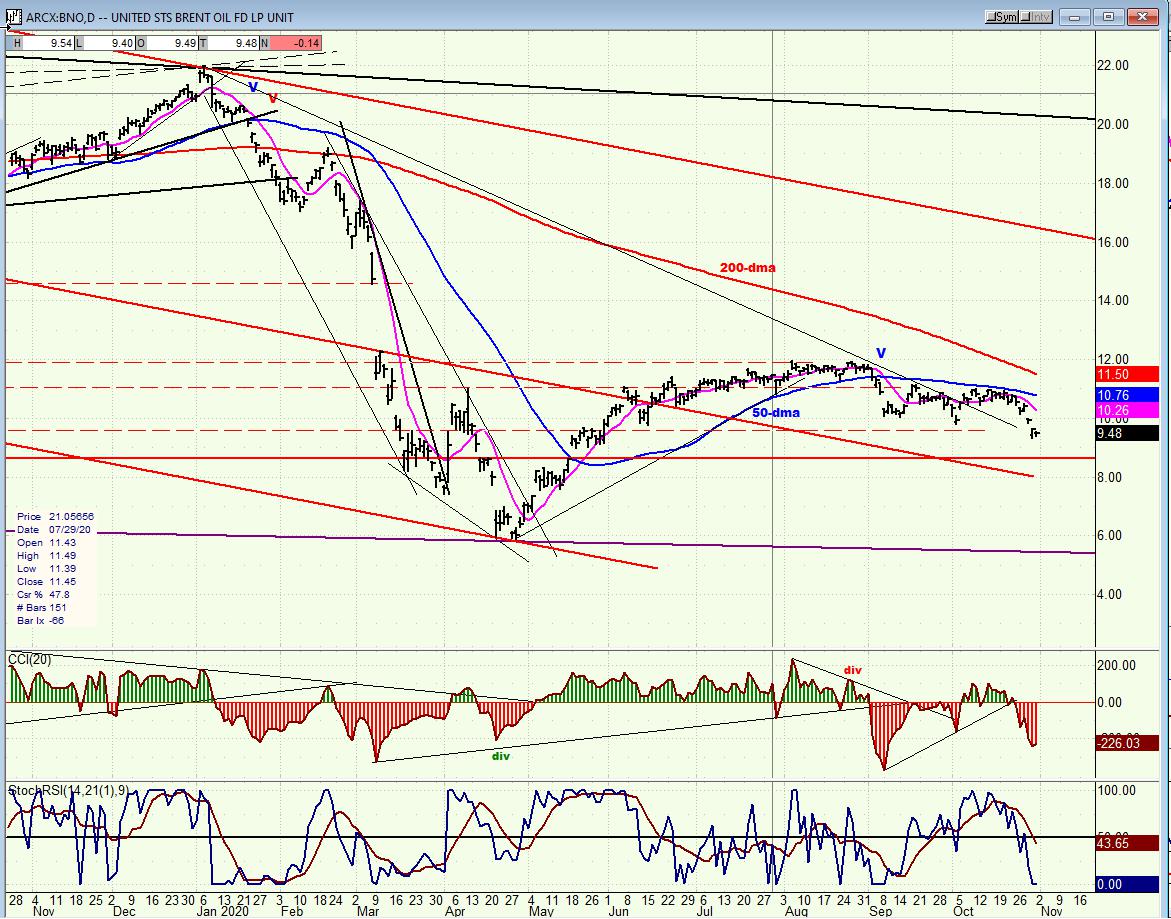
BNO (U.S. Brent Oil fund)
BNO continues to move in a sideways pattern which may turn out to be a small base when converted into a P&F chart, with little upside potential.
SUMMARY
SPX is in a corrective pattern which should continue at least into mid-November. There is an outside possibility that it could drop as low as 3050 by then.
NOTE: You may now view our new website at https://marketurningpoints.com
Free trial subscription
With a trial subscription, you will have access to the same information that is given to paid subscribers, but for a limited time-period. Over the years, I have developed an expertise in P&F charting (price projection), cycles (timing), EWT (structure), and general technical analysis which enables me to warn subscribers of pending reversals in market trends and how far that trend can potentially carry. For a FREE 2-week trial, subscription options and payment plans, I encourage you to visit my website at https://marketurningpoints.com
The above comments and those made in the daily updates and the Market Summary about the financial markets are based purely on what I consider to be sound technical analysis principles. They represent my own opinion and are not meant to be construed as trading or investment advice but are offered as an analytical point of view which might be of interest to those who follow stock market cycles and technical analysis.
********

When Andre Gratian was a stock broker years ago, a friend introduced him to technical analysis of the market. Consequently, it is not an exaggeration to say that Andre fell in love with this approach! Ever since then, it has become an increasingly important part of his professional life. Gratian has studied the works of Wyckoff, Edwards & Magee, Edward J. Dewey (cycles) and many others. However, one of my most profitable undertaking has probably been to study Point & Figure charting, which he finds invaluable in analyzing stocks and indices. If he were restricted to one methodology, this is the one that he would choose. This well-rounded background has given him what he feels to be a special insight into the stock market, facilitating the recognition of meaningful patterns and the ‘turning points’ in all trends, whether they be short or long term. Andre feels very comfortable discussing the stock market and passing on meaningful information to others. His subscribers include individuals and money managers throughout the world. Moreover, his Newsletters are currently published on several financial sites, here and abroad.


