Technical Analysis Of The Markets


"By the Law of Periodical Repetition, everything which has happened once must happen again, and again, and again -- and not capriciously, but at regular periods, and each thing in its own period, not another's, and each obeying its own law... The same Nature which delights in periodical repetition in the sky is the Nature which orders the affairs of the earth. Let us not underrate the value of that hint." ~ Mark Twain
Current Position of the Market
SPX Long-term trend: For now, the best guesstimate is that we are still in the bull market which started in 2009. Where we go from here and how far, will be gauged after the September-November correction.
SPX Intermediate trend: Intermediate correction may have ended.
Analysis of the short-term trend is done daily with the help of hourly charts. It is an important adjunct to the analysis of daily and weekly charts which discuss longer market trends.
Correction curtailed by Election
Cycles: Looking ahead! 90-yr cycle – last low: 1932. Next low: 2022
7-yr cycle – last low: 2016. Next low: 2023
New minor low about mid-November.
Market Analysis (Charts courtesy of QCharts
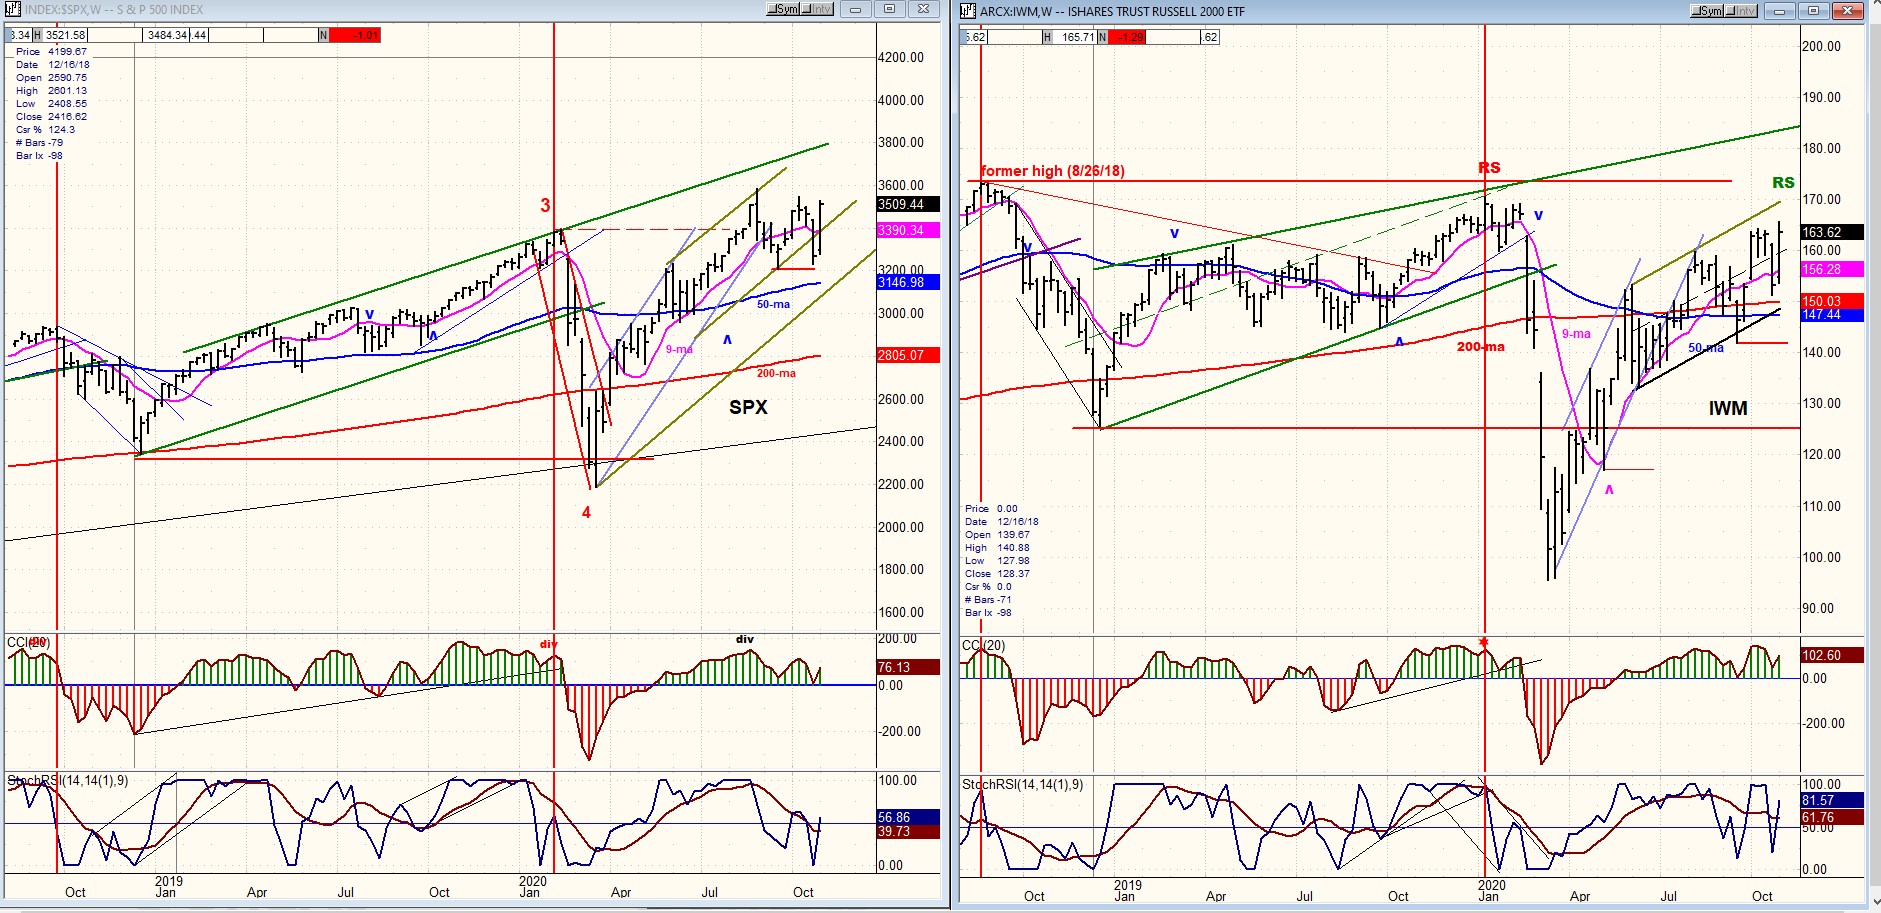
SPX-IWM weekly charts
The forte of IWM as a leading indicator is to show relative weakness to SPX at the top of an intermediate or long term market move. Comparing the two indexes in the charts posted below, we can plainly see that IWM substantially lagged SPX at the 2/20 high; not only at the intermediate level (vs the 10/18 high) but also at the short term level, whereby IWM topped a full month before SPX.
Today, IWM continues to lag SPX over the long term time frame, but the former is outpacing SPX over the short term. The long term lag by IWM could be warning us of a major high over the next few weeks; but its relative strength over the near term appears to tell us that there will be more market strength going into the bull market top.
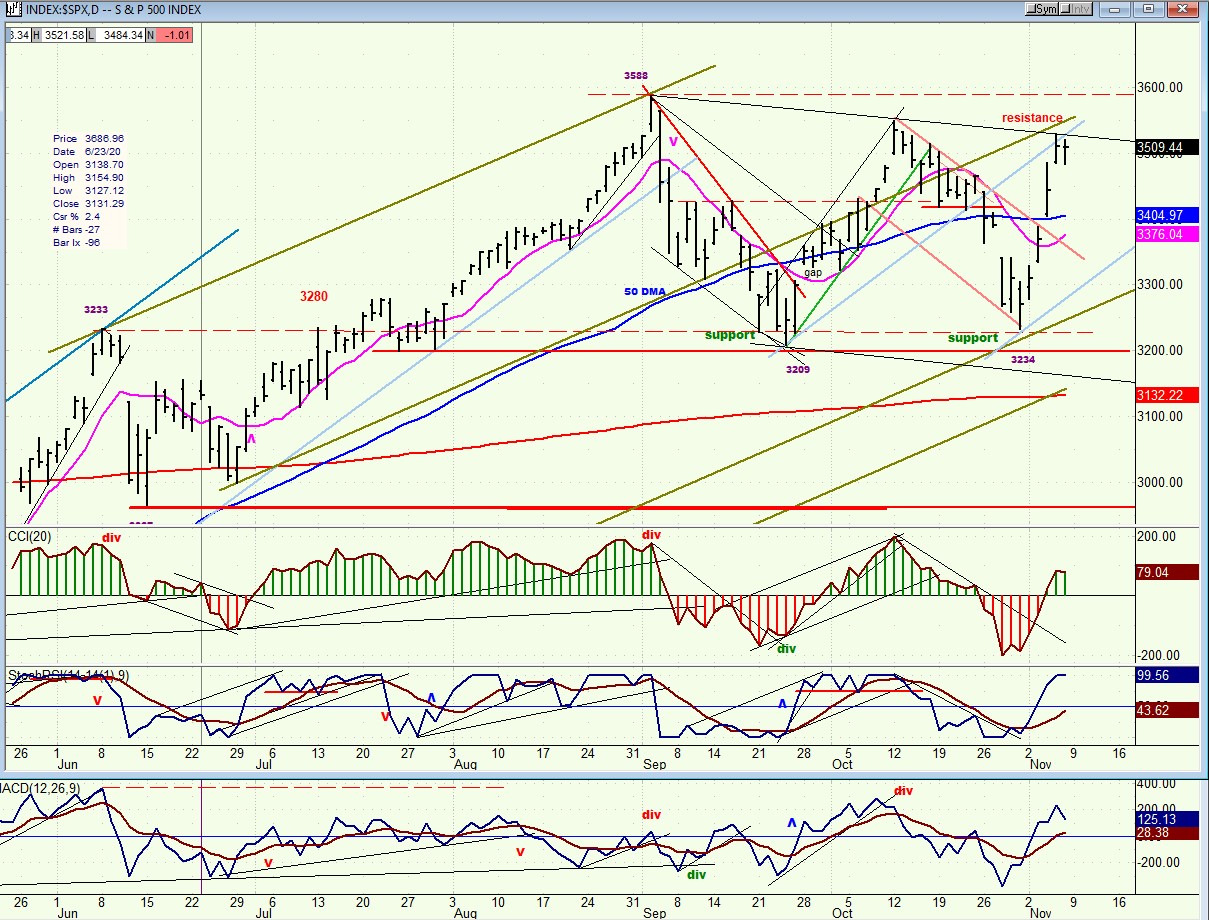
SPX daily chart
There was a good possibility that SPX would continue to correct into the 11/9-16 cycle low, and perhaps go all the way down to 3050 before finding an intermediate bottom to finish the correction which started from 3588. External events can often disrupt cycles, and in this case, it was the national election -- or more specifically, the results of the election which altered the time frame, but perhaps only temporarily.
One can still make the case for the correction to extend into 11/16. When it held just above 3230, SPX created a congestion level which gave us enough of a count on the P&F chart to project the next short-term move to ~3520. This was achieved on Thursday and in the short span of time since then, new congestion representing a potential 80-point move has already formed. Since the near-term is still undecided, Monday’s session will determine if we are tracing out a short-term top before pulling back into the low of the next short-term cycle, or if we push higher first.
Like the price pattern, indicators are not giving us a complete picture and we’ll have to wait for Monday’s session to clarify the near-term price trend.
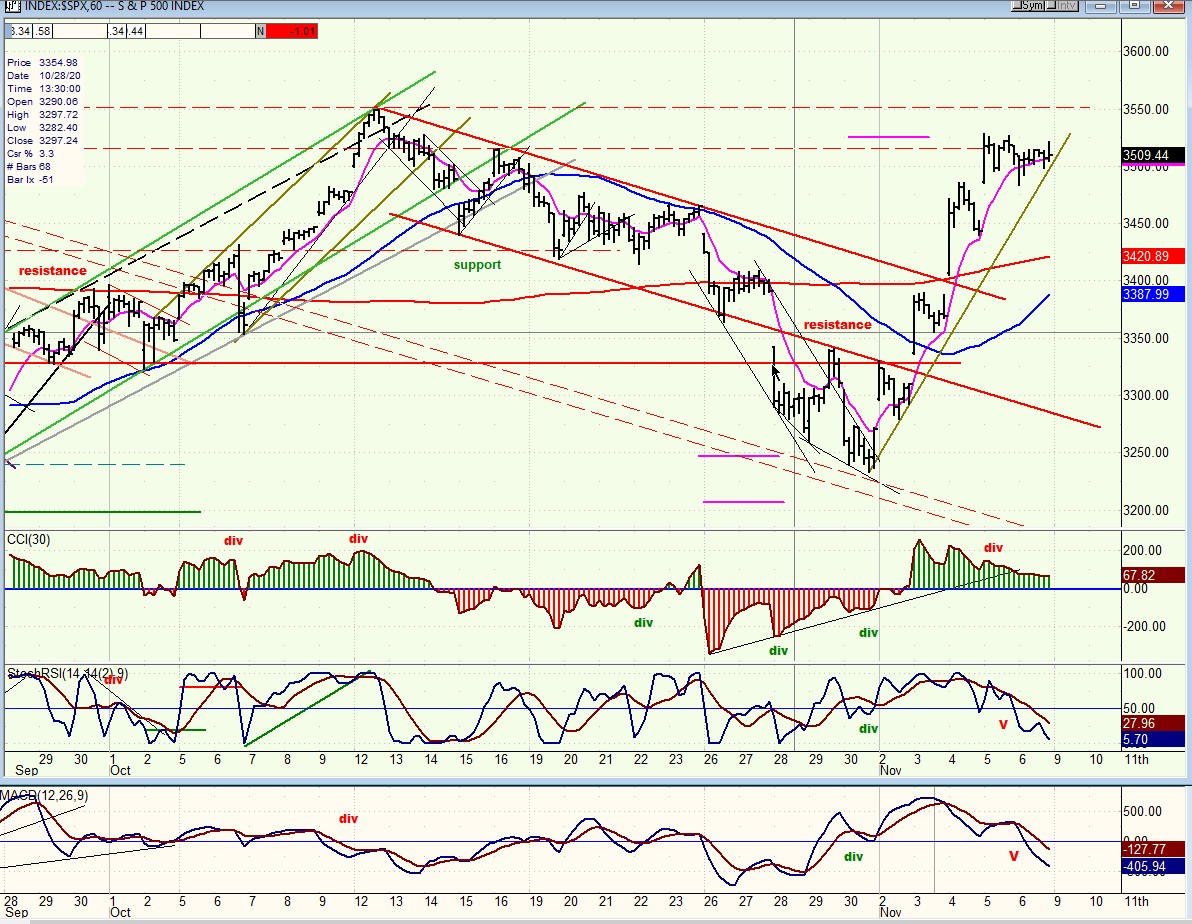
SPX hourly chart
Looking at the hourly chart, a consolidation pattern became well-established after the index met its 3520 projection. By Friday, prices had progressed to the short-term trend line and futures trading after the close kept them at the same level. This means that the index will have to wait until Monday to decide if to wants to push higher or break the trend line and roll over; in which case an extension of the move into 11/16 is possible.
The daily indicators show an inclination to consolidate. This is much more obvious in the 60m oscillators, two of which had already given a sell signal by Friday’s close and negative divergence was showing in the third. A break below the zero line in the CCI would strongly suggest that the cycle is turning the index down, with a good possibility that it will continue to trend lower for the rest of the week. Next week will need to confirm that a temporary high has been met and that a near-term pull back is starting.
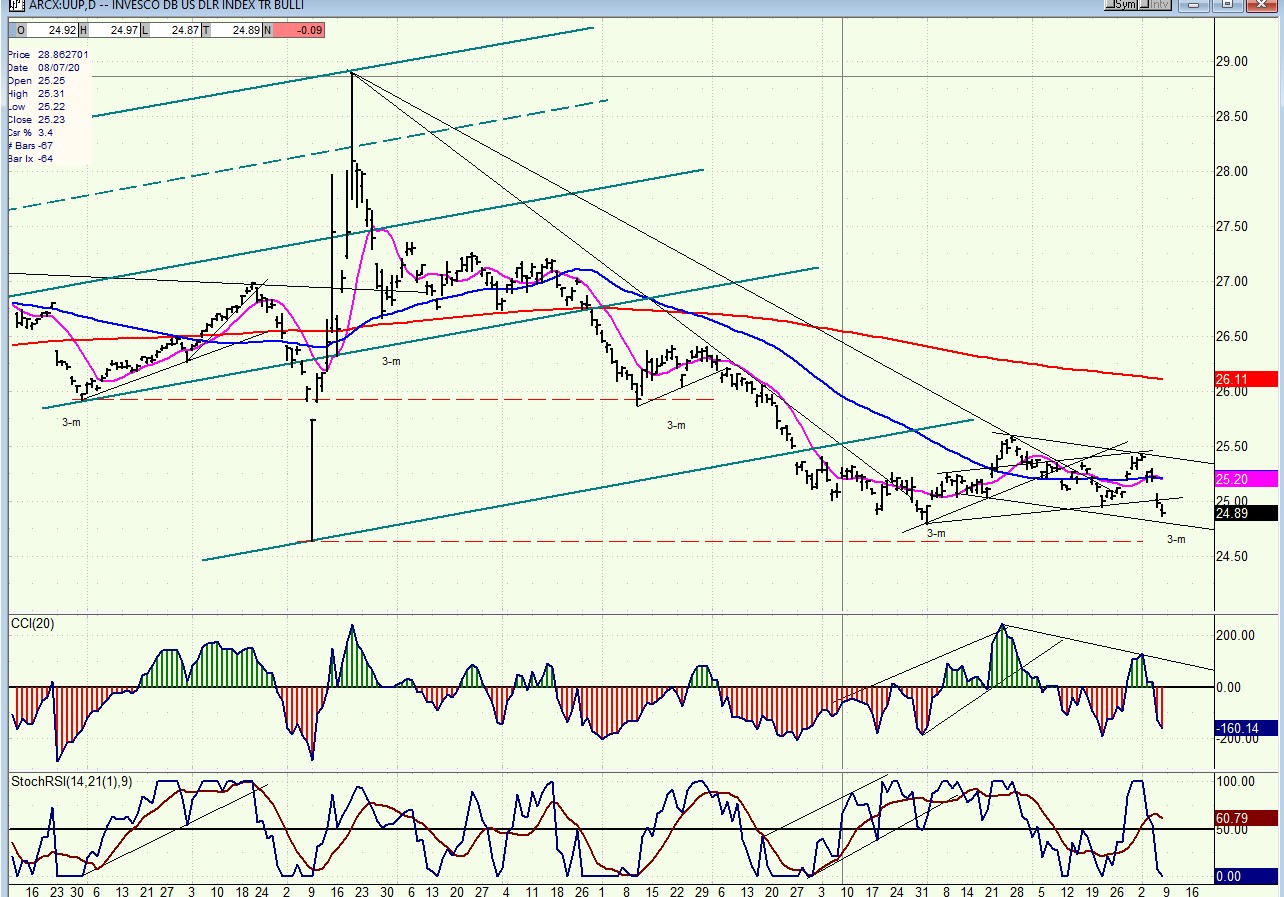
UUP (dollar ETF) ($USD chart not available from this data provider)
Like clockwork, UUP is dropping into its 3-mo cycle low and should rally after it turns up. The two consecutive 3-mo cycles should make a double-bottom holding at the level of the early March low. This suggests that some strength may be returning to the dollar…and that it could experience a better rally in the next 3-mo cycle uptrend.
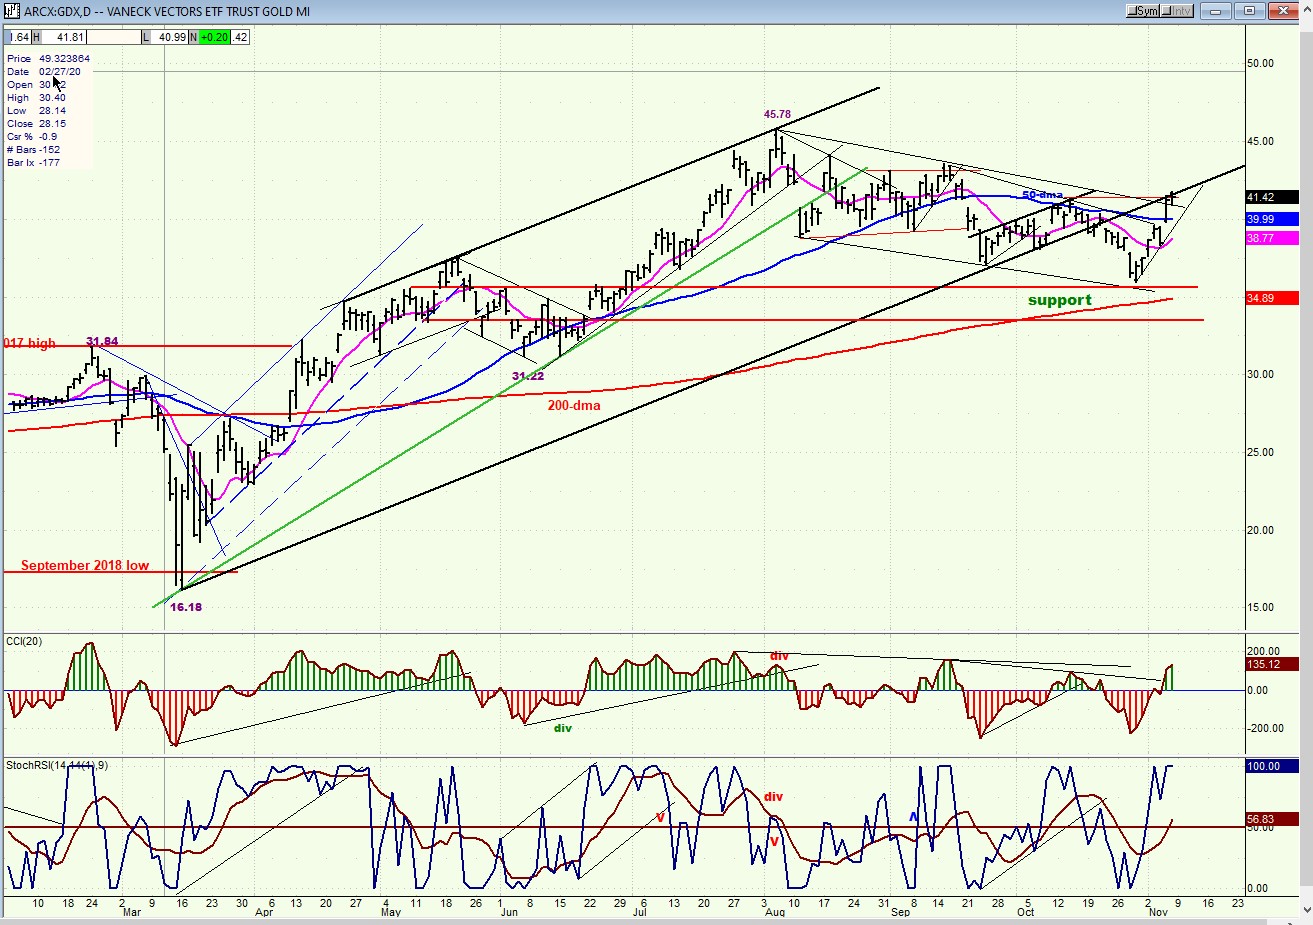
GDX (gold miners)
GDX has benefited from the little spurt of weakness in UUP with a 5-point rally from its correction low of 36.00. While this could be a break-out which is putting an end to its consolidation, it would appear more conclusive if there was a mild pull-back followed by a resumption of a new uptrend. The recent strong rally in gold was undoubtedly helped by a weak dollar. If the dollar is now firming, the metals will not get much help from that sector over the short-intermediate term.
Technically, GDX has only rallied to the broken channel line in a three-wave pattern. It will have to improve on that structure to appear more bullish.
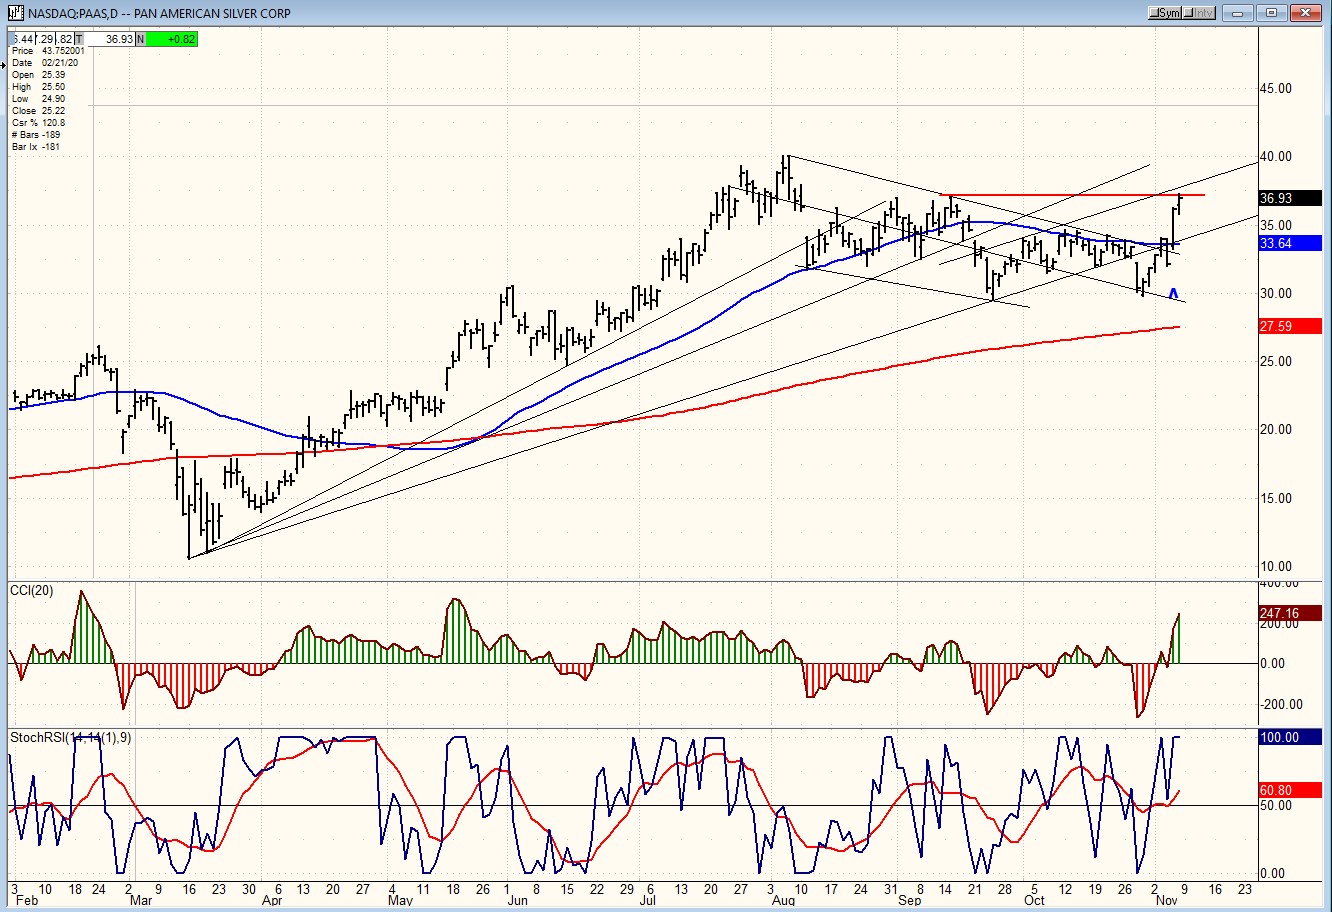
PAAS (Pan American Silver Corp)
PAAS is telling us that it is a little stronger than GDX, but the same rationale applies. A pull-back followed by another move higher is necessary to confirm that the stock is breaking out. Barring that, a re-test of the low over the next couple of weeks is possible.
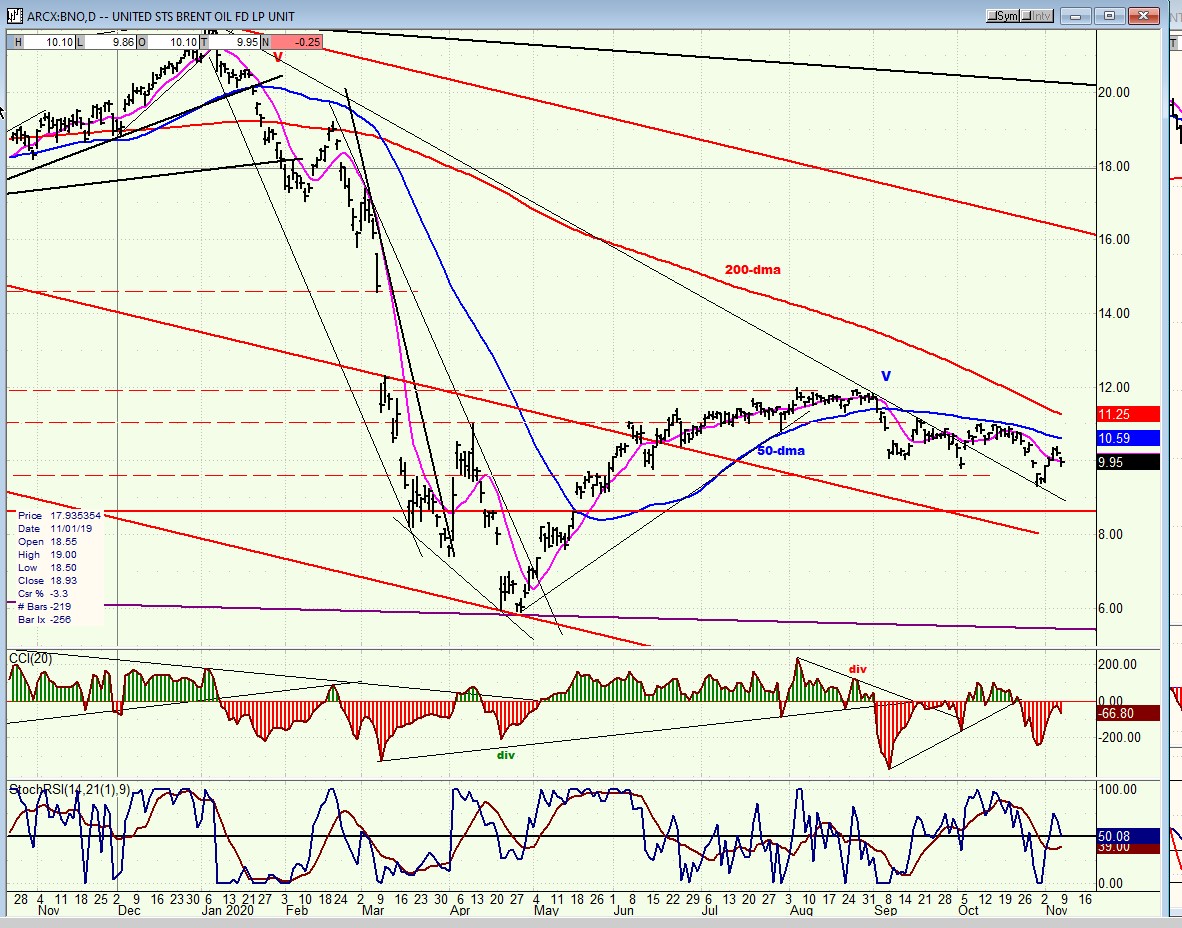
BNO (U.S. Brent Oil fund)
BNO found support on a declining trend line and bounced but is already pulling back. It would have to move above its blue 50-dma to re-establish an uptrend.
SUMMARY
The correction could have gone longer and lower before reversing. Furthermore, it may still go longer with the minor cycle lows due on about 11/16. That scenario does not prevent the index from trying for a slightly higher high, first.
NOTE: You may now view our new website at https://marketurningpoints.com
Free trial subscription
With a trial subscription, you will have access to the same information that is given to paid subscribers, but for a limited time-period. Over the years, I have developed an expertise in P&F charting (price projection), cycles (timing), EWT (structure), and general technical analysis which enables me to warn subscribers of pending reversals in market trends and how far that trend can potentially carry. For a FREE 2-week trial, subscription options and payment plans, I encourage you to visit my website at https://marketurningpoints.com
The above comments and those made in the daily updates and the Market Summary about the financial markets are based purely on what I consider to be sound technical analysis principles. They represent my own opinion and are not meant to be construed as trading or investment advice but are offered as an analytical point of view which might be of interest to those who follow stock market cycles and technical analysis.
*********

When Andre Gratian was a stock broker years ago, a friend introduced him to technical analysis of the market. Consequently, it is not an exaggeration to say that Andre fell in love with this approach! Ever since then, it has become an increasingly important part of his professional life. Gratian has studied the works of Wyckoff, Edwards & Magee, Edward J. Dewey (cycles) and many others. However, one of my most profitable undertaking has probably been to study Point & Figure charting, which he finds invaluable in analyzing stocks and indices. If he were restricted to one methodology, this is the one that he would choose. This well-rounded background has given him what he feels to be a special insight into the stock market, facilitating the recognition of meaningful patterns and the ‘turning points’ in all trends, whether they be short or long term. Andre feels very comfortable discussing the stock market and passing on meaningful information to others. His subscribers include individuals and money managers throughout the world. Moreover, his Newsletters are currently published on several financial sites, here and abroad.


