Technical Analysis Of The Markets


Current Position of the Market
SPX Long-term trend: There is some good evidence that we are still in the bull market which started in 2009.
SPX Intermediate trend: New intermediate uptrend underway.
Analysis of the short-term trend is done daily with the help of hourly charts. They are important adjuncts to the analysis of daily and weekly charts which discuss longer market trends.
Short-term correction
Cycles: Looking ahead! 90-yr cycle – last low: 1932. Next low: 2022
7-yr cycle – last low: 2016. Next low: 2023
Market Analysis (Charts courtesy of QCharts
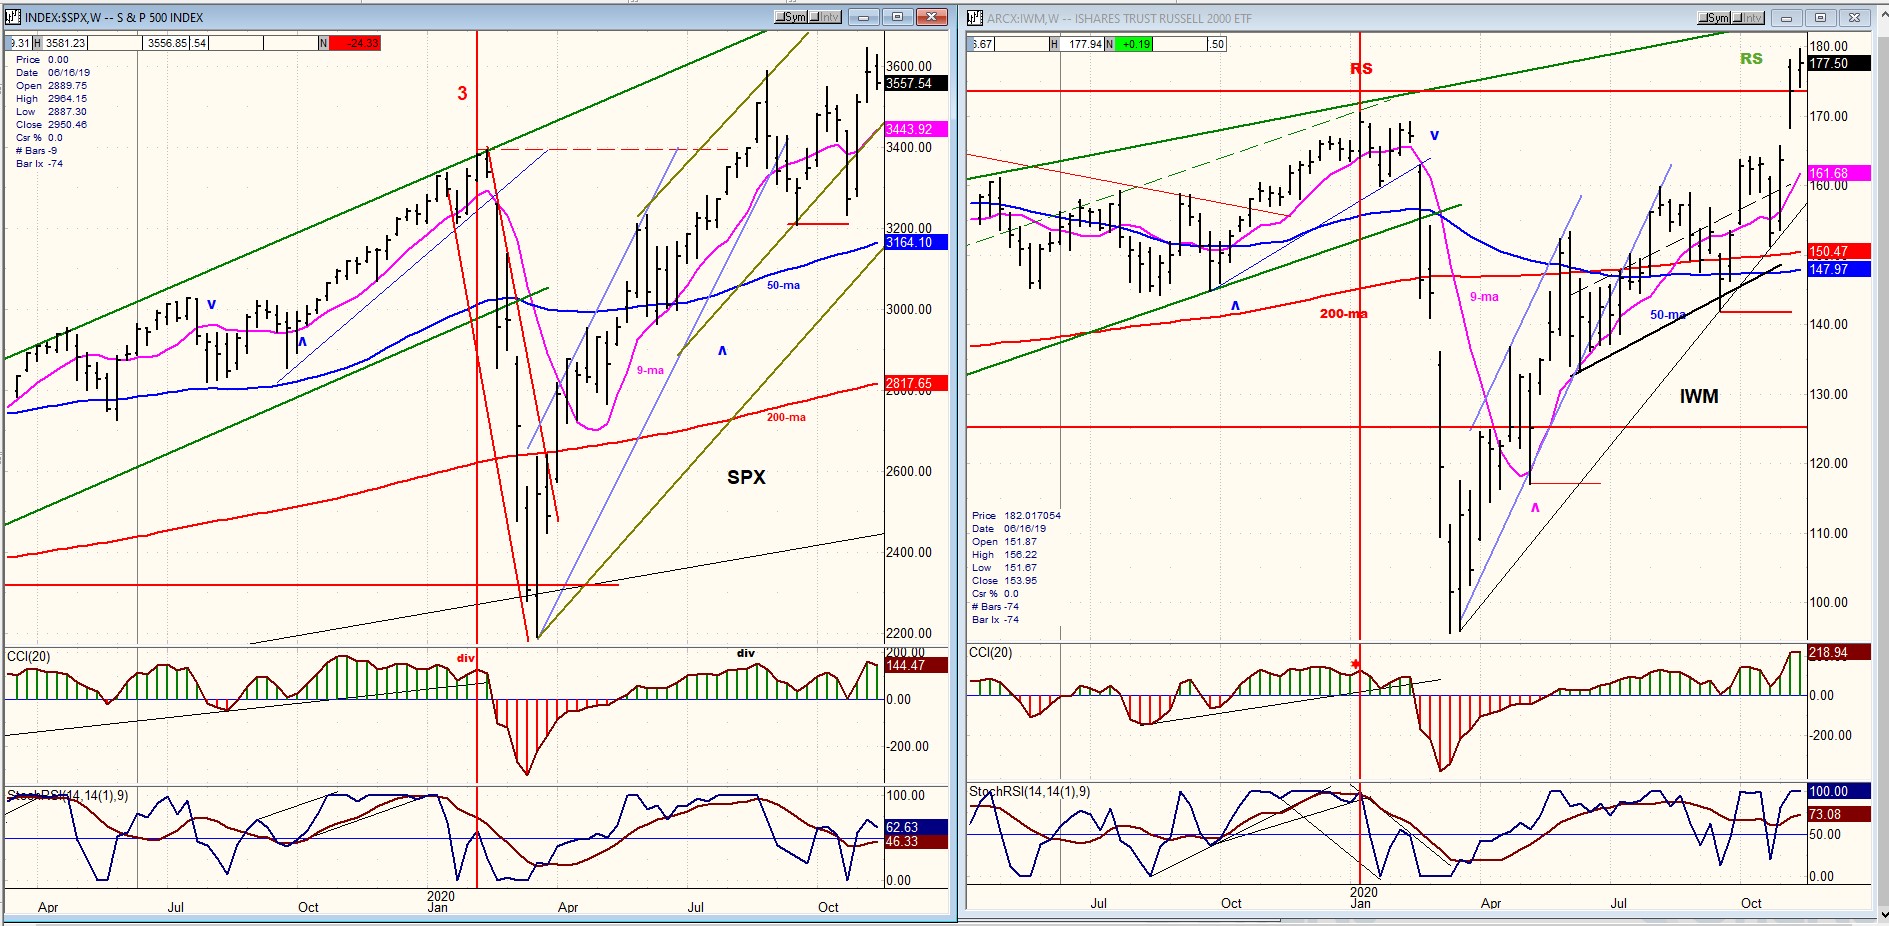
SPX-IWM weekly charts
IWM continues to lead SPX in relative strength over the short-term, suggesting that although a short-term correction is underway, the index should see higher prices as the bull market uptrend continues to unfold.
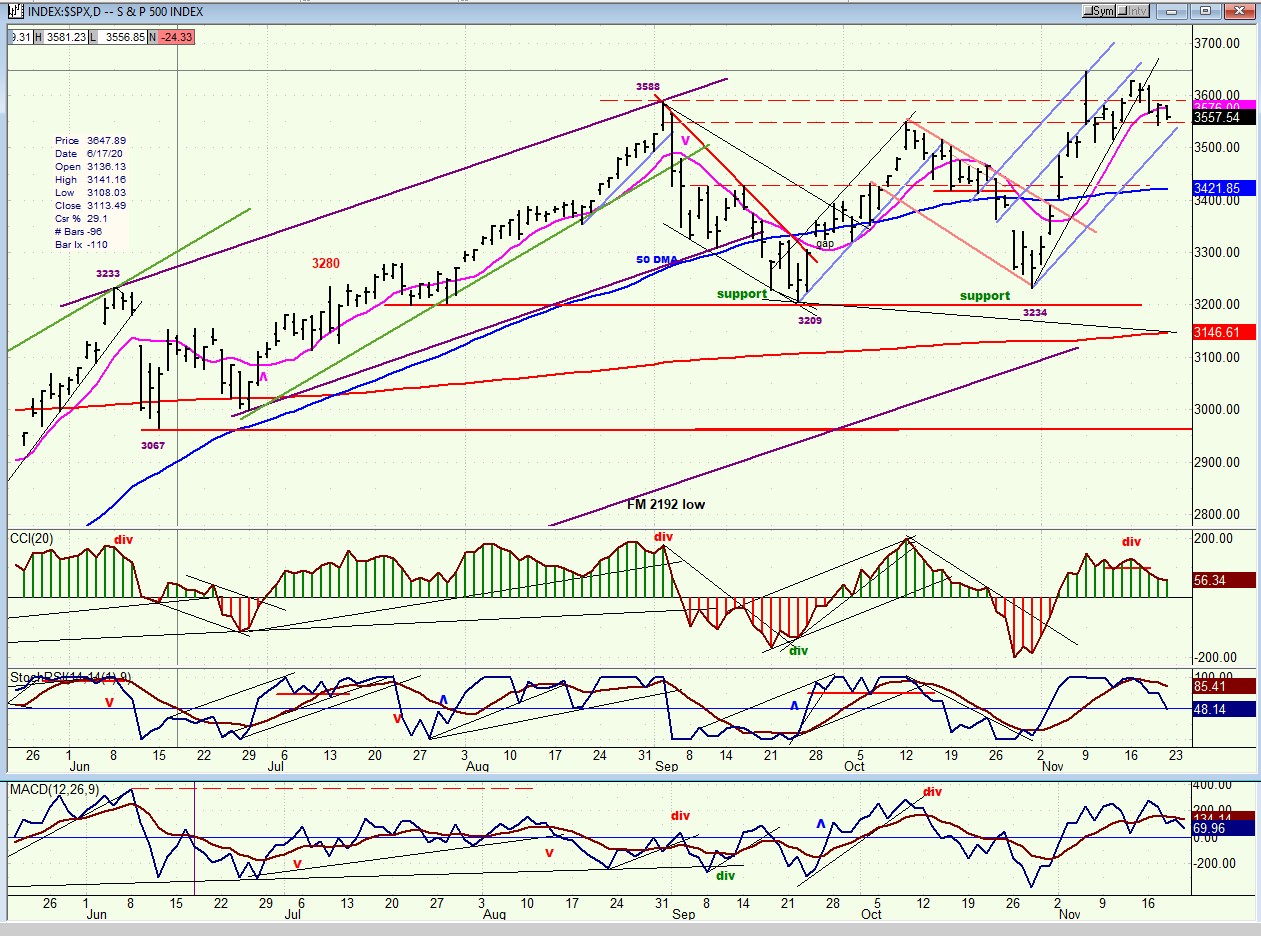
SPX daily chart
After reaching 3588, SPX corrected for exactly two months before starting a new intermediate uptrend which already made a new all-time high when it printed 3646 on 11/08. It has, since then, started a short-term correction which has so far resulted in a sideways pattern holding above the 3512 low. This low may be broken over the next couple of weeks if the correction decides to extend to a .382 retracement of the first phase of the new uptrend which measured 412 points. In that case, the pull-back would decline to 3488, and perhaps even to 3439 if the index decides on a 50% retracement. Since we already have a potential matching projection from the congestion pattern that has formed on the P&F chart, I am going to make 3439 my preferred correction low for now. (revisions permitted)
Warnings that we were entering a corrective phase came from the CCI when it developed some negative divergence on the first high and re-affirmed it on the re-test of that high. All we need for an absolute confirmation that the correction will deepen is for the blue trend line to be penetrated on the downside. This should turn all three oscillators negative. We should then wait out the correction which will come to an end when positive divergence re-appears in the oscillators.
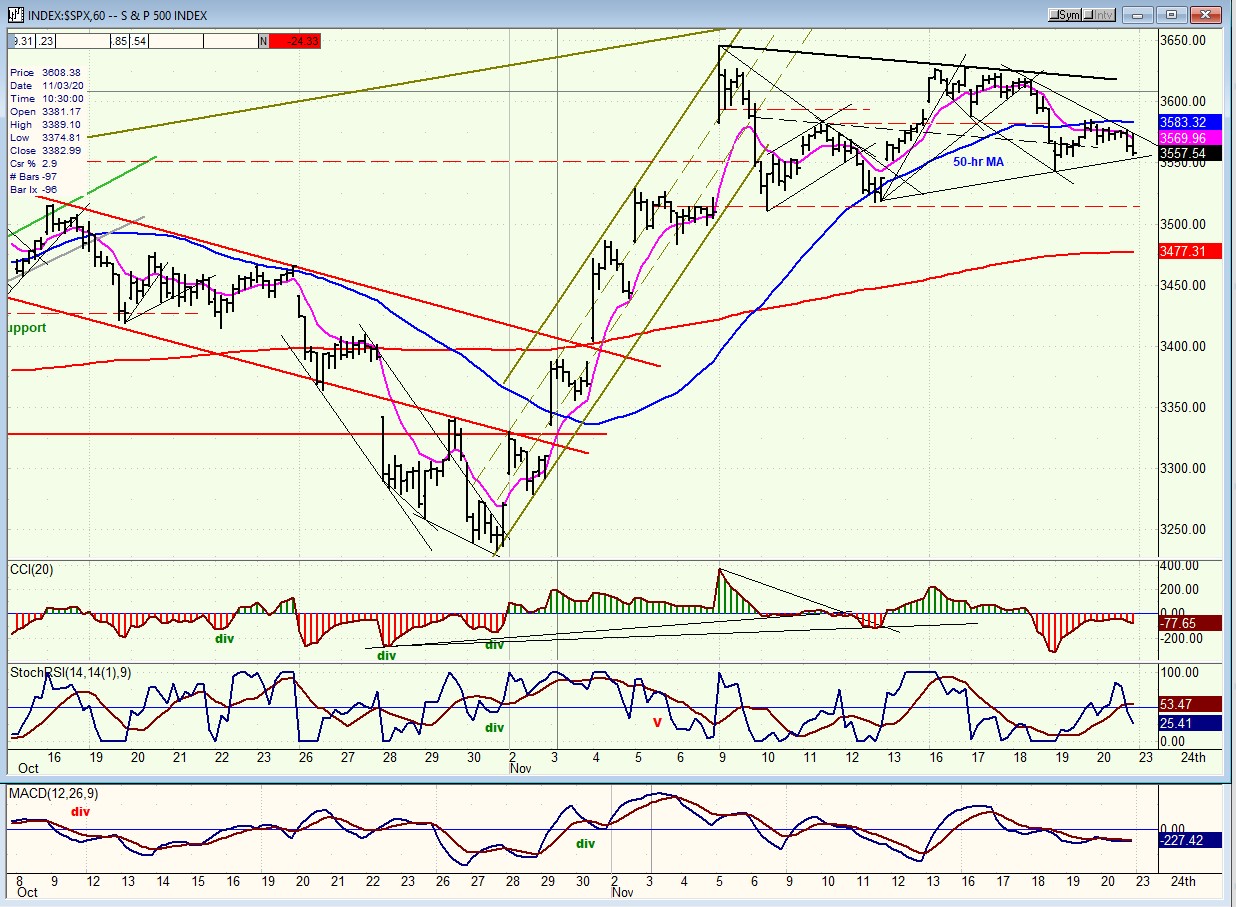
SPX hourly chart
After an initial rally high to 3646, SPX had a sharp but mild pull-back to 3512 -- a level corresponding to the small consolidation phase to its left which provided support. This occasioned a bounce, and then a test of the 3512 level which held and led to a re-test of the high, which also held. It is possible that the correction will remain in the shallow range that it has already formed above the first pull-back; but if that does not hold, we should look to the downside targets mentioned above to be filled.
One reason to expect additional weakness is that, while the initial pull-back held above the 50-hr MA, the latter was broken a couple of days ago and subsequently re-tested in an attempt to push prices back above it which failed while the CCI remained negative as well as the A-Ds. SRSI made an attempt at resuming its uptrend but could not take the other indicators along with it and caved in at Friday’s close. This leaves Monday to decide if the trend line across the minor bottoms holds, or if price slices through it. If SPX breaks that trend line it would bring it back to the area of the double-bottom with an even greater decision to make: does it hold once more, or does it drop below?
In order to get back into an uptrend, SPX would have to rise above the blue MA again. With the sideways move, it has flattened and must be kept from rolling over. If it does roll over, it will mean that hourly prices are beginning a downtrend, and most likely headed for the lower projections.
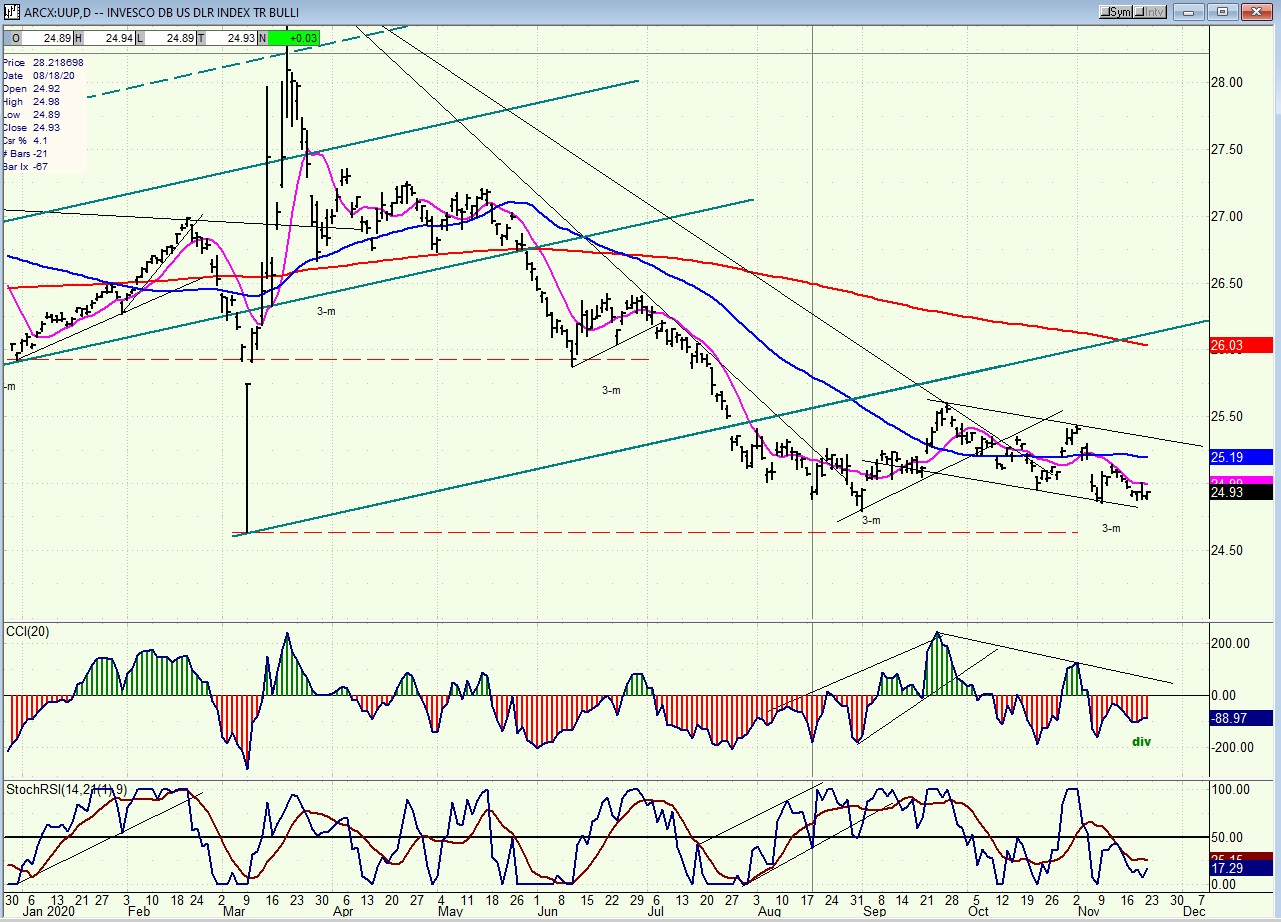
UUP (dollar ETF) ($USD chart not available from this data provider)
UUP made its low at the time of the 3-mo cycle bottom, bounced, and has re-tested the low, which held. Positive divergence in the momentum indicators suggest that the index could develop an uptrend from this level. It has remained above its previous 3-mo cycle low, thus exhibiting some trend deceleration, and has made what could be construed as a base pattern over the past three months. Its challenge will be to get above the blue MA and move outside of its channel.
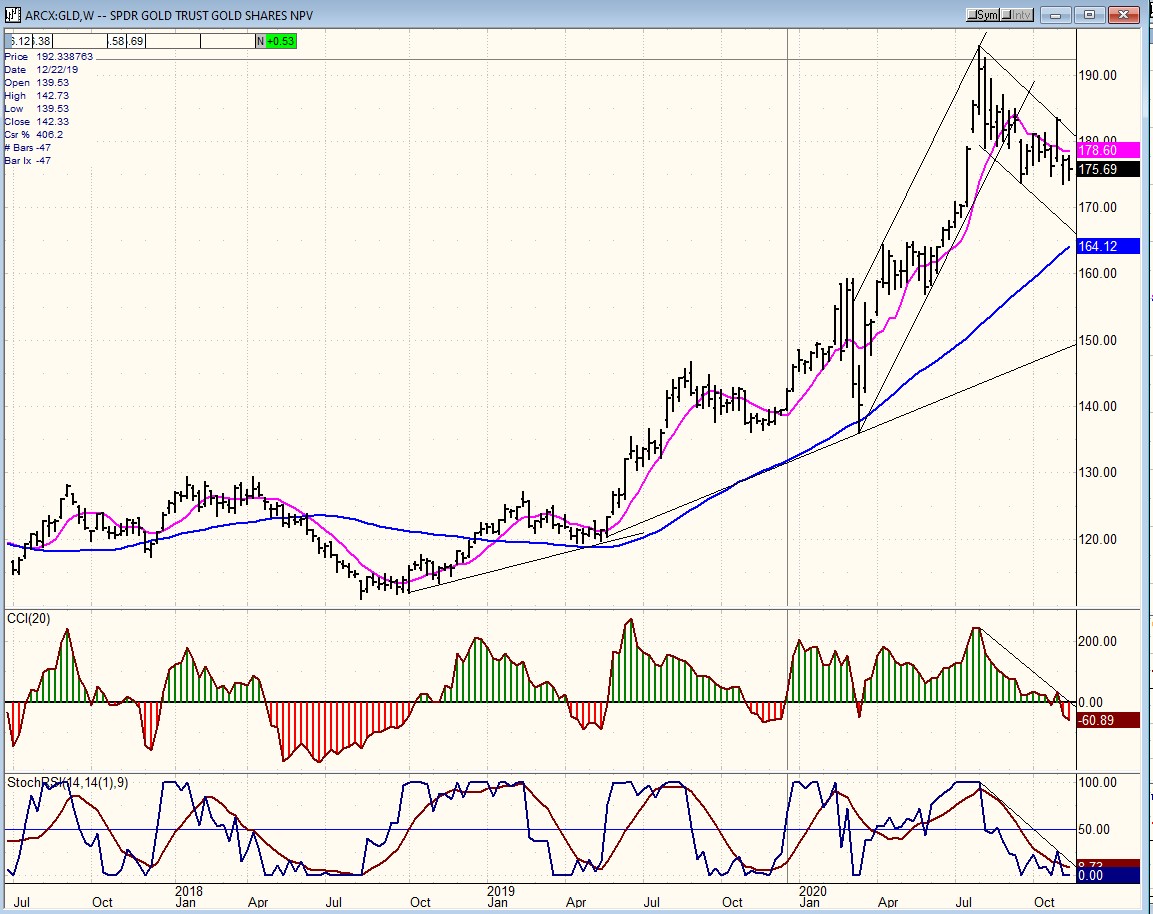
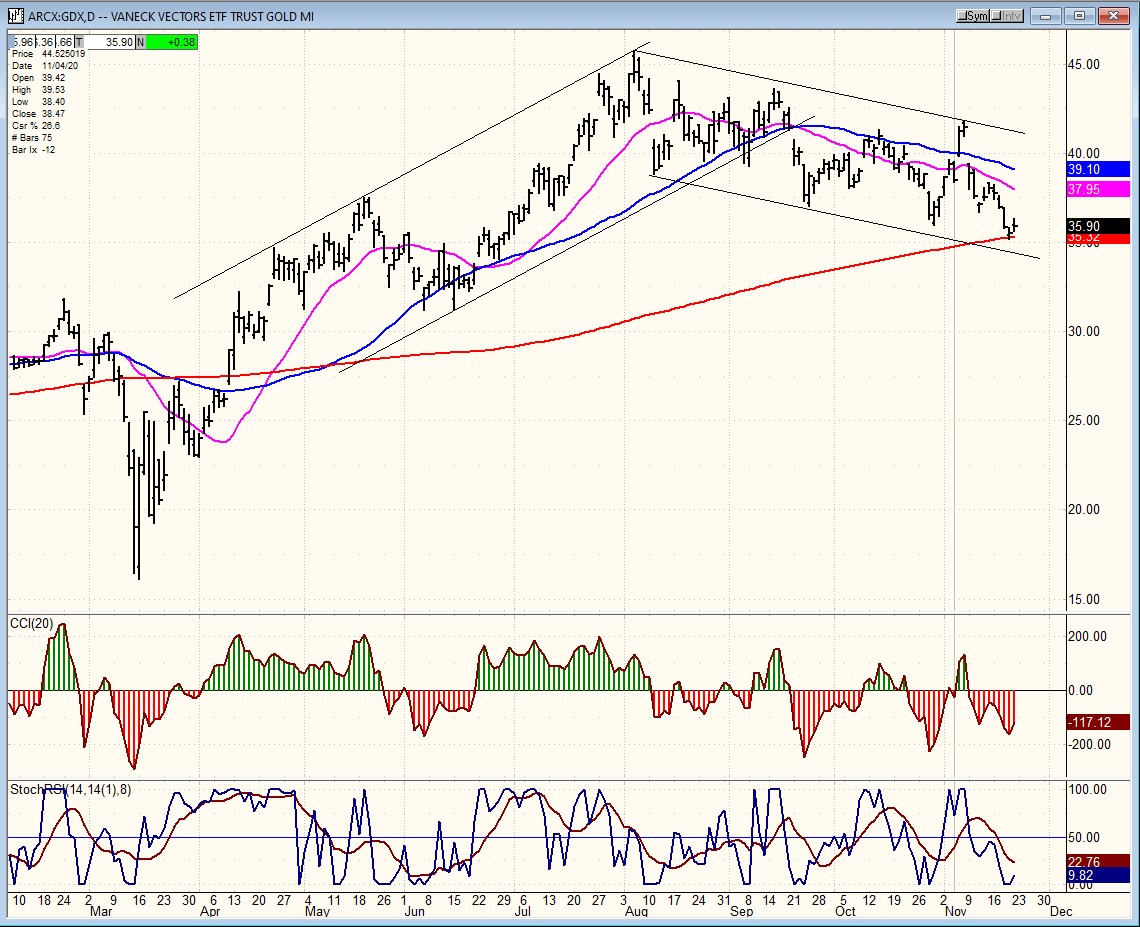
GLD (gold-wkly), GDX (gold miners-dly)
I have superimposed the two gold charts to provide move visibility when the newsletter is sent to subscribers, when forwarded by Constant Contact.
GLD has made an impressive move since it turned up its trend in July 2018. For the past few months, it has been consolidating its gains in an orderly manner which does not reflect heavy selling but more likely profit taking. Its oscillators show that it is not yet ready to resume its uptrend.
GDX is also correcting a sharp advance from the March low. The correction is equally orderly and what could be some minor positive divergence is appearing in the CCI, suggesting that an end to the correction may be near. Since this index has been moving in tandem with SPX, we should look to the end of the correction in SPX to start focusing on a potential coordinated end to the GDX correction.
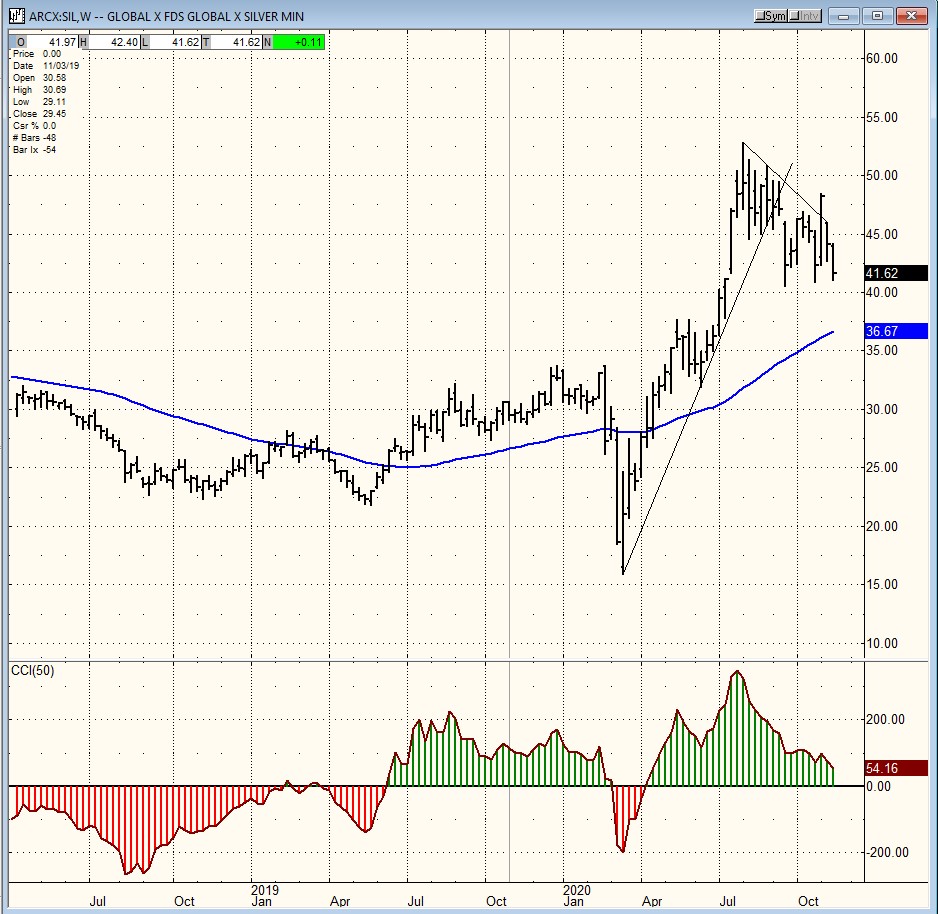
SIL (silver-wkly), PAAS (Pan American Silver Corp-dly)
Similarly, I have superimposed the silver charts for the same reason.
Gold and Silver are having concerted uptrends, at least since the March low where silver showed much more weakness than gold. Since its recovery, silver appears to have caught up with gold and is also making an orderly correction after a sharp rally.
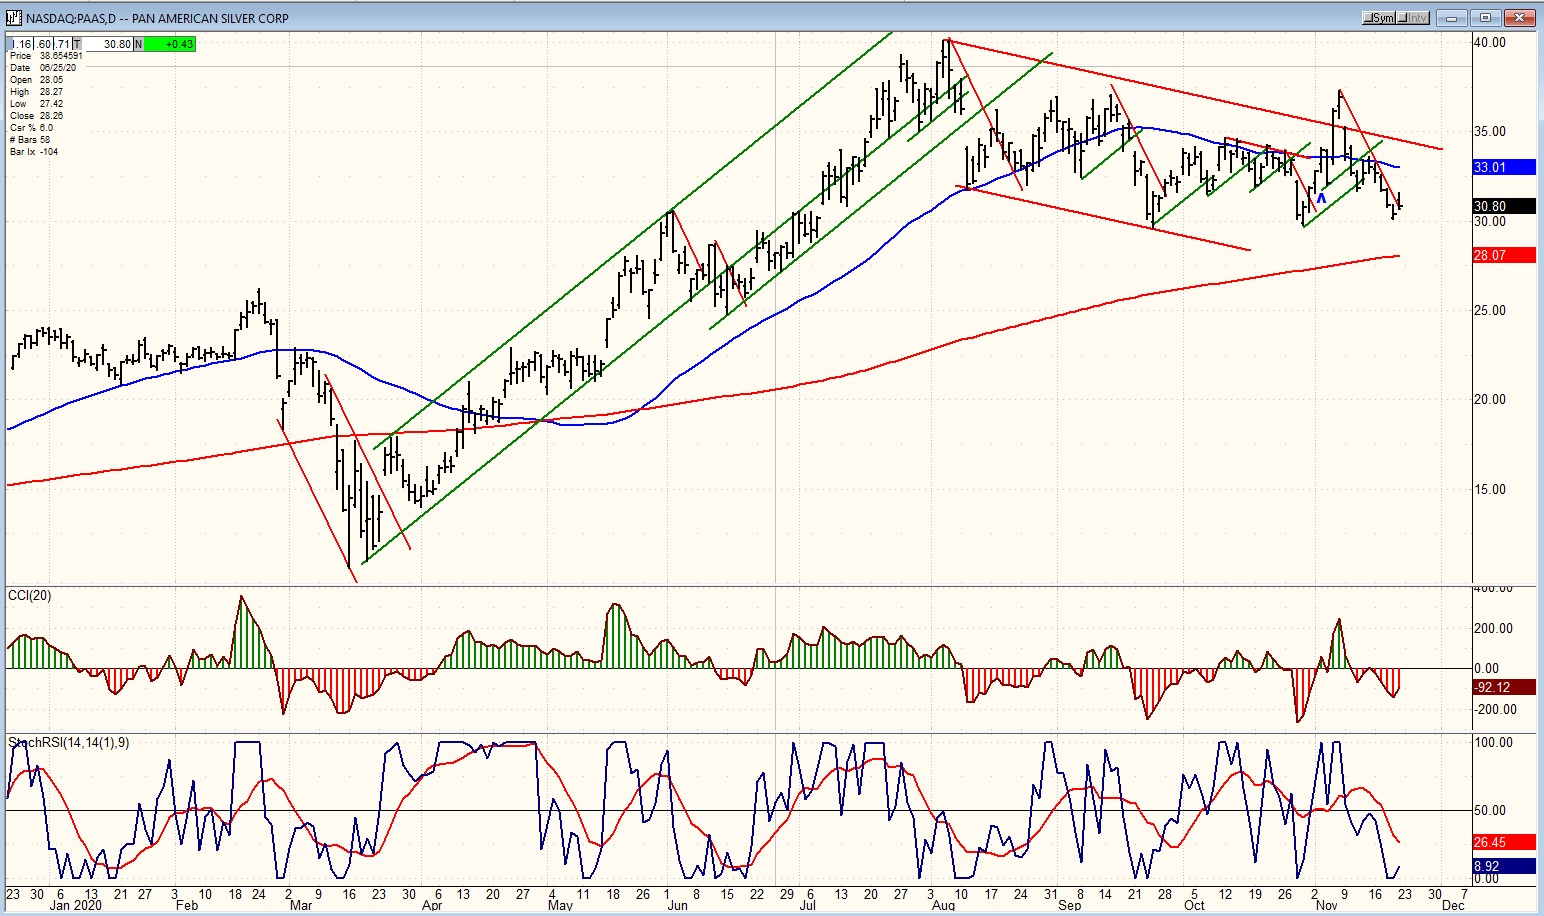
PAAS
PAAS shows the same strong uptrend as GDX from its March low and is holding up as well if not better than GDX during this intermediate correction. Here also, there are some signs of positive divergence beginning to show in the CCI which could suggest that the end of the correction is near. In both cases, substantial bases have been formed which are projecting much higher prices over the long term than those which have already been attained.
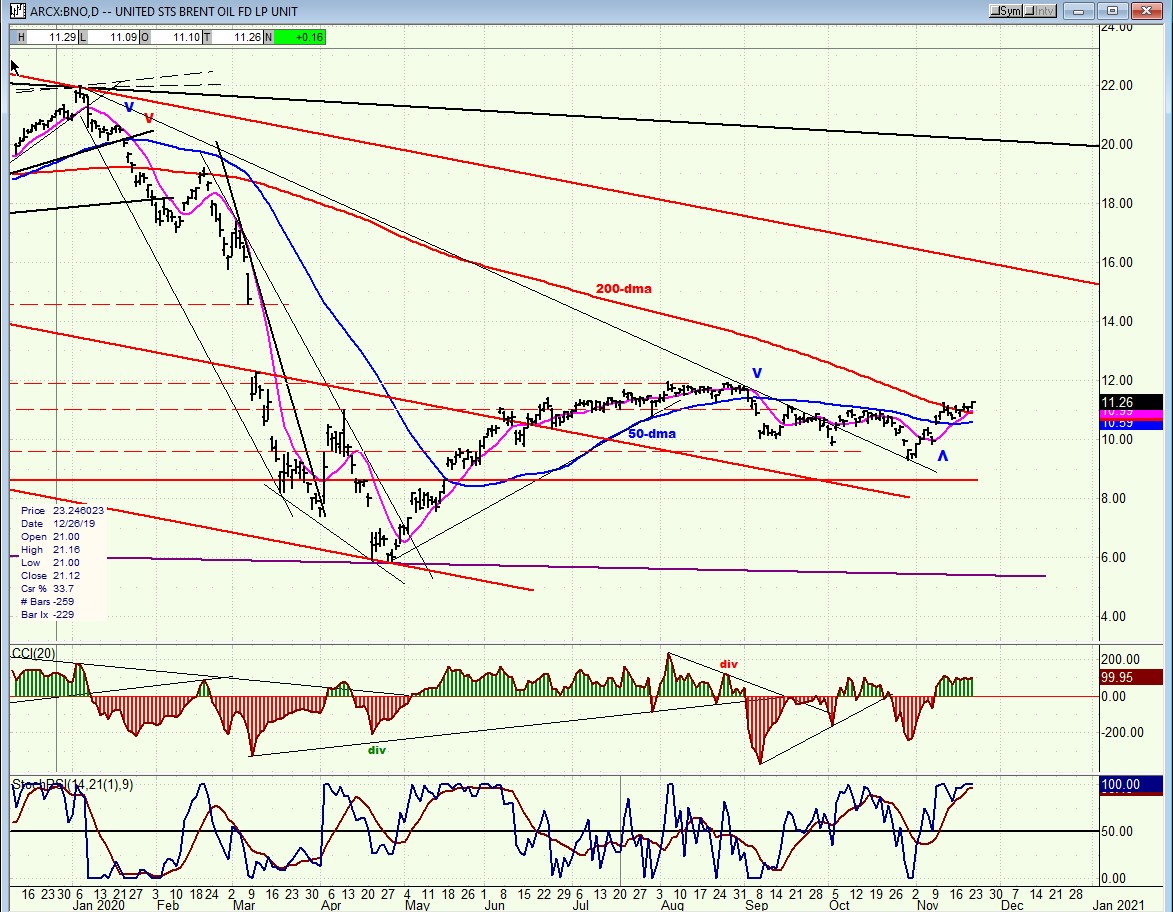
BNO (U.S. Brent Oil fund)
BNO has continued its upward crawling pattern and moved above the 200-dma. Since it has now surpassed both that MA and the 50-dma, we can assume that it is resuming its uptrend which, according to its P&F chart, could take it to 14.
SUMMARY
SPX is correcting its break-out phase from 3434 to 3646. How much of a correction and for how long will depend on whether it can remain above the 3512 pull-back or not. Odds appear to favor a deeper correction at this time.
You may view our website at https://marketurningpoints.com
Free trial subscription
With a trial subscription, you will have access to the same information that is given to paid subscribers, but for a limited time-period. Over the years, I have developed an expertise in P&F charting (price projection), cycles (timing), EWT (structure), and general technical analysis which enables me to warn subscribers of pending reversals in market trends and how far that trend can potentially carry. For a FREE 2-week trial, subscription options and payment plans, I encourage you to visit my website at https://marketurningpoints.com
The above comments and those made in the daily updates and the Market Summary about the financial markets are based purely on what I consider to be sound technical analysis principles. They represent my own opinion and are not meant to be construed as trading or investment advice but are offered as an analytical point of view which might be of interest to those who follow stock market cycles and technical analysis.
********

When Andre Gratian was a stock broker years ago, a friend introduced him to technical analysis of the market. Consequently, it is not an exaggeration to say that Andre fell in love with this approach! Ever since then, it has become an increasingly important part of his professional life. Gratian has studied the works of Wyckoff, Edwards & Magee, Edward J. Dewey (cycles) and many others. However, one of my most profitable undertaking has probably been to study Point & Figure charting, which he finds invaluable in analyzing stocks and indices. If he were restricted to one methodology, this is the one that he would choose. This well-rounded background has given him what he feels to be a special insight into the stock market, facilitating the recognition of meaningful patterns and the ‘turning points’ in all trends, whether they be short or long term. Andre feels very comfortable discussing the stock market and passing on meaningful information to others. His subscribers include individuals and money managers throughout the world. Moreover, his Newsletters are currently published on several financial sites, here and abroad.


