Technical Analysis Of The Markets


Current Position of the Market
SPX Long-term trend: There is some good evidence that we are still in the bull market which started in 2009 and which could continue into the first quarter of 2021 before coming to an end.
SPX Intermediate trend: May continue until SPX recaches 4150 in February.
Analysis of the short-term trend is done daily with the help of hourly charts. They are important adjuncts to the analysis of daily and weekly charts which determine longer market trends.
SPX Short-term Top Imminent
Cycles: Looking ahead! 90-yr cycle – last low: 1932. Next low: 2022
7-yr cycle – last low: 2016. Next low: 2023
Short-term low: 1/18-1/20
Market Analysis (Charts courtesy of QCharts
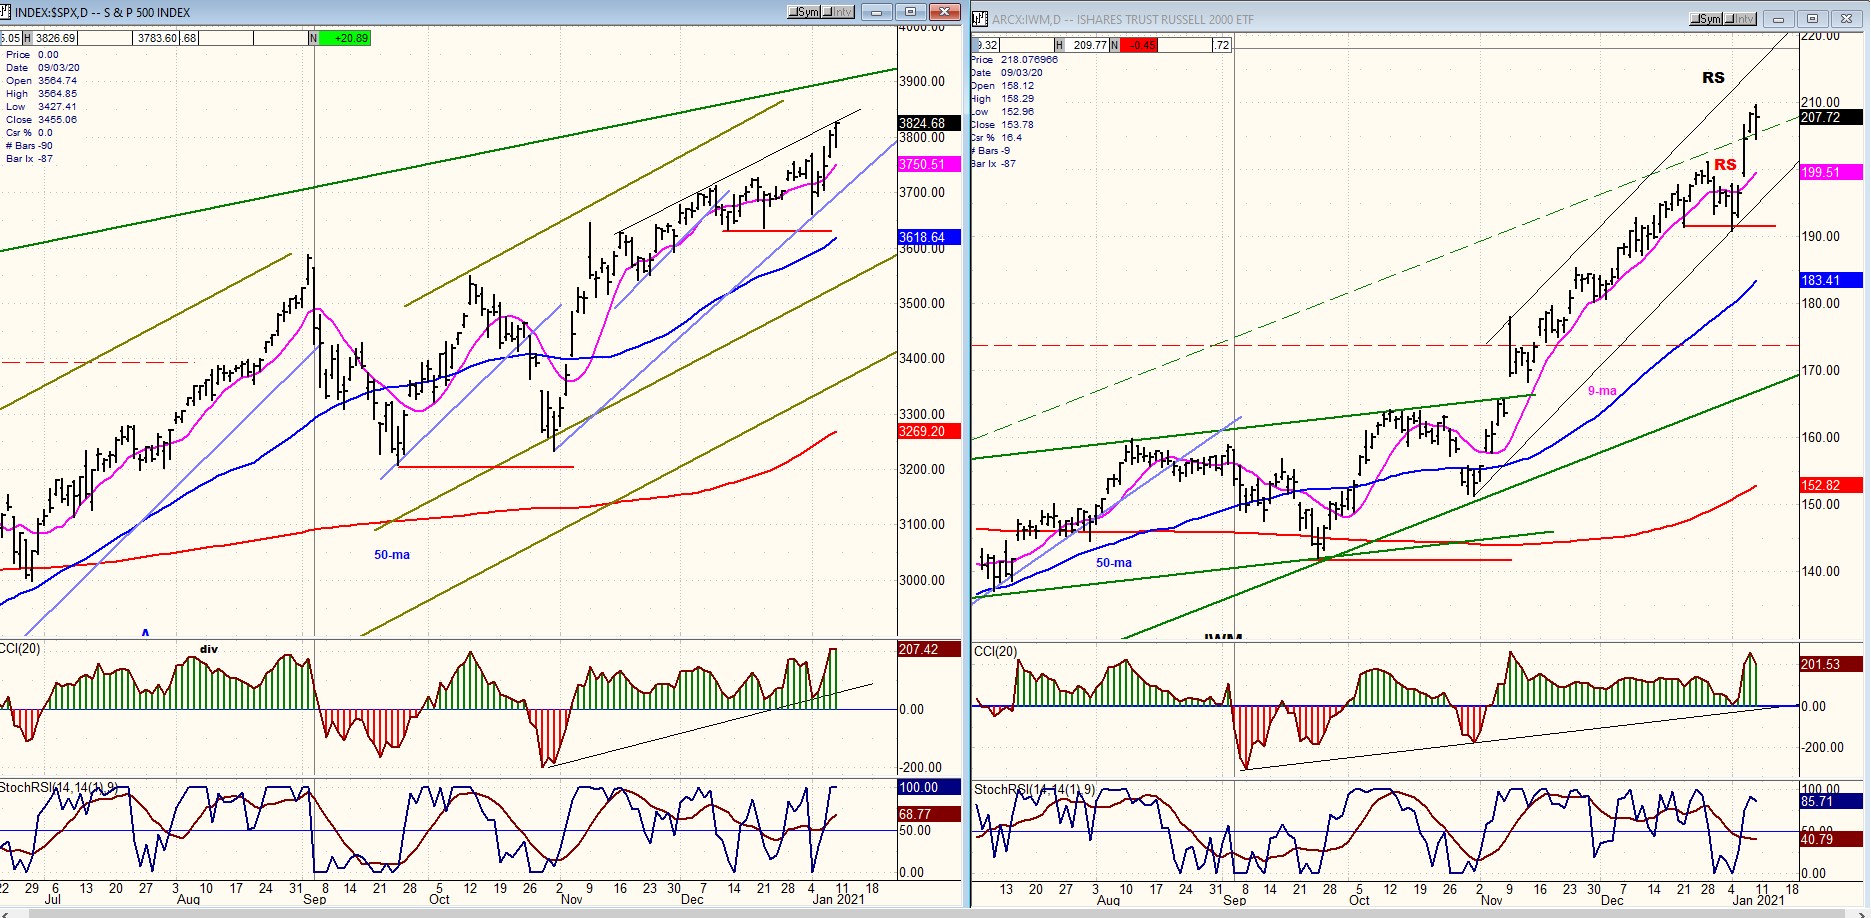
SPX-IWM weekly charts
Last week, IWM accurately warned of a correction in SPX, but it was short-lived and not of intermediate nature. The next significant warning from IWM whereby it exhibits relative weakness to SPX may now not come until we approach 4150.
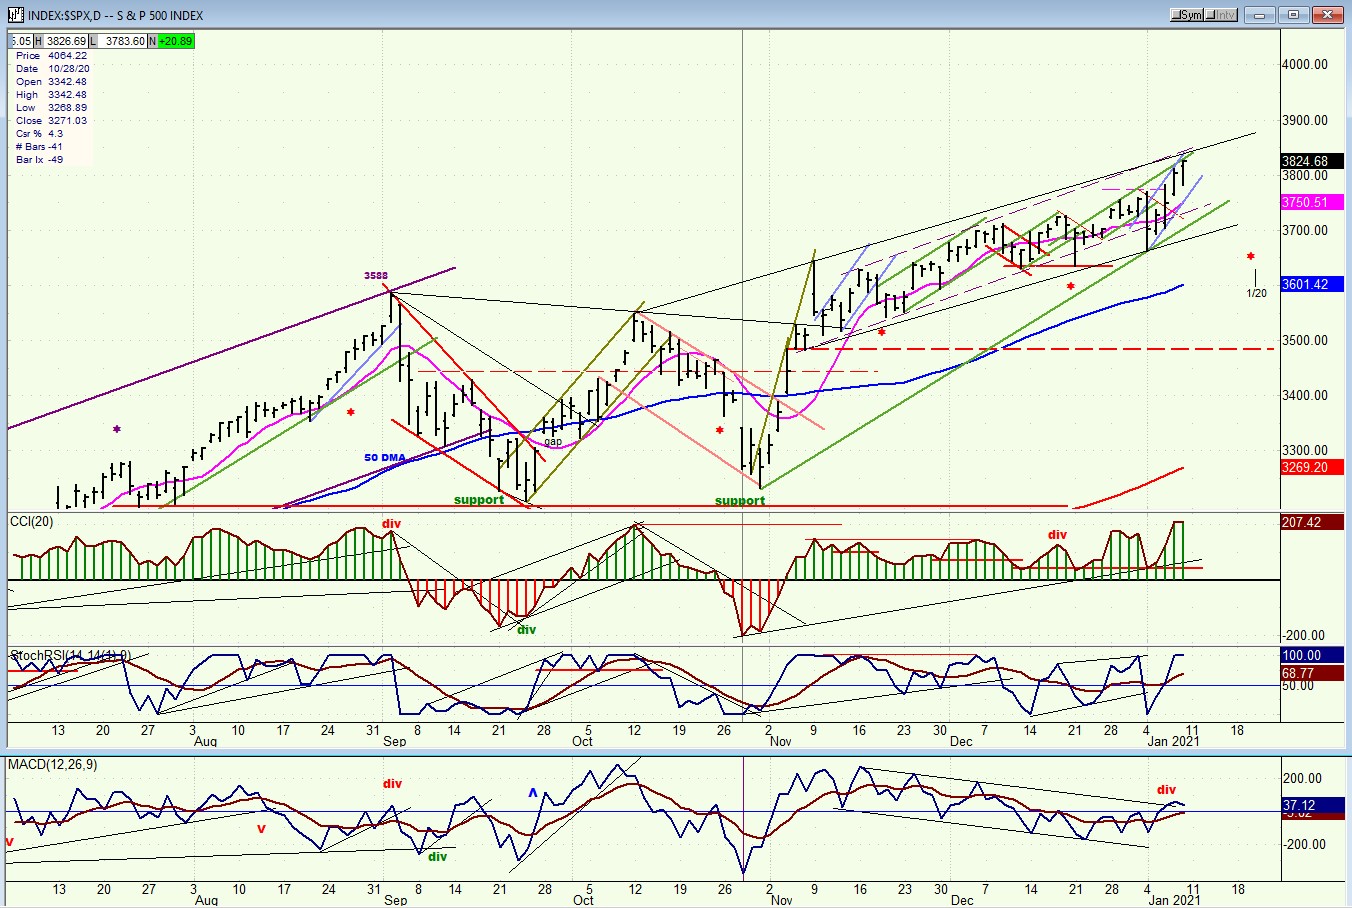
SPX daily chart
What a stock market! A pandemic out of control: New all-time highs! A mob attack on Washington: New all-time highs! A negative jobs report! New all-time highs! Go figure!!! But the market behavior is not out of context with technical analysis and Point & Figure targets.
My projection for a top when SPX reached 3777 was spot-on, but ephemeral! After touching 3776.99, the index back-tracked over a hundred points in the space of three hours and that was it; going on to make new highs two days later. I estimate that the next top is going to come at ~3850, possibly by Monday. This should be followed by a retracement into 1/18-20 due to the bottoming of a 20-day cycle which has had a very good record of consistancy. There could be some additional consolidation into the end of the month before the market marches on to the more important top of 4150!
And as long as we are making projections, we probably should not expect the bull market to end at least until April, with the SPX going to about 4450 and perhaps to as high as 4810.
Expecting a more important top in this time frame was due, in part, to negative divergence showing at the weekly, daily, and hourly time frames -- an unusual occurrence. However, this past week the daily CCI surged to its highest level since August, wiping out any expectation of important weakness directly ahead.
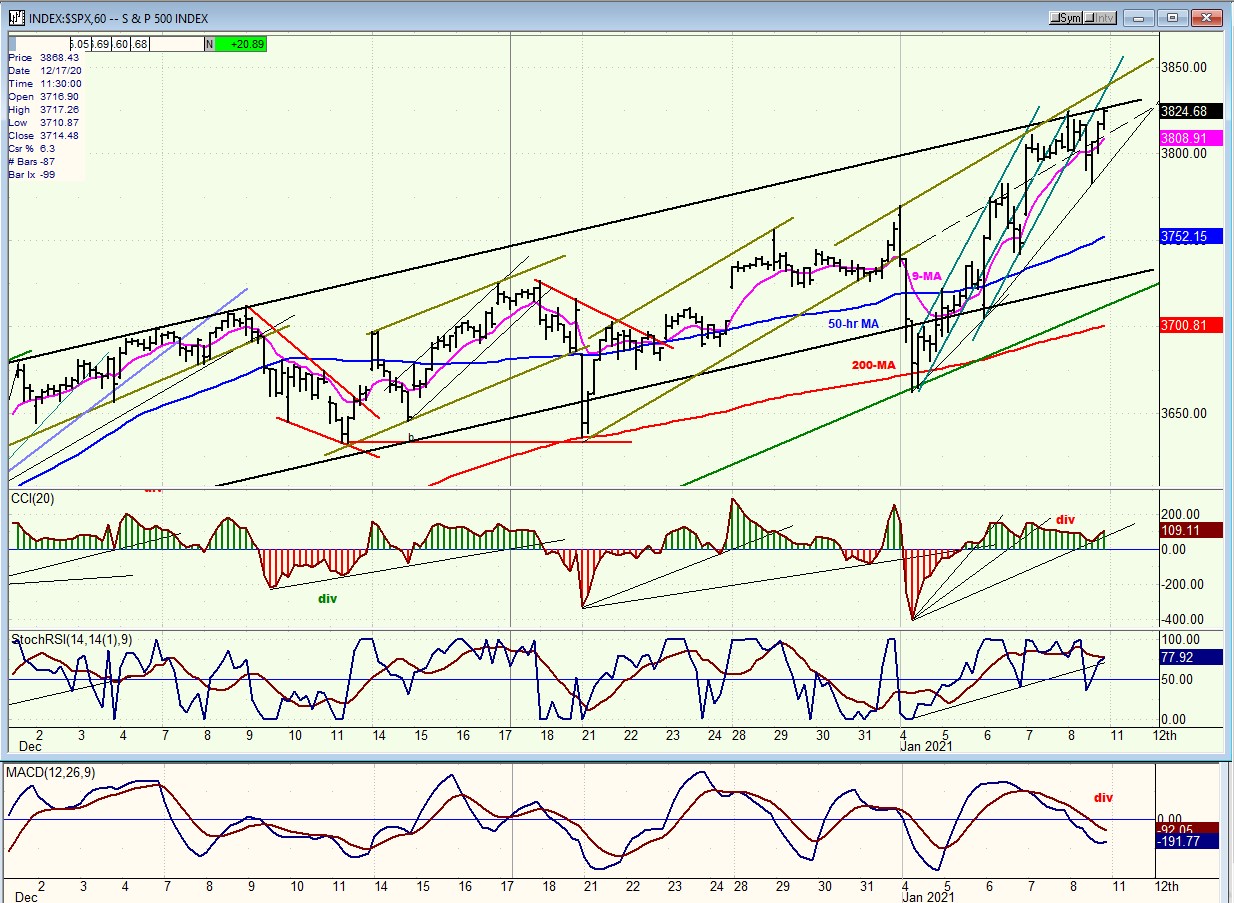
SPX hourly chart
Since mid-November, SPX has been traveling in a narrow, shallow channel which was breached on the downside on two separate occasions, with prices finding support on the 200-hr MA and immediately bouncing back inside the channel. The index is preparing to do the same thing on the upside, punching through the top of the channel to reach its ~3850 short-term target before perhaps retracing down to the bottom of the channel once again, and at least into the low of the 20-td cycle due on 1/18-20.
After this, it should continue its path higher toward the next price target of ~4150 which, upon completion, should bring the most important correction since early November. Even this would not be expected to mark the top of the 2009 bull market which could come at a higher level in April, just ahead of a substantial decline resulting from the bottoming of the 7-year cycle (2002-2009-2016-2023).
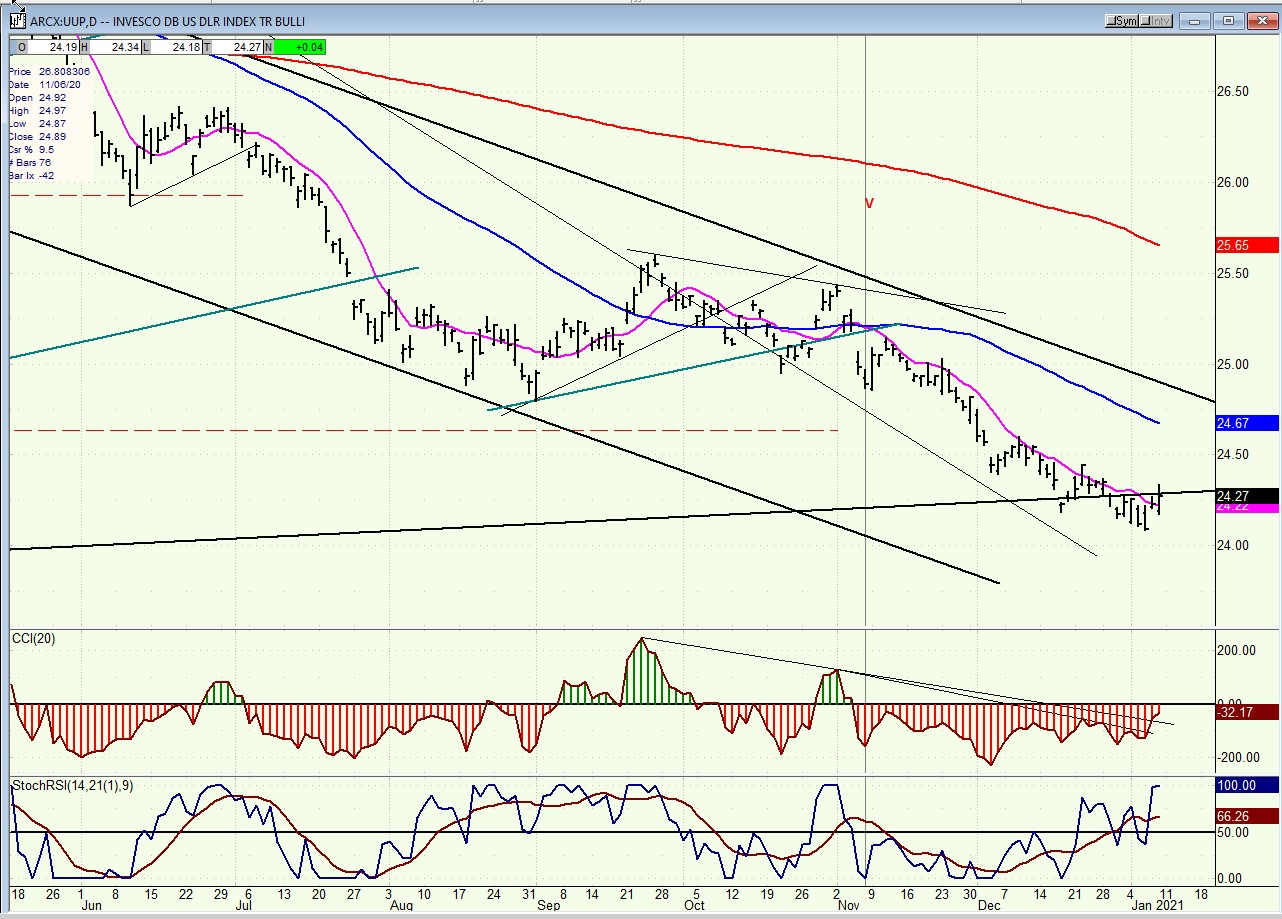
UUP (dollar ETF) WKLY ($USD chart not available from this data provider
UUP is doing what the oscillator pattern anticipated, namely finding support in the vicinity of its long-term channel trend line. This could bring a rally extending into the blue 50-wk MA over the next few weeks, and perhaps to the top of the corrective channel trend line just beyond.
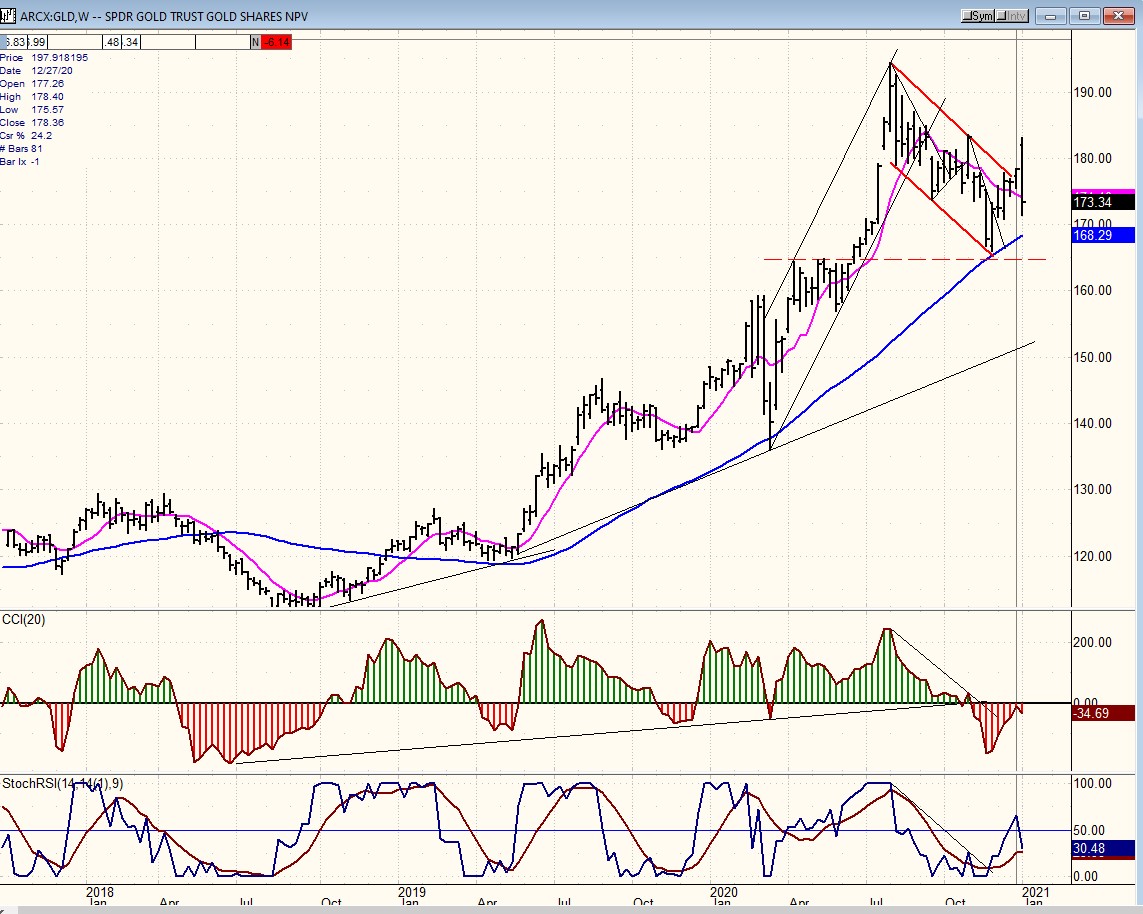
GLD (gold)-WKLY
GLD found support on its weekly 50-MA and retraced .618 of its correction before finding resistance at a former short-term high and pulling back. More corrective action is likely needed for the next couple of weeks. So long as it remains above the blue 60-wk MA where it found support on the last pull-back, GLD should continue to consolidate in preparation for its next advance.
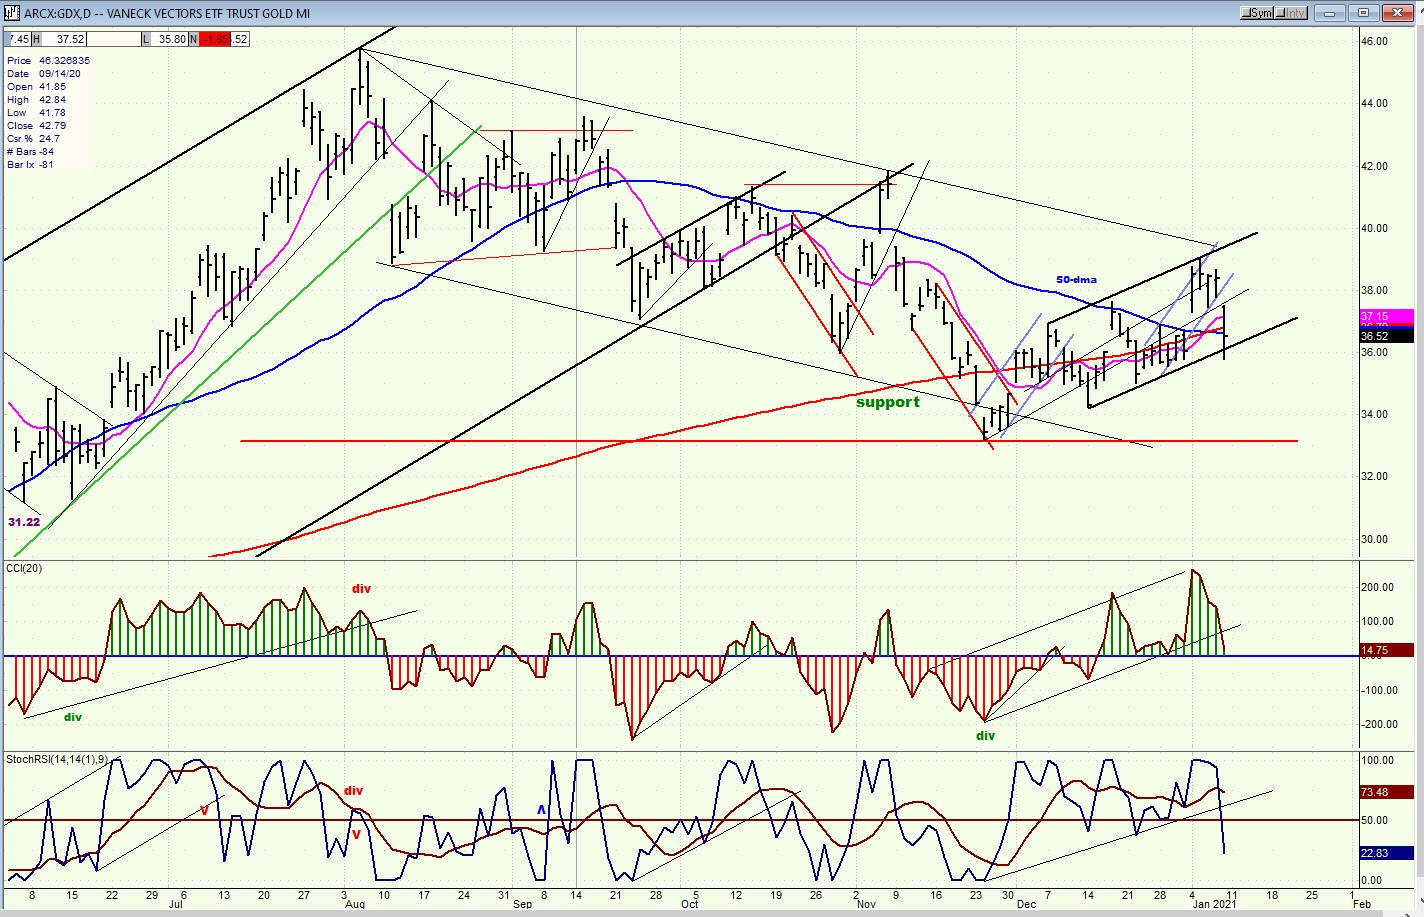
GDX (gold miners)-DLY
GDX also rallied and pulled back, similarly to GLD. It has found support on the lower channel trend line and could bounce before retesting its low and engaging in additional consolidation.
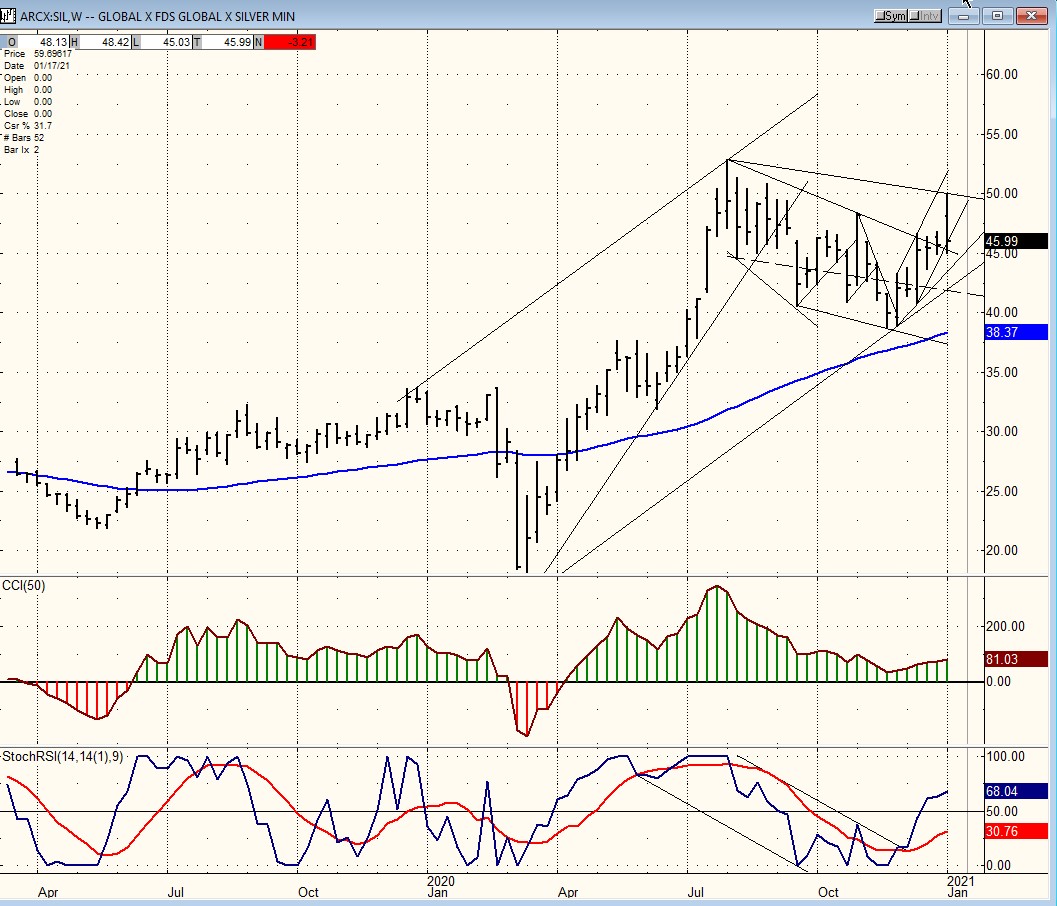
SIL (silver)-WKLY
The silver weekly chart is also similar to GLD’s, and the same near-term action is expected of it. With large bases capable of bringing about much higher prices, neither should show much weakness over the short-term -- only what is required to get the indexes ready for a continued move to the upside.
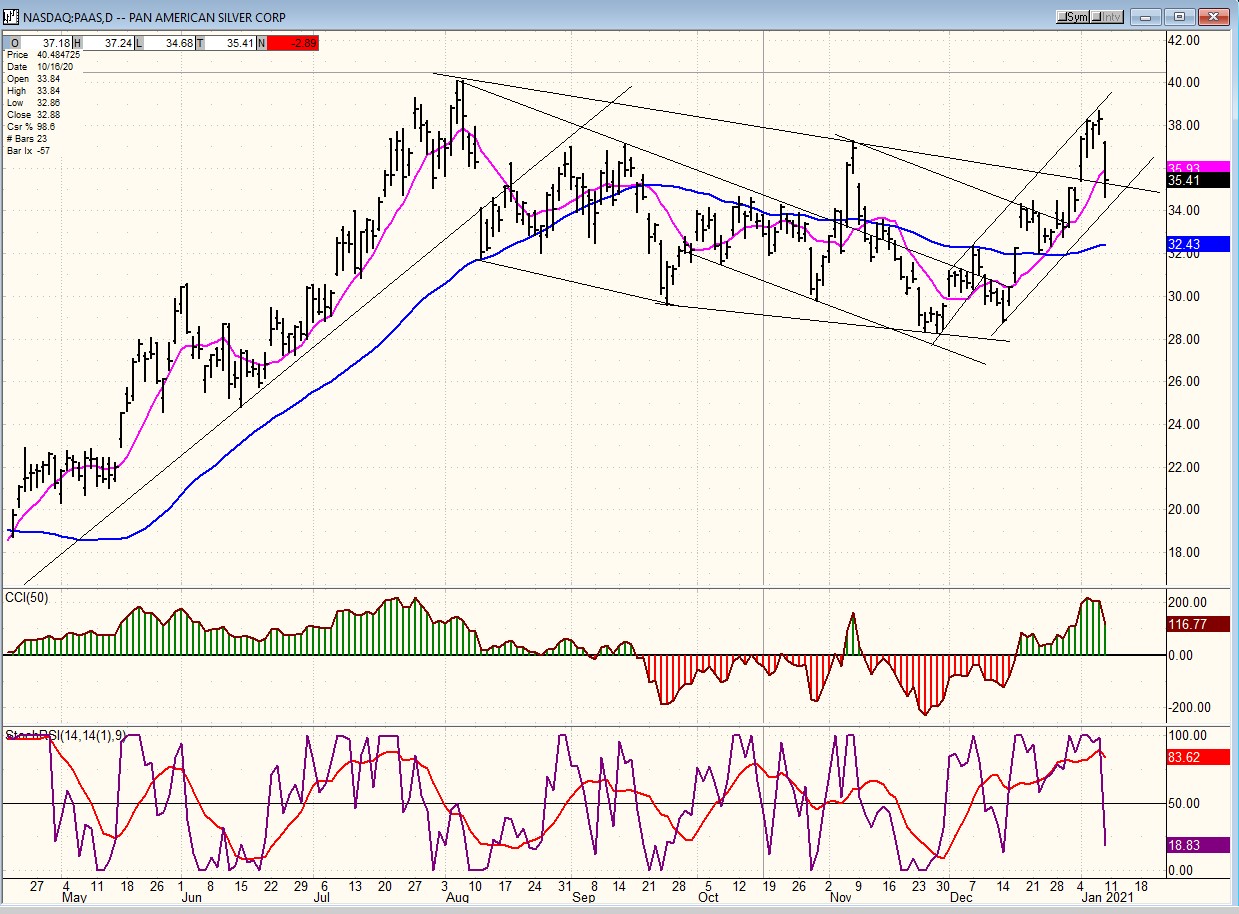
PAAS (Pan American Silver Corp-DLY)
As anticipated, although they have about the same chart patterns, PAAS is outperforming GDX with stronger rallies and weaker retracements. Like GDX, it needs to consolidate the recent move which took it outside of its corrective channel and, when ready to resume its intermediate and long-term uptrend. A projection will be given when it is closer to ending its consolidation.
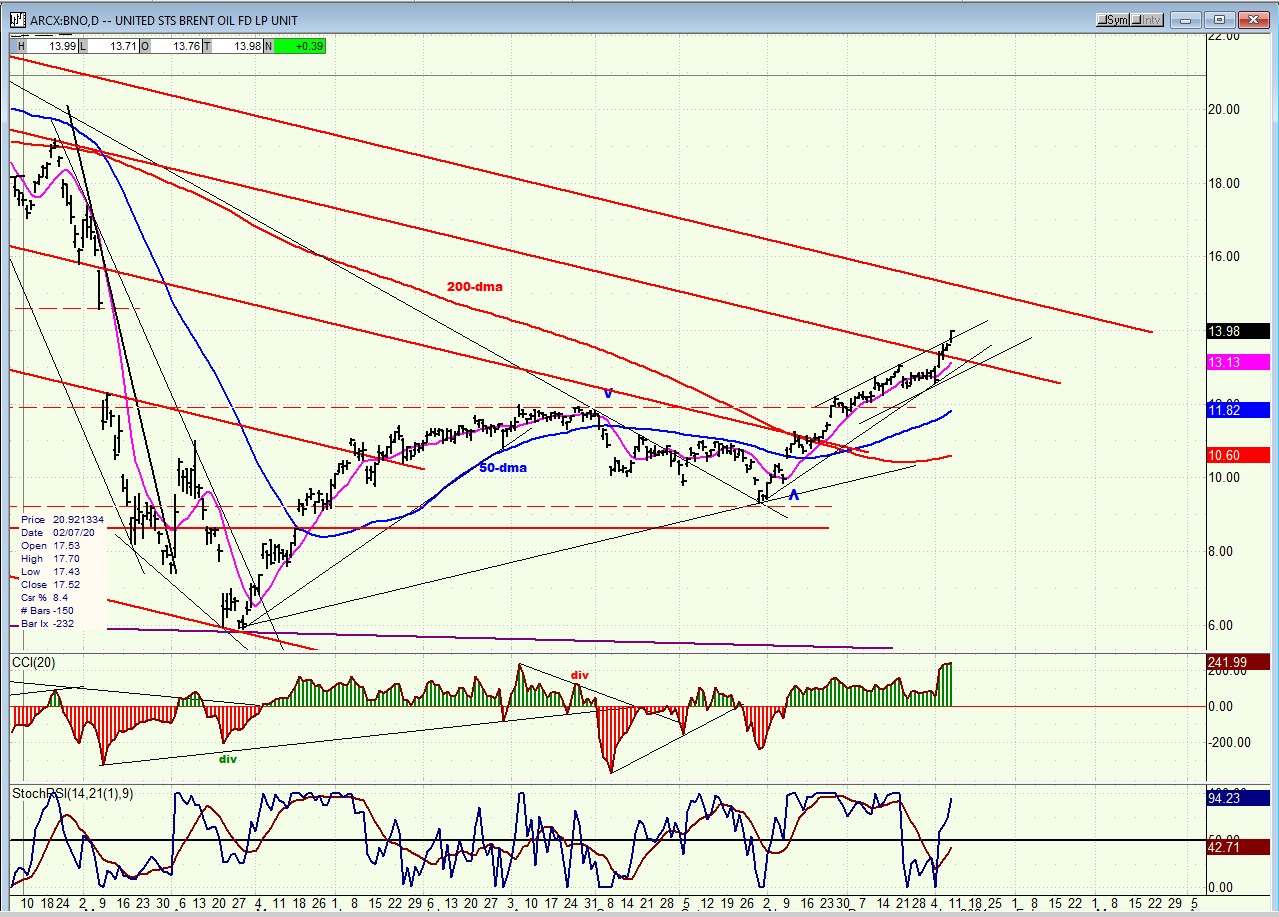
BNO (U.S. Brent Oil fund)
BNO has come within a penny of its stated projection of 14.00. After touching it, it will probably need to consolidate before going for the next target of about 16.
SUMMARY
After meeting its 3770 projection, SPX was expected to have a good correction which did occur pricewise, but a reversal came right away sending the index to a new all-time high. The next projection of ~3850 should be met next week followed by a pull-back into 1/18-1/20 and perhaps beyond.
Free trial subscription
With a trial subscription, you will have access to the same information that is given to paid subscribers, but for a limited time-period. Over the years, I have developed an expertise in P&F charting (price projection), cycles (timing), EWT (structure), and general technical analysis which enables me to warn subscribers of pending reversals in market trends and how far that trend can potentially carry. For a FREE 2-week trial, subscription options and payment plans, I encourage you to visit my website at
The above comments and those made in the daily updates and the Market Summary about the financial markets are based purely on what I consider to be sound technical analysis principles. They represent my own opinion and are not meant to be construed as trading or investment advice but are offered as an analytical point of view which might be of interest to those who follow stock market cycles and technical analysis.
********

When Andre Gratian was a stock broker years ago, a friend introduced him to technical analysis of the market. Consequently, it is not an exaggeration to say that Andre fell in love with this approach! Ever since then, it has become an increasingly important part of his professional life. Gratian has studied the works of Wyckoff, Edwards & Magee, Edward J. Dewey (cycles) and many others. However, one of my most profitable undertaking has probably been to study Point & Figure charting, which he finds invaluable in analyzing stocks and indices. If he were restricted to one methodology, this is the one that he would choose. This well-rounded background has given him what he feels to be a special insight into the stock market, facilitating the recognition of meaningful patterns and the ‘turning points’ in all trends, whether they be short or long term. Andre feels very comfortable discussing the stock market and passing on meaningful information to others. His subscribers include individuals and money managers throughout the world. Moreover, his Newsletters are currently published on several financial sites, here and abroad.


