Technical Analysis Of The Markets


Current Position of the Market
SPX Long-term trend: There is some good evidence that we are still in the bull market which started in 2009 and which could continue into the first quarter of 2021 before coming to an end.
SPX Intermediate trend: May continue until SPX recaches 4150 in February.
Analysis of the short-term trend is done daily with the help of hourly charts. They are important adjuncts to the analysis of daily and weekly charts which determine longer market trends.
Intermediate Trend Intact
Cycles: Looking ahead! 90-yr cycle – last low: 1932. Next low: 2022
7-yr cycle – last low: 2016. Next low: 2023
Short-term low: 1/25-29
Market Analysis (Charts courtesy of QCharts
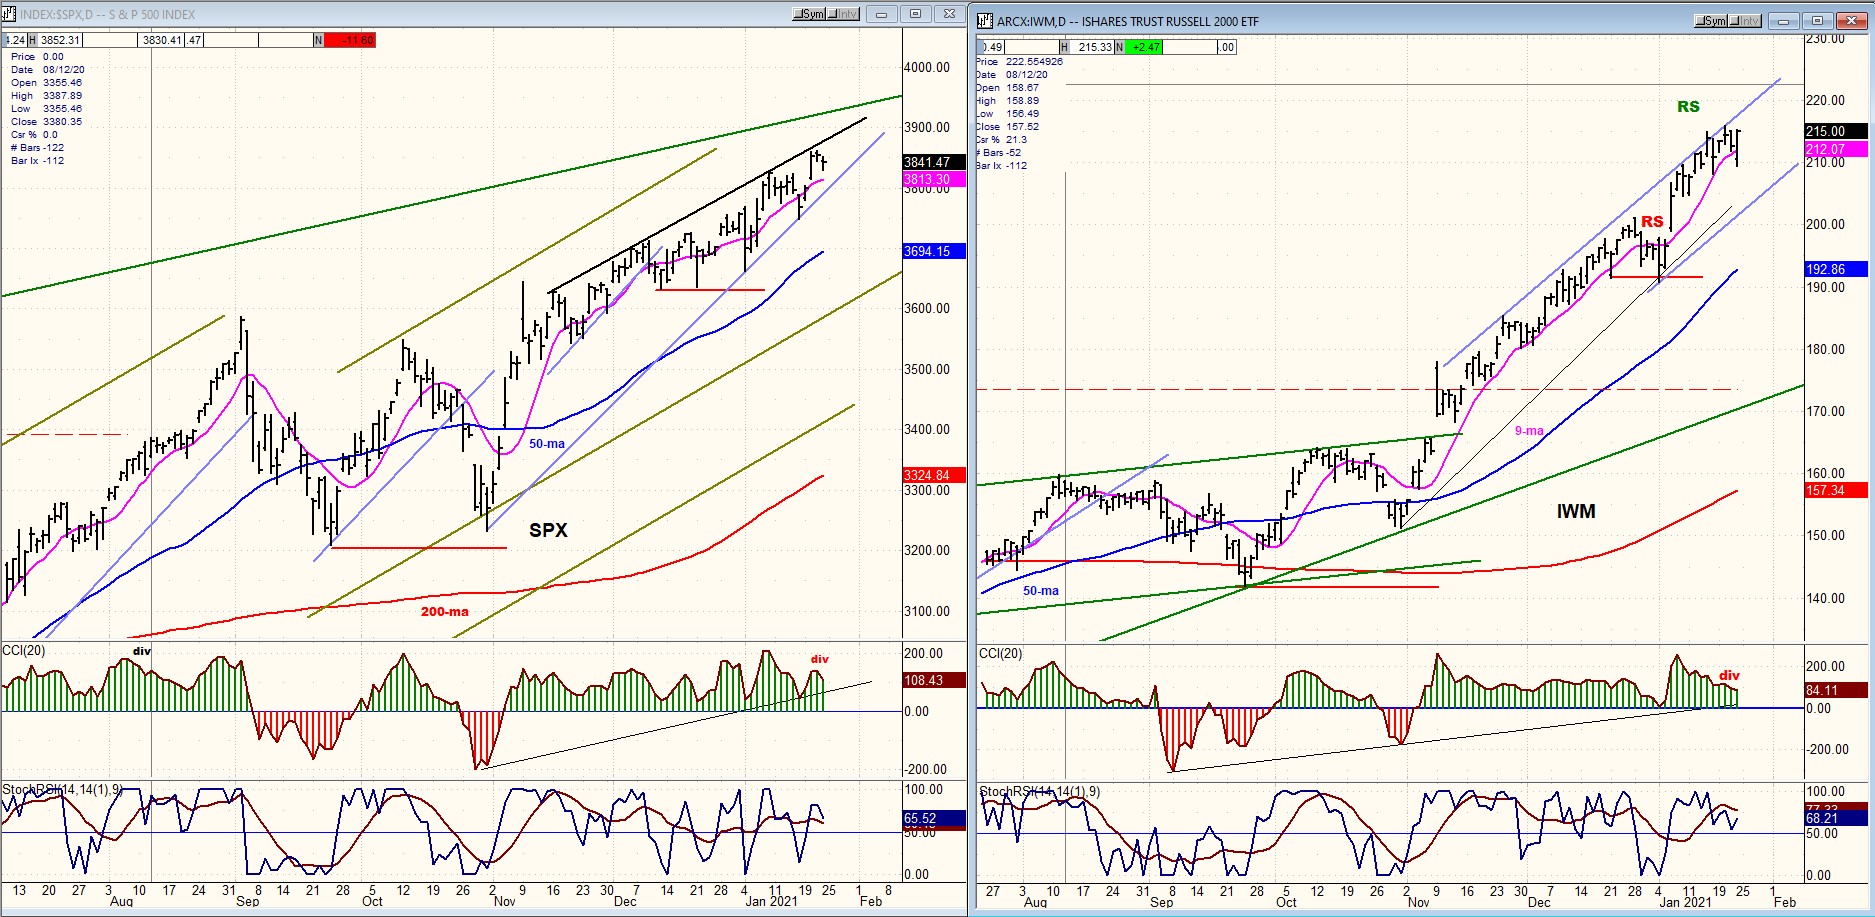
SPX-IWM daily charts
IWM continues to keep up with SPX, suggesting that the intermediate trend is intact. It is noted, however, that the oscillators of both indices are showing some mild negative divergence. This could signal some trend deceleration ahead.
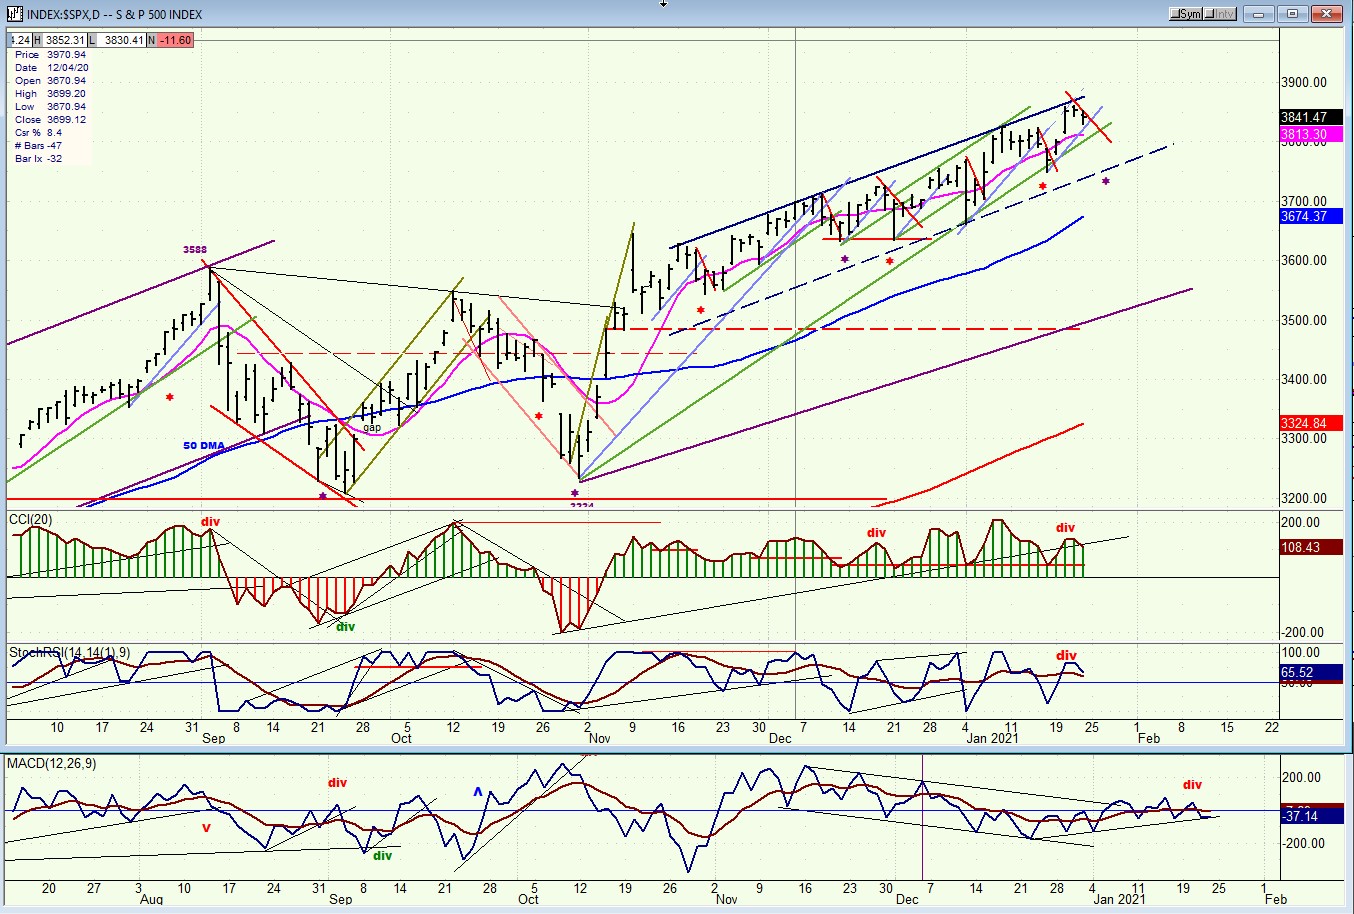
SPX daily chart
Since it made an intermediate low at 3234 on 11/02, SPX has continued to move in a rising intermediate channel punctuated by short-term corrections of two or three days each, followed by a new all-time high. These minor corrections are brought about by small cycles making a low, some of which are identifiable and can be anticipated, such as the 20-td cycle which created the last bottom and prompted a quick 110-point rally to 3860 before the next minor cycle (~29-td) took control, and is in the process of creating the next reversal with a low due about Tuesday of next week. However, the negative divergence in the daily chart could be telling us that something more (possibly another cycle) could extend the correction a few more days.
The breaking of the green uptrend line would probably also initiate a slightly longer correction although the P&F chart does not show that much distribution at the current top. In any case, until we get a clear signal from IWM that an intermediate top is being struck -- confirmed by the P&F chart base count which suggests that this will not take place until we get to ~4150 -- it does not look as if the bulls have too much to be concerned about right now.
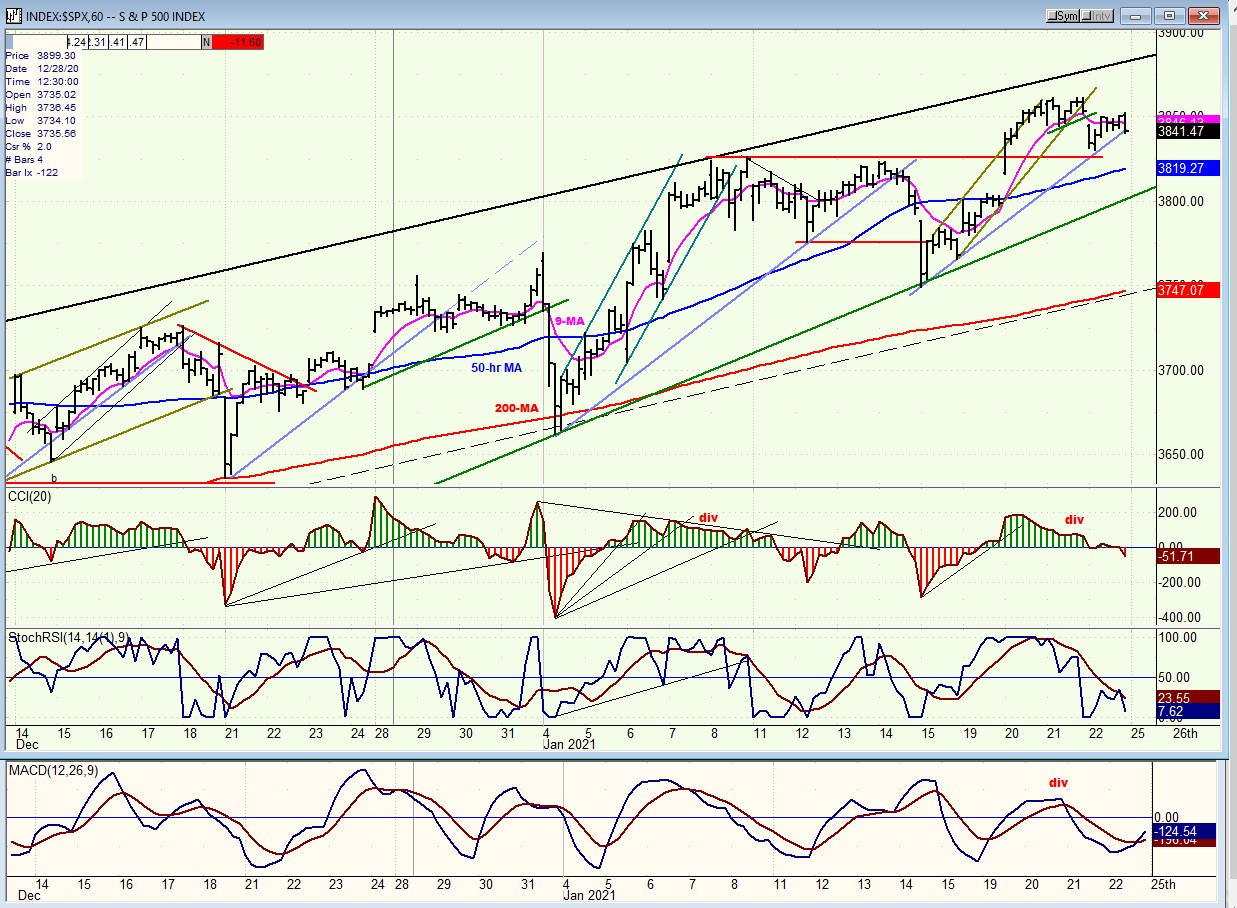
SPX hourly chart
The hourly chart shows a very graphic topping formation marking the end of the rally from 3750. The onset of an impending short-term correction can be discerned in the oscillators (which first displayed negative divergence) and with the index initiating a sell signal at the close. This has already been confirmed by the futures which, after Friday’s close, have continued the decline started in the last hour by SPX.
Note that the index is also ready to break the blue trend line that, as you will see from scanning past data, regularly brings about a short-term correction when penetrated. The decline could stop at the green trend line which originated on 1/04 and previously halted the last short-term decline when it reached it at 3755. By next week, the trend line would be at about 3707, a level that would correspond with the target determined by the minor congestion which has so far accrued in the P&F chart.
Both blue and green trend lines are standard uptrend lines which were derived from earlier chart patterns and which have proven to be consistently reliable. Therefore, if the green trend line is broken, we should assume that the short-term pull-back will be prolonged.
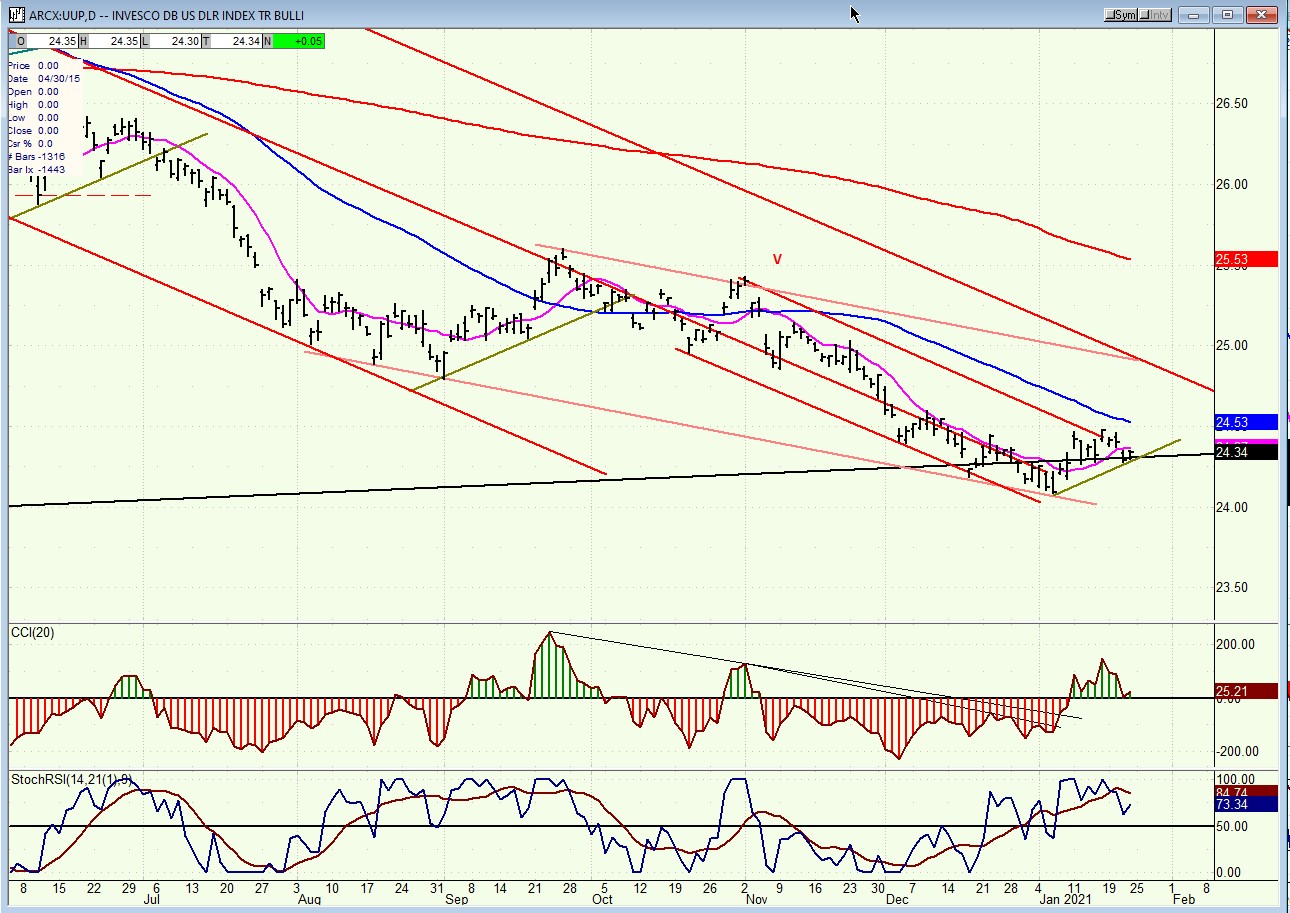
UUP (dollar ETF) WKLY ($USD chart not available from this data provider)
UUP is slowly trying to come out of its long-term downtrend. It has pulled away from the bottom of the corrective channel, has crossed the mid-channel line, and is now heading for the top trend line of the major channel where it should find some temporary resistance.
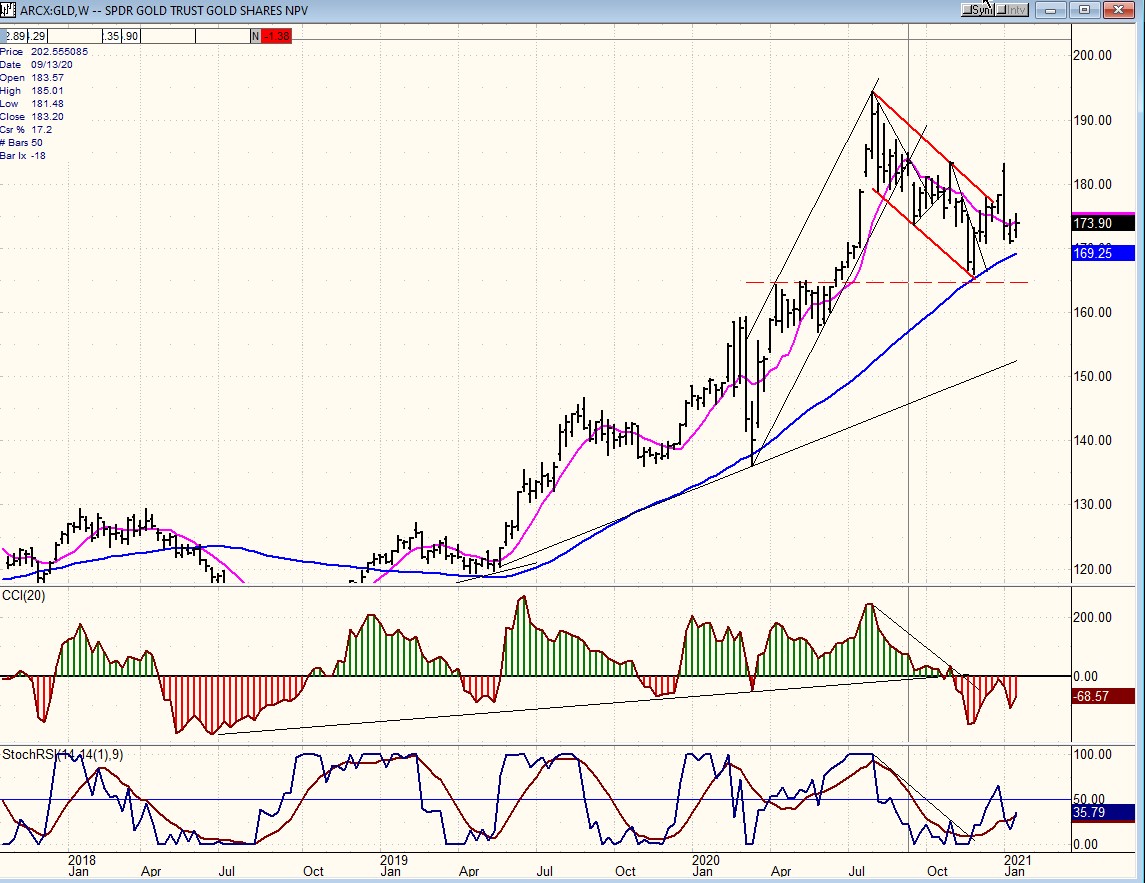
GLD (gold ETF)
After a sharp advance, GLD has undergone a necessary correction which is now coming to an end, but it can still be a couple of weeks away. GLD has already rallied outside of the corrective channel and pulled back. After some additional consolidation it should be ready to resume its uptrend.
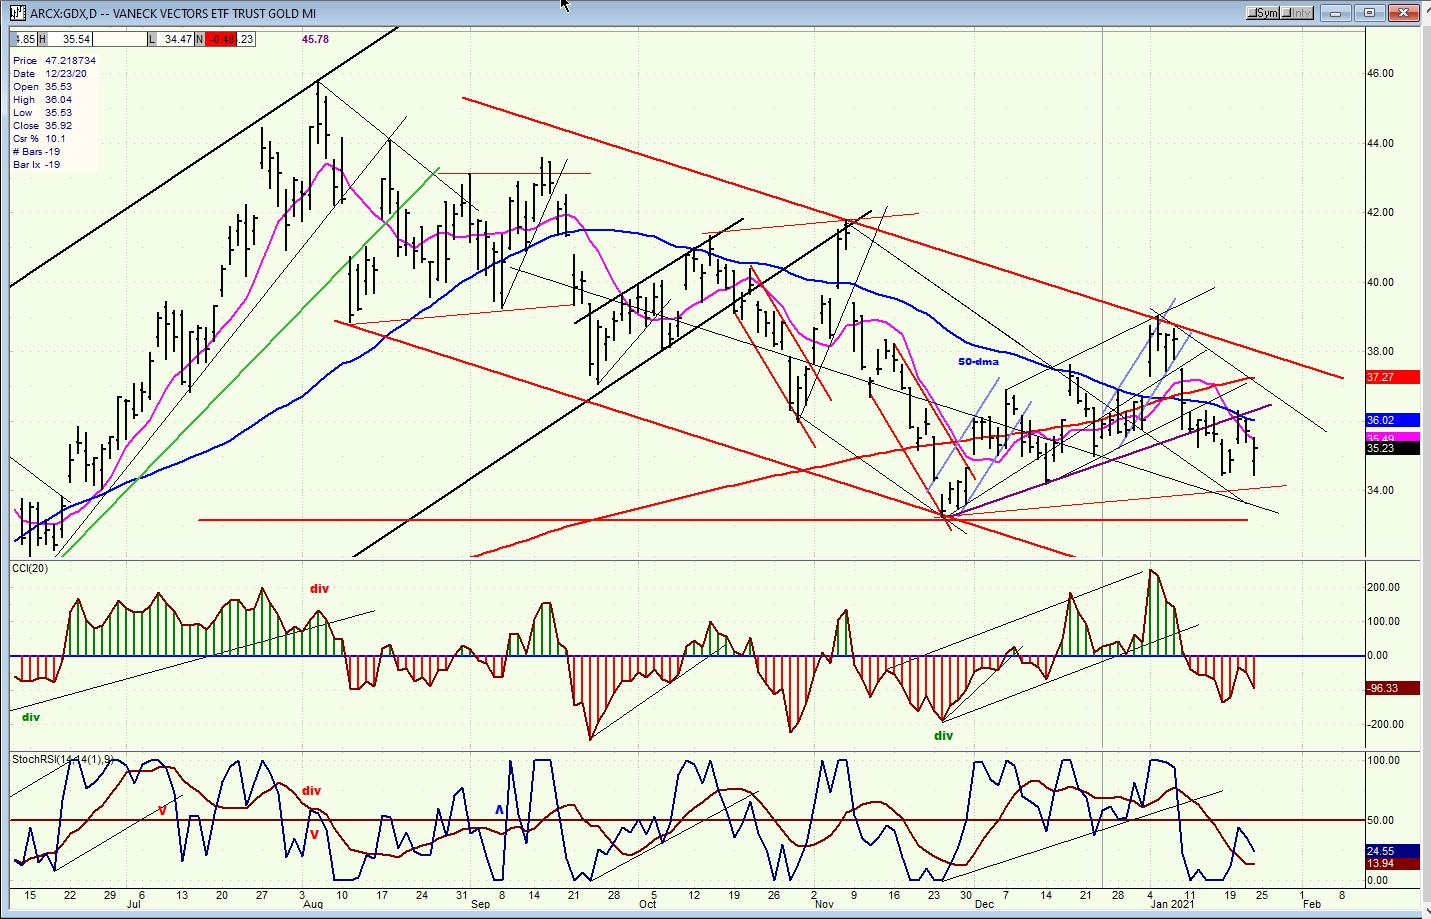
GDX (gold miners)-DLY
GDX is ending an intermediate correction which has lasted about six months. During this time, it has retraced a part of its long-term uptrend, giving up slightly more than .382 of its rally to-date. Like GLD, it needs a little more time to complete the final phase of its correction before being ready to continue its upward path.
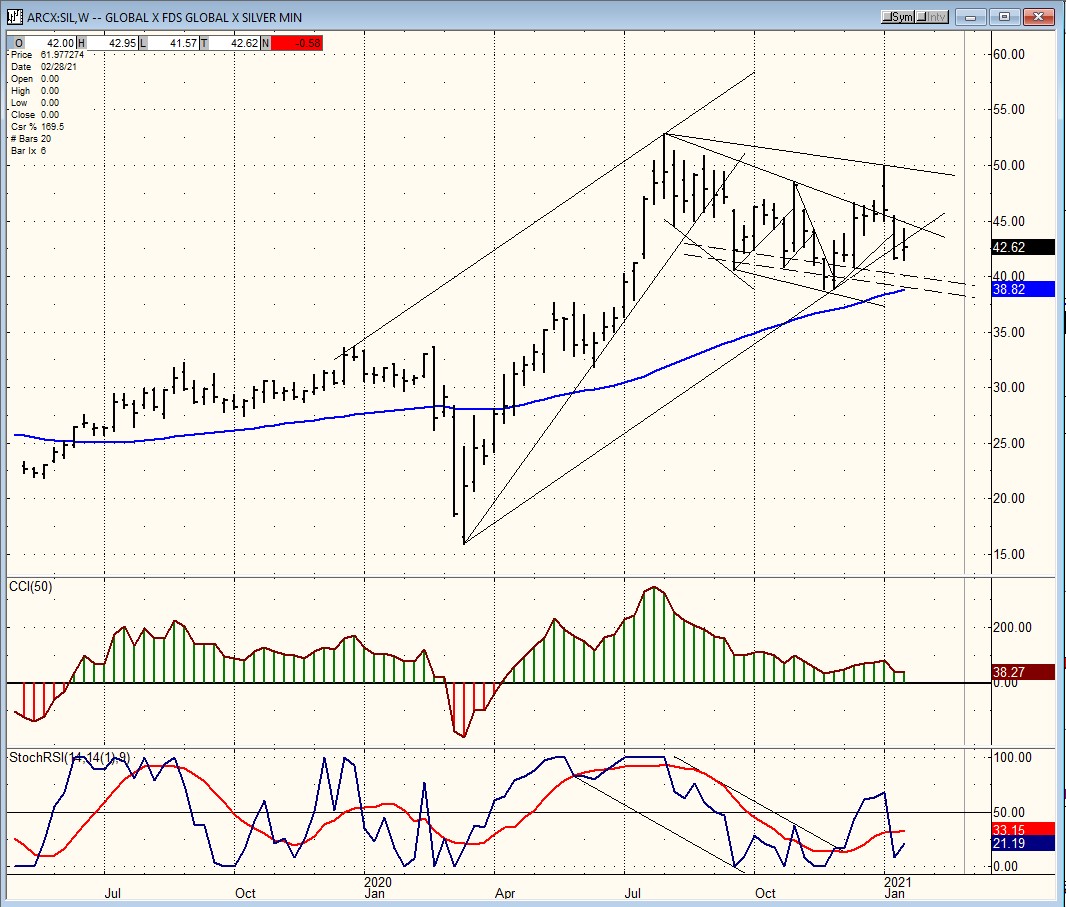
SIL (silver)-WKLY
Silver has also pulled back to conclude its correction before resuming its uptrend.
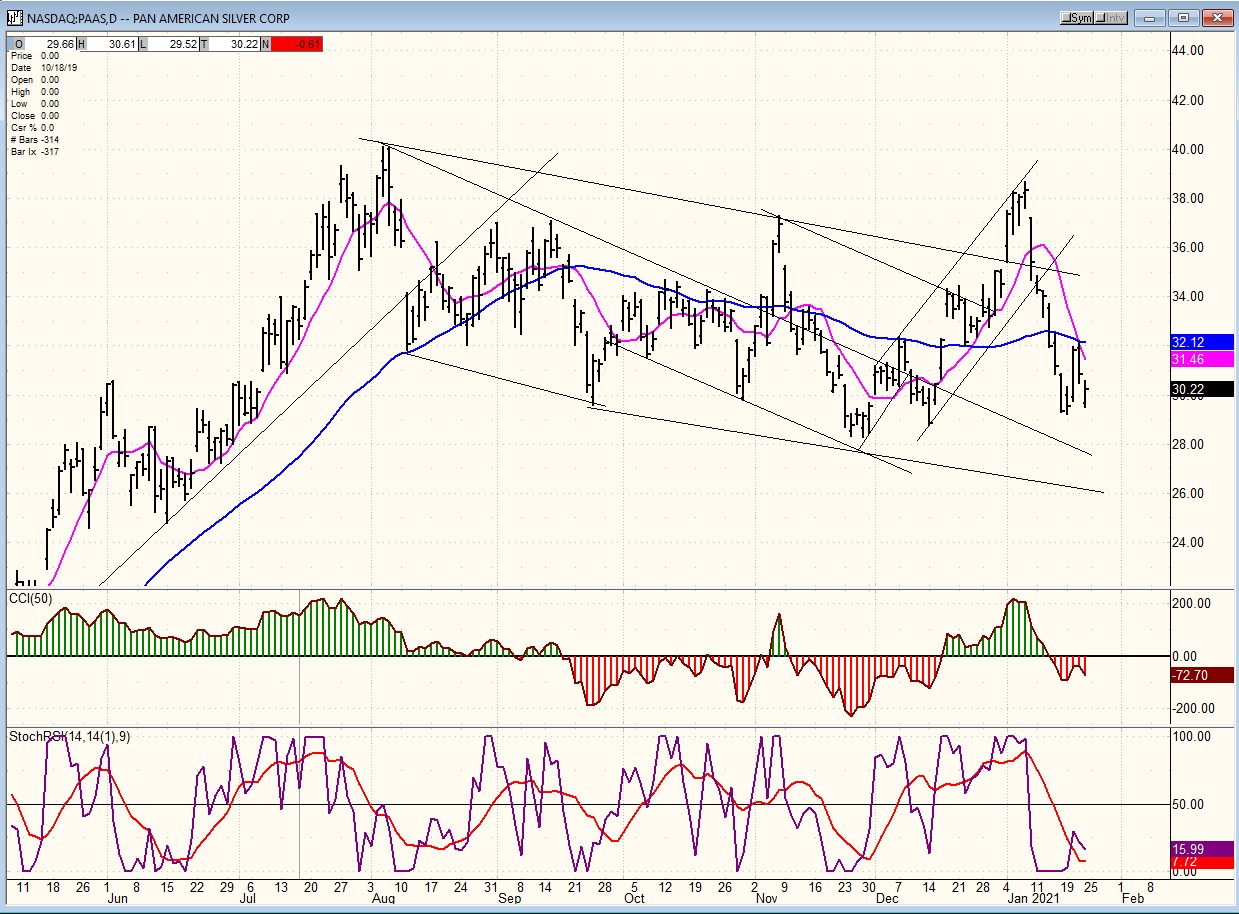
PAAS (Pan American Silver Corp-DLY)
As GDX, PAAS is putting the final touch on its correction, but it could wait until mid-February before it is ready to turn up.
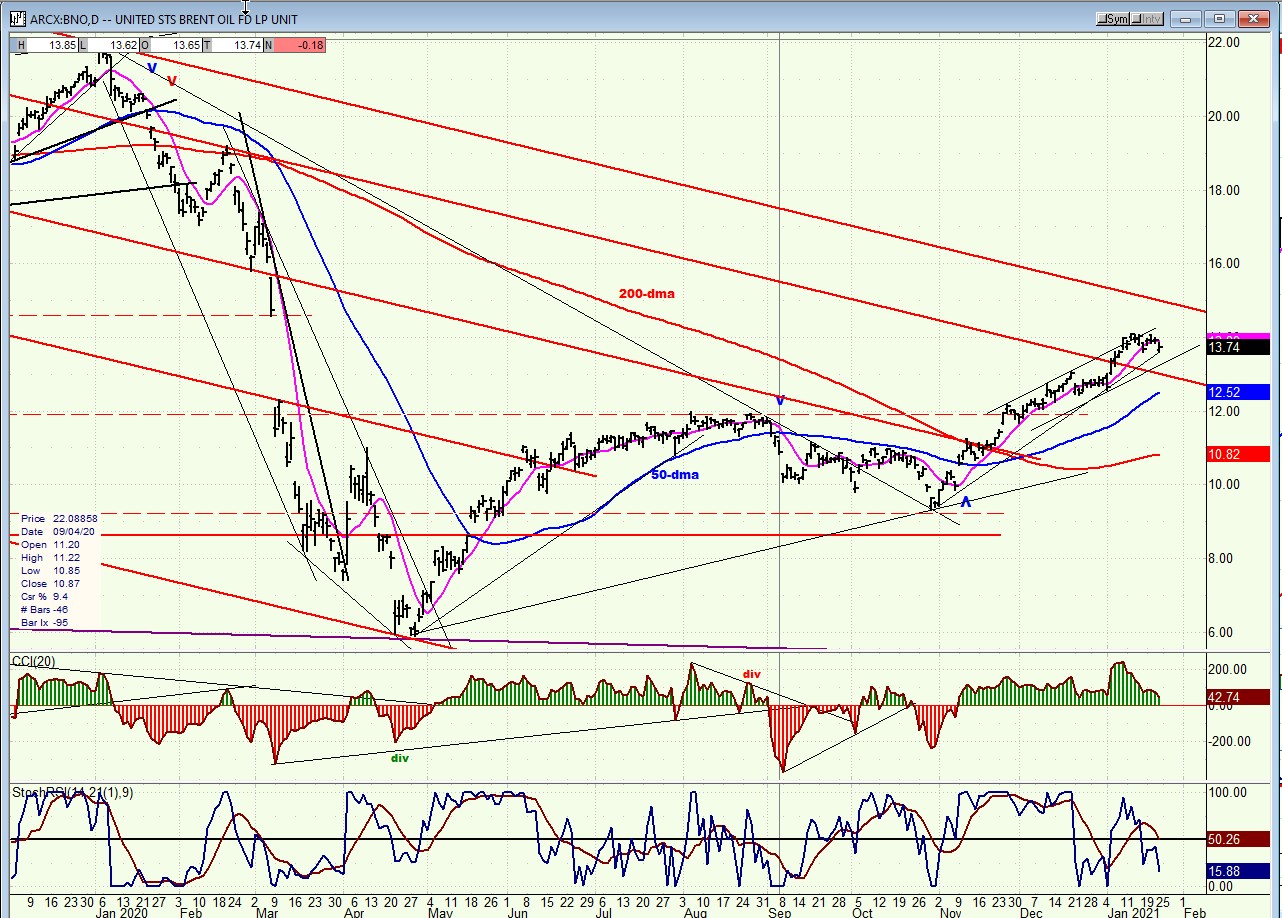
BNO (U.S. Brent Oil fund)
Now that BNO has reached its initial target of 14, it should undergo a slight consolidation before moving to 16.
SUMMARY
SPX reached another all-time high, created a minor top, and should correct into next week before resuming its intermediate uptrend.
The above comments and those made in the daily updates and the Market Summary about the financial markets are based purely on what I consider to be sound technical analysis principles. They represent my own opinion and are not meant to be construed as trading or investment advice but are offered as an analytical point of view which might be of interest to those who follow stock market cycles and technical analysis.
*********

When Andre Gratian was a stock broker years ago, a friend introduced him to technical analysis of the market. Consequently, it is not an exaggeration to say that Andre fell in love with this approach! Ever since then, it has become an increasingly important part of his professional life. Gratian has studied the works of Wyckoff, Edwards & Magee, Edward J. Dewey (cycles) and many others. However, one of my most profitable undertaking has probably been to study Point & Figure charting, which he finds invaluable in analyzing stocks and indices. If he were restricted to one methodology, this is the one that he would choose. This well-rounded background has given him what he feels to be a special insight into the stock market, facilitating the recognition of meaningful patterns and the ‘turning points’ in all trends, whether they be short or long term. Andre feels very comfortable discussing the stock market and passing on meaningful information to others. His subscribers include individuals and money managers throughout the world. Moreover, his Newsletters are currently published on several financial sites, here and abroad.


