Technical Analysis Of The Markets


Current Position of the Market
SPX Long-term trend: There is some good evidence that we are still in the bull market which started in 2009 and which could continue into the first quarter of 2021 before coming to an end.
SPX Intermediate trend: May continue until SPX reaches ~ 4150.
Analysis of the short-term trend is done daily with the help of hourly charts. They are important adjuncts to the analysis of daily and weekly charts which determine longer market trends.
Bump in the Road?
Cycles: Looking ahead! 90-yr cycle – last low: 1932. Next low: 2022
7-yr cycle – last low: 2016. Next low: 2023
Market Analysis (Charts courtesy of QCharts
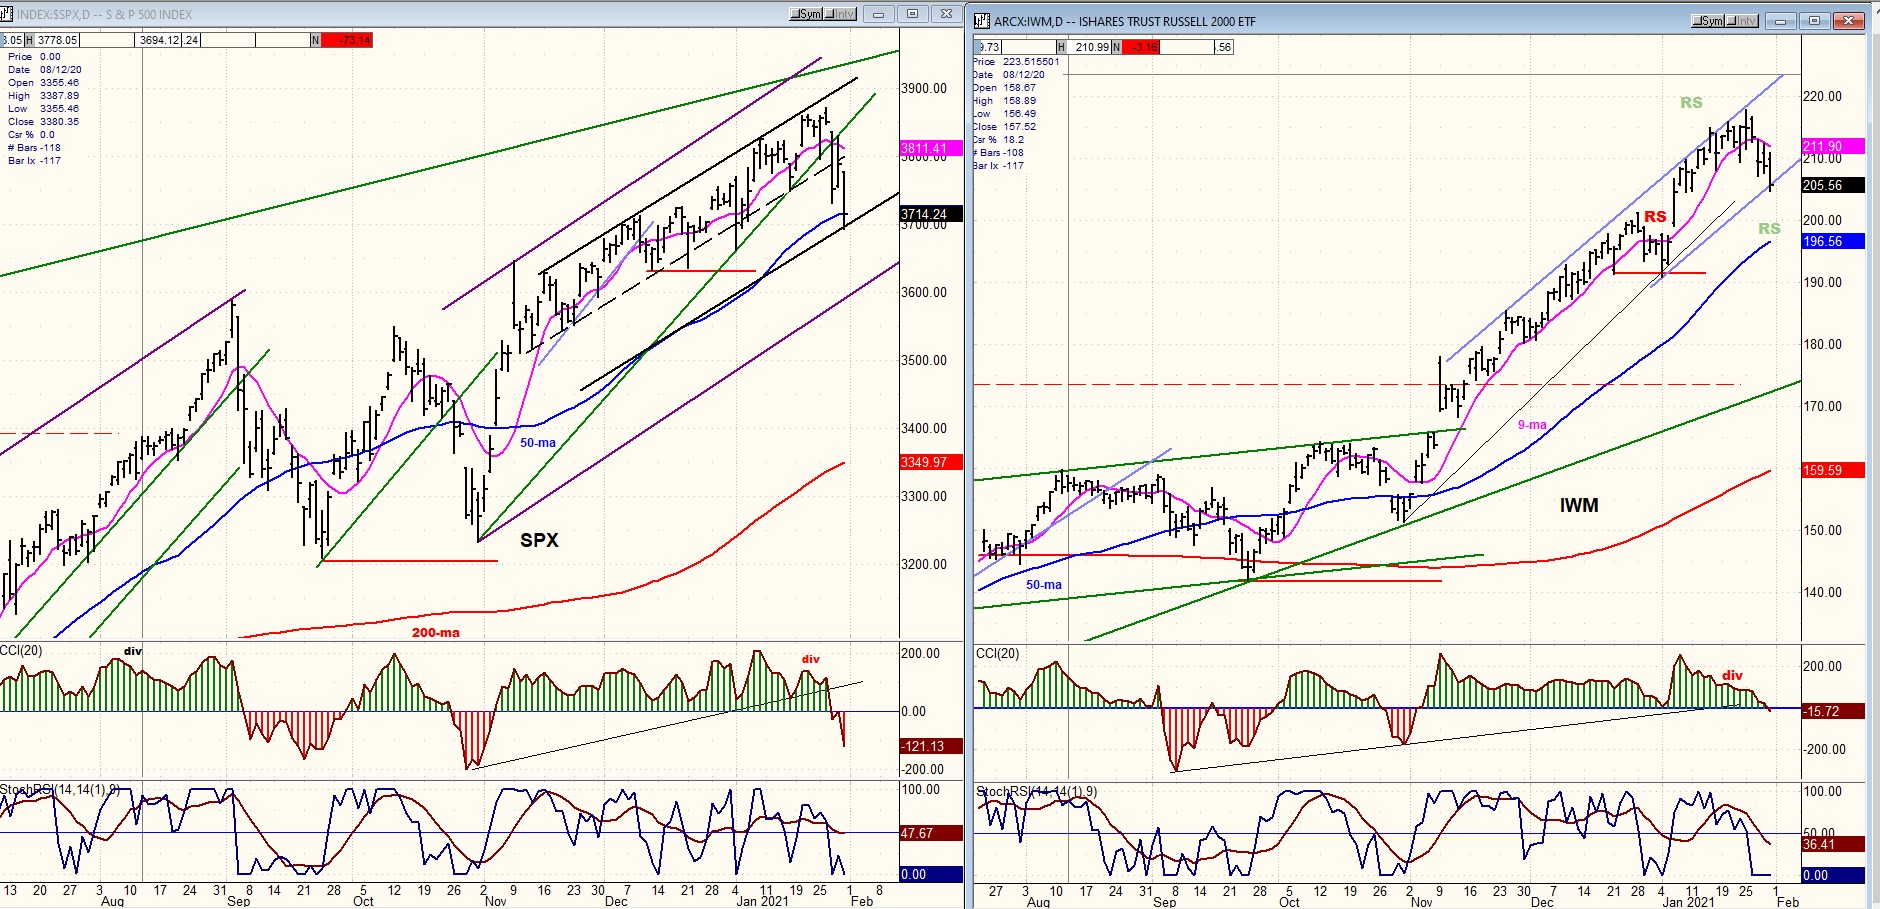
SPX-IWM daily charts
This is the biggest retracement by SPX since a new intermediate trend started on 10/30. IWM did not give warning that this was coming, except for some negative divergence in its oscillators, but this is not enough to suggest that we have started an important correction. Also, IWM remains stronger than SPX for the time being.
SPX daily chart
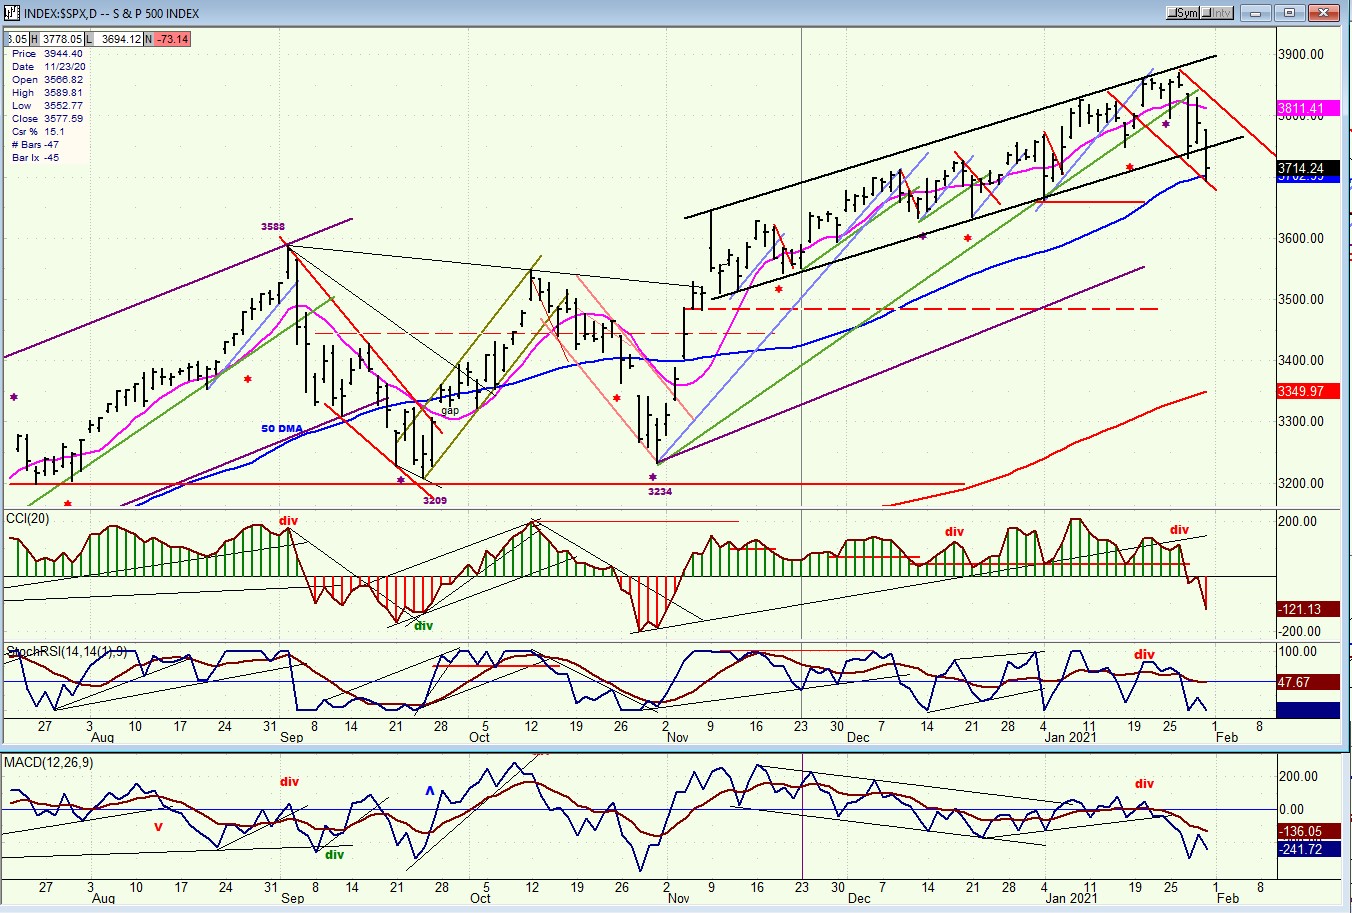
In the last newsletter I warned that breaking below the green trend line which started in late October would initiate a correction, but I did not expect it to be anything severe since there was not warning from IWM. In fact, this is turning into the biggest correction since the beginning of the new intermediate uptrend. Still, although I believe the correction could last until mid-February, I do not think that it will turn out to be anything major. At the most, based on the degree of distribution in the P&F chart, I would not expect the retracement to go beyond 3640.
I had also mentioned that we should be wary of the negative divergence that had developed in the daily oscillators. This does not always result in an important correction but first, it depends on whether the CCI goes negative, and then how long it remains in that state. In this case, it did go negative on the first day of the decline and it remains so. We should wait for positive divergence to re-appear before expecting an end of the correction to occur.
Structurally, the majority of corrections take place in a three-wave pattern (a-b-c), and by Friday we were most likely approaching the end of the a-wave. If so, it could be the middle of the month before the entire structure is complete; perhaps in conjunction with the next 20-td cycle low due about 2/10-12.
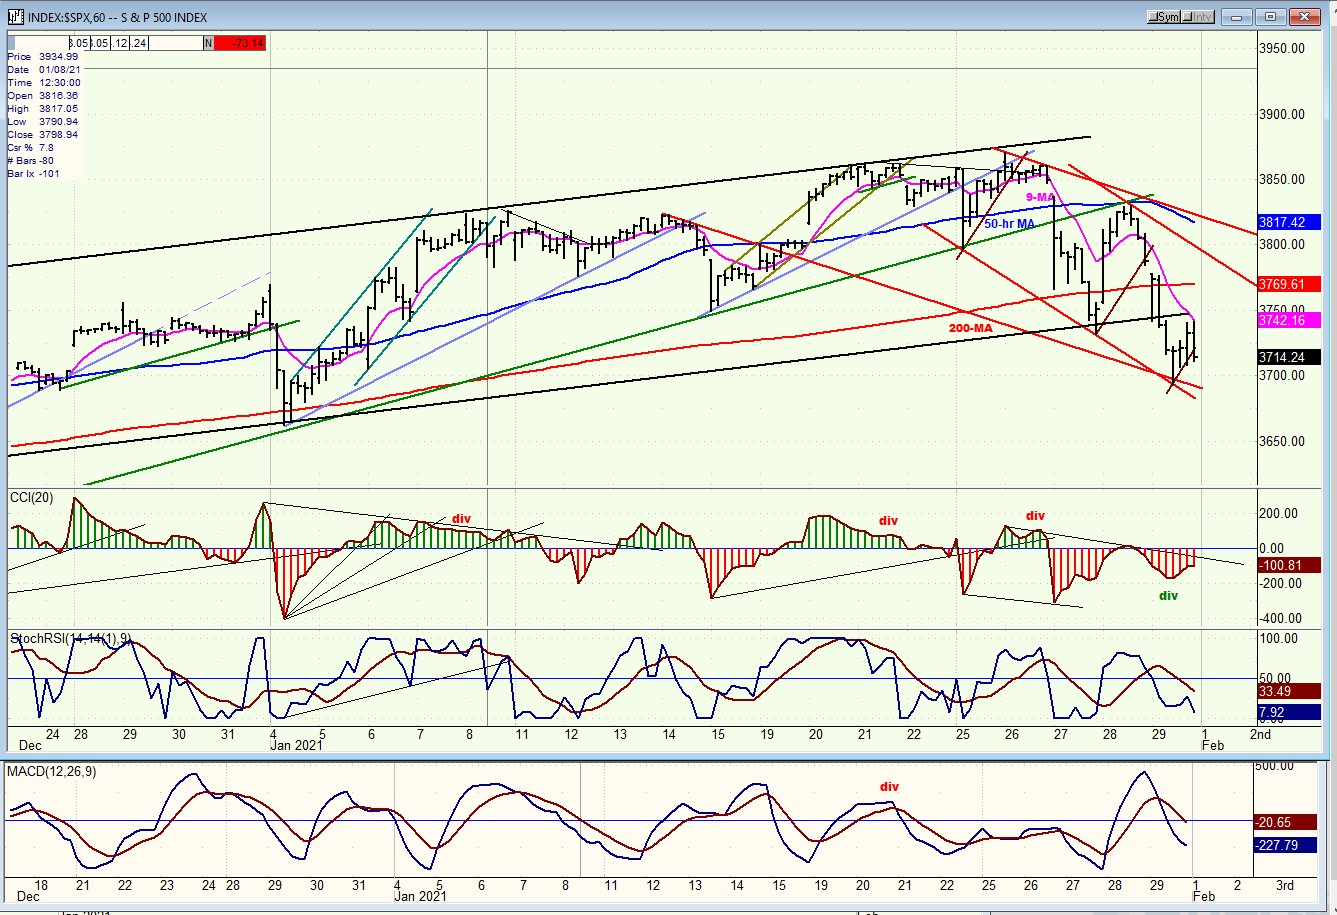
SPX hourly chart
The green trend line had three points of contact which provided support, but the fourth time SPX turned down it went right through it and kept on going for an initial drop of 138 points from the 3870 high. Most of this took place on the second day of the decline, followed by a 5-hour rally of 98 points, and a subsequent 7-hour decline of 134 points to match the first leg of the correction as volatility ruled! By the end of the week it was subsiding, and some deceleration was beginning to appear in the selling, but there could be some residue weakness on Monday before we complete the a-wave. Positive divergence is already showing in the CCI, but the other two oscillators are still in a downtrend.
Congestion had been forming at the channel top for a few days before the decline started, and it is from this pattern that we can derive a potential count for the entire correction (3640). The size of the pattern is the reason why a severe correction should not be expected; but volatility, its primary feature, could continue until it ends.
If this is only the a-wave of the correction, we are one third of the way through it and will need waves “b” and “c” to complete it.
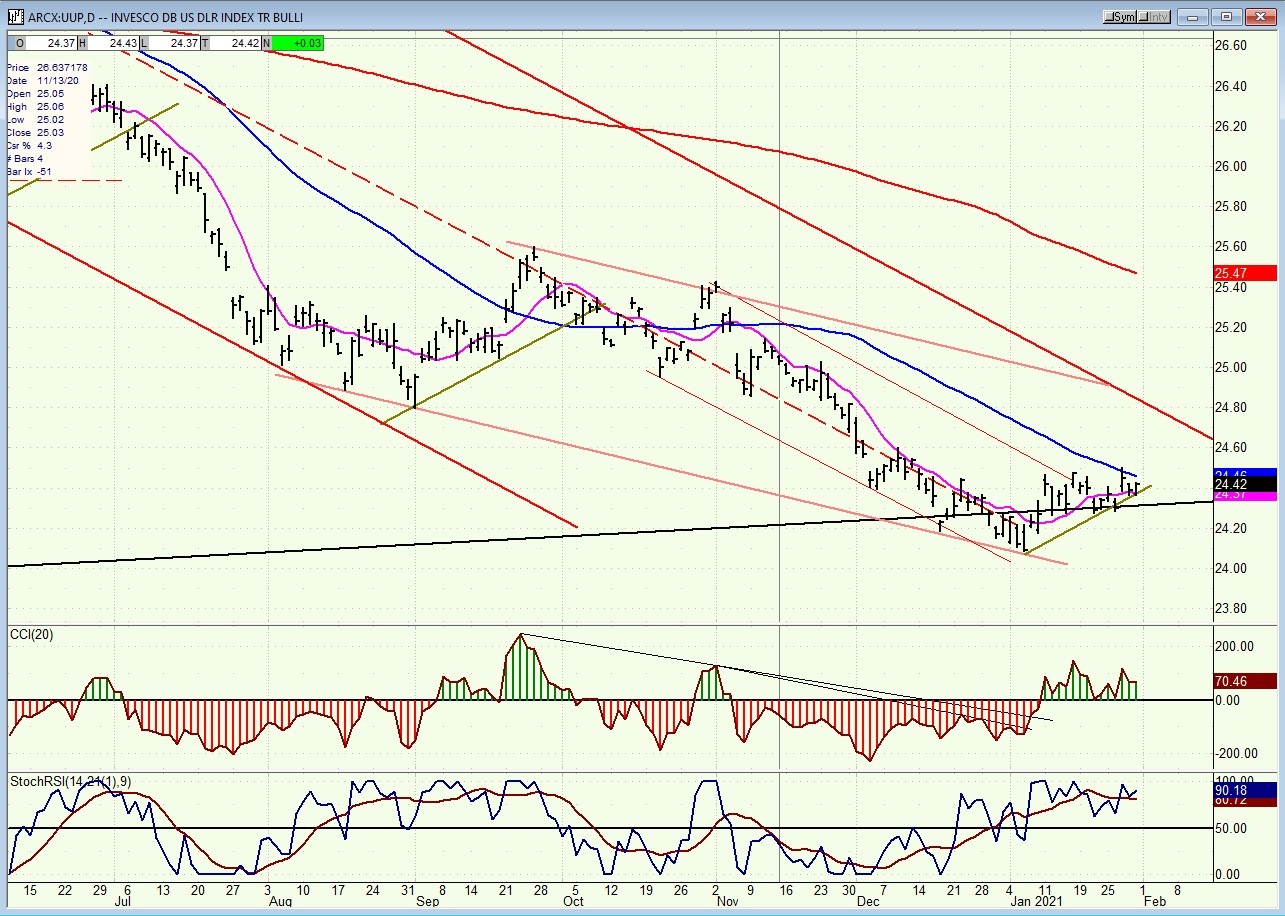
UUP (dollar ETF) WKLY ($USD chart not available from this data provider)
UUP continues the uptrend that it started a month ago. It reached its 50-dma and was pushed back slightly but may go through it without losing much ground. It already consolidated after touching a small downtrend channel line and immediately resumed its attempt at moving higher. Most likely, the index has started a move to the top of the larger bearish channel -- currently around 24.70 -- where it should find more resistance.
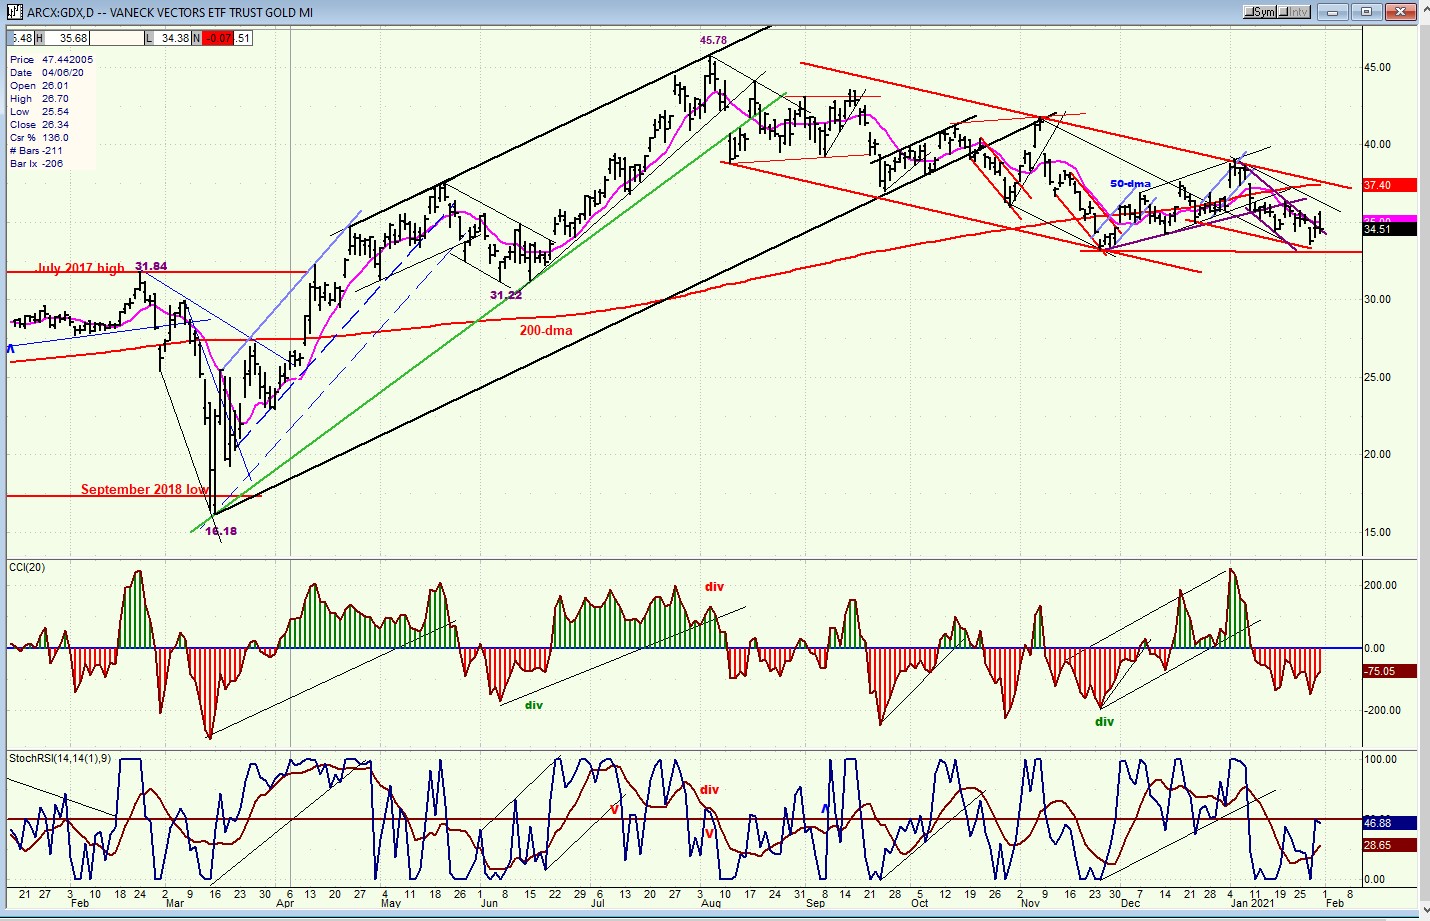
GDX (gold miners)-DLY
GDX is in the last throes of its corrective move. In another week or so, it should be ready to challenge the top of its correction channel line where it is not likely to meet a great deal of resistance since this will be the third challenge of that trend line, and since it has already built enough of a short-term P&F base to go through it.
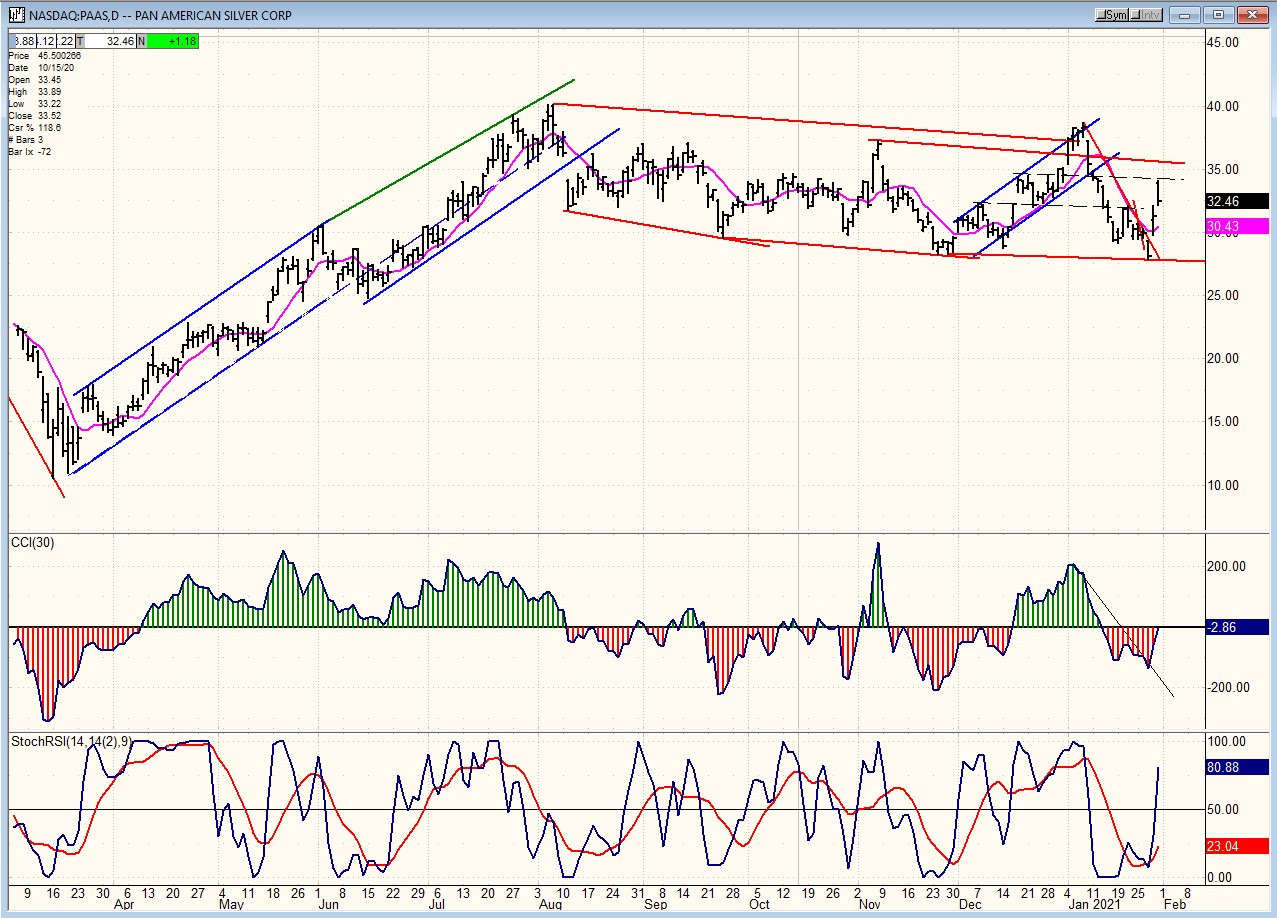
PAAS (Pan American Silver Corp-DLY)
PAAS looks even more ready than GDX to end its correction. It is also more volatile, as witnessed by its action of the past two months during which it broke well above its top corrective channel line before dropping back to make a new (one day) correction low. With an incipient rebound (b-wave) in the stock market, both GDX and PAAS could move a little higher (PAAS 35-37) before a final pull-back, followed by a clean breakout.
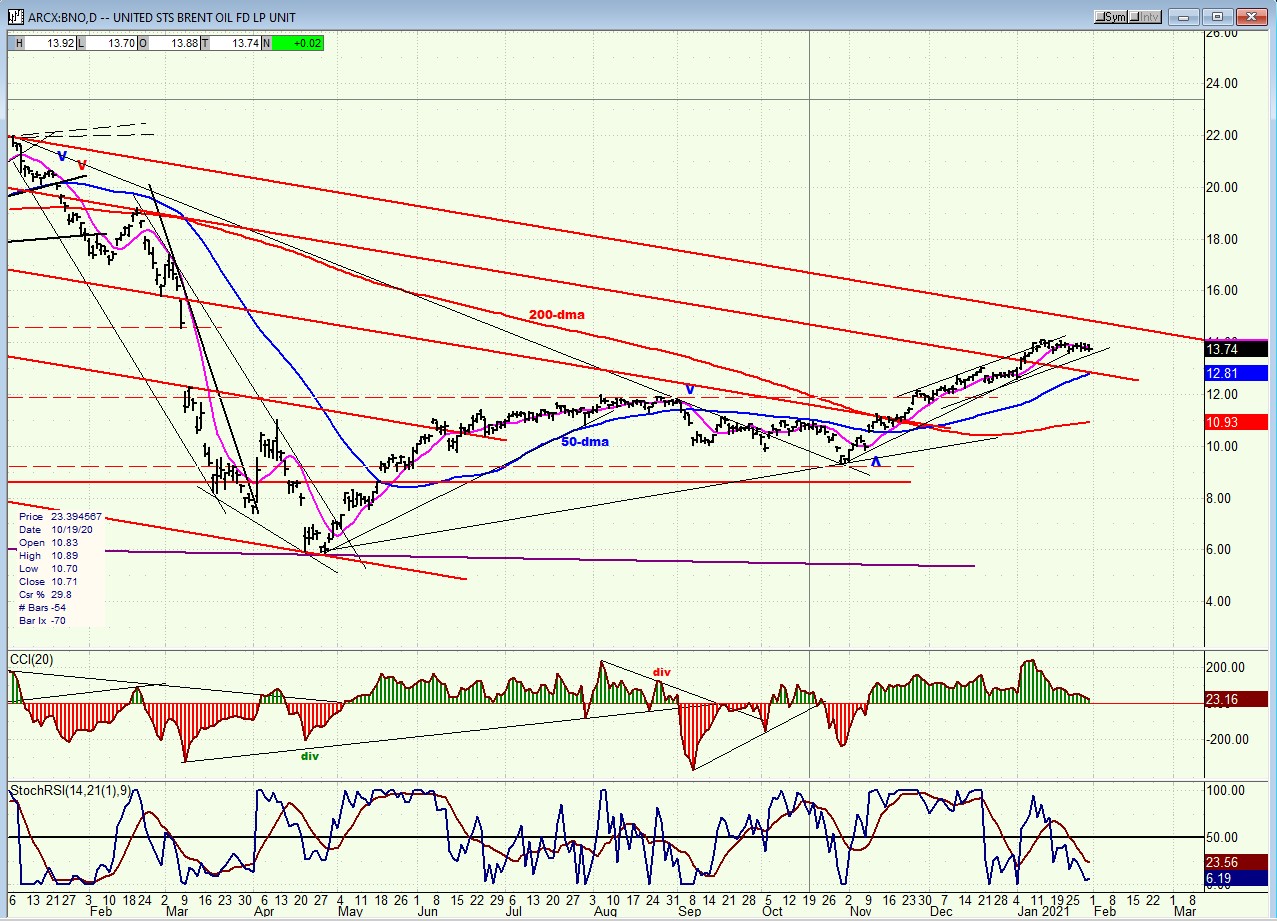
BNO (U.S. Brent Oil fund)
After filling its target of 14, BNO was expected to correct before moving to 16. It may continue to do so while the market completes its short-term correction and then moves higher.
SUMMARY
SPX is undergoing a short-term correction which is already the deepest one since it started its intermediate move from 3234; but it is not expected to last longer than a couple more weeks, or to exceed a low of 3640.
Free trial subscription
With a trial subscription, you will have access to the same information that is given to paid subscribers, but for a limited time-period. Over the years, I have developed an expertise in P&F charting (price projection), cycles (timing), EWT (structure), and general technical analysis which enables me to warn subscribers of pending reversals in market trends and how far that trend can potentially carry. For a FREE 2-week trial, subscription options and payment plans, I encourage you to visit my website at www.marketurningpoints.com.
The above comments and those made in the daily updates and the Market Summary about the financial markets are based purely on what I consider to be sound technical analysis principles. They represent my own opinion and are not meant to be construed as trading or investment advice but are offered as an analytical point of view which might be of interest to those who follow stock market cycles and technical analysis.
********

When Andre Gratian was a stock broker years ago, a friend introduced him to technical analysis of the market. Consequently, it is not an exaggeration to say that Andre fell in love with this approach! Ever since then, it has become an increasingly important part of his professional life. Gratian has studied the works of Wyckoff, Edwards & Magee, Edward J. Dewey (cycles) and many others. However, one of my most profitable undertaking has probably been to study Point & Figure charting, which he finds invaluable in analyzing stocks and indices. If he were restricted to one methodology, this is the one that he would choose. This well-rounded background has given him what he feels to be a special insight into the stock market, facilitating the recognition of meaningful patterns and the ‘turning points’ in all trends, whether they be short or long term. Andre feels very comfortable discussing the stock market and passing on meaningful information to others. His subscribers include individuals and money managers throughout the world. Moreover, his Newsletters are currently published on several financial sites, here and abroad.


