Technical Analysis Of The Markets


Current Position of the Market
SPX Long-term trend: There is some good evidence that we are still in the bull market which started in 2009 and which could continue into the first half of 2021 before coming to an end.
SPX Intermediate trend: May continue until SPX reaches ~4050-4150 (March 2021).
Analysis of the short-term trend is done daily with the help of hourly charts. They are important adjuncts to the analysis of daily and weekly charts which determine longer market trends.
Is More Correction Needed?
Cycles: Looking ahead! 90-yr cycle – last low: 1932. Next low: ~2022. (inversion likely)
7-yr cycle – last low: 2016. Next low: 2023
Market Analysis (Charts courtesy of QCharts
The answer to the above question is probably ‘yes’ before we start on the final move toward an intermediate high.
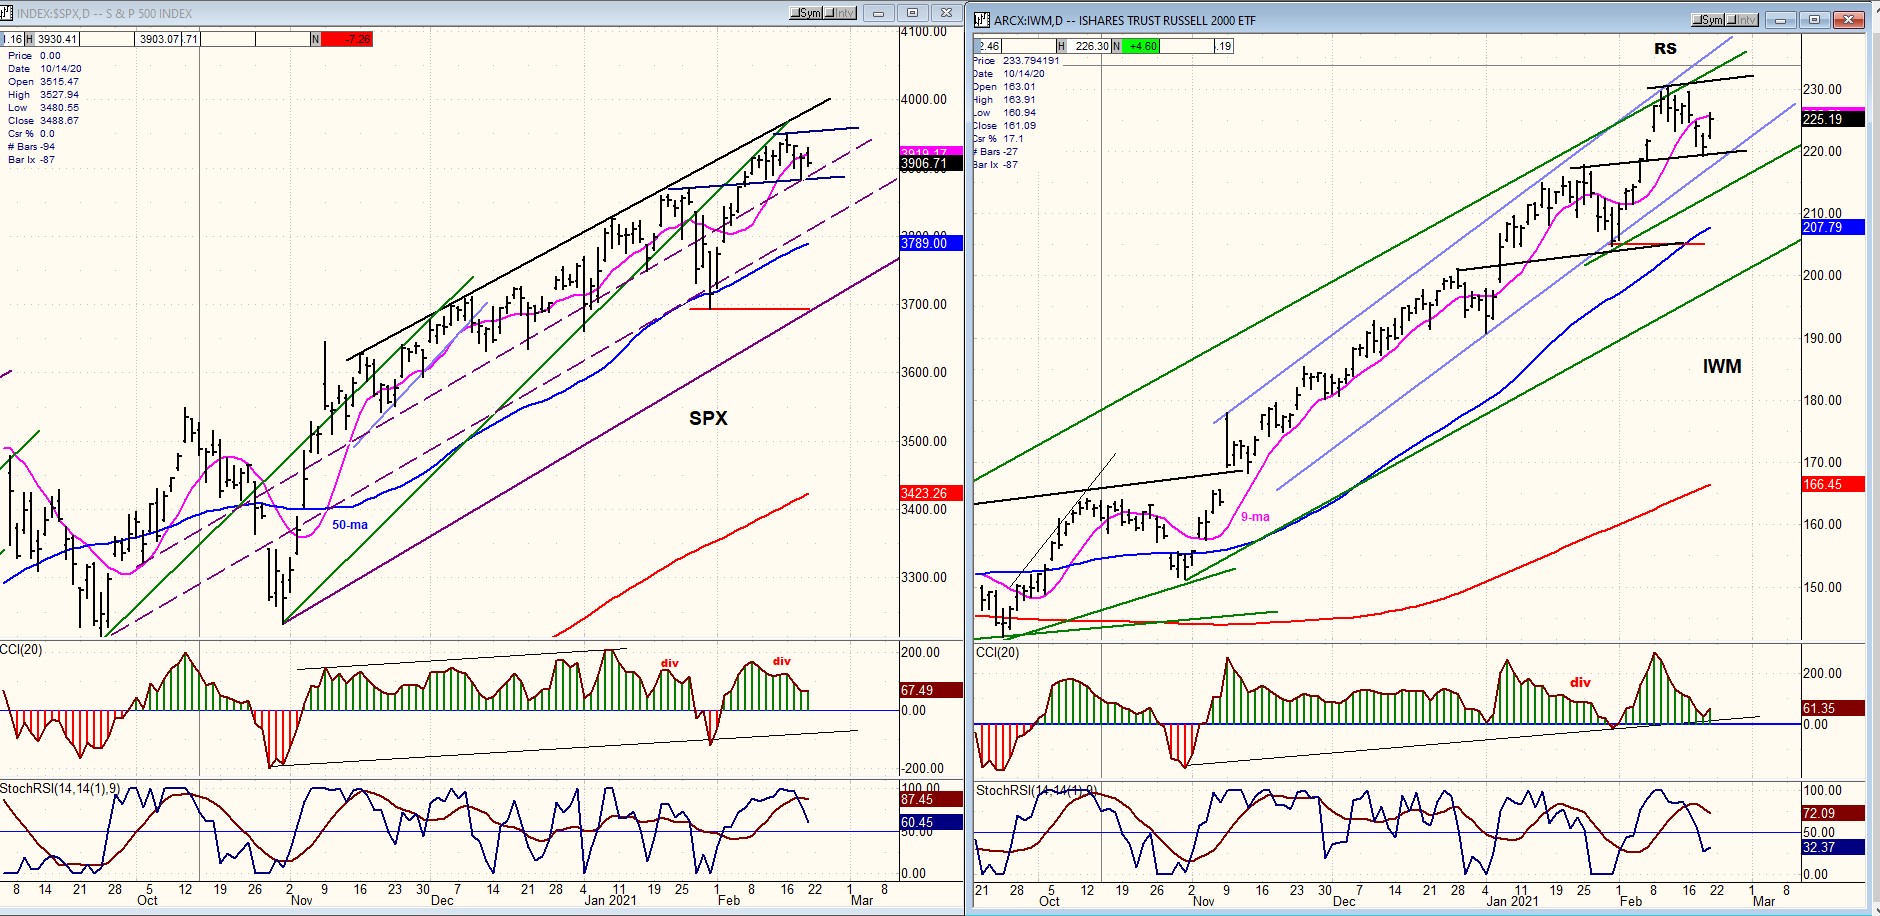
Last week, IWW and SPX both pulled back, found support, and rallied. Still no advance warning of an intermediate top. The minor correction was anticipated and was the headline of the last letter. Is it already over? Probably not! We should find out early next week.
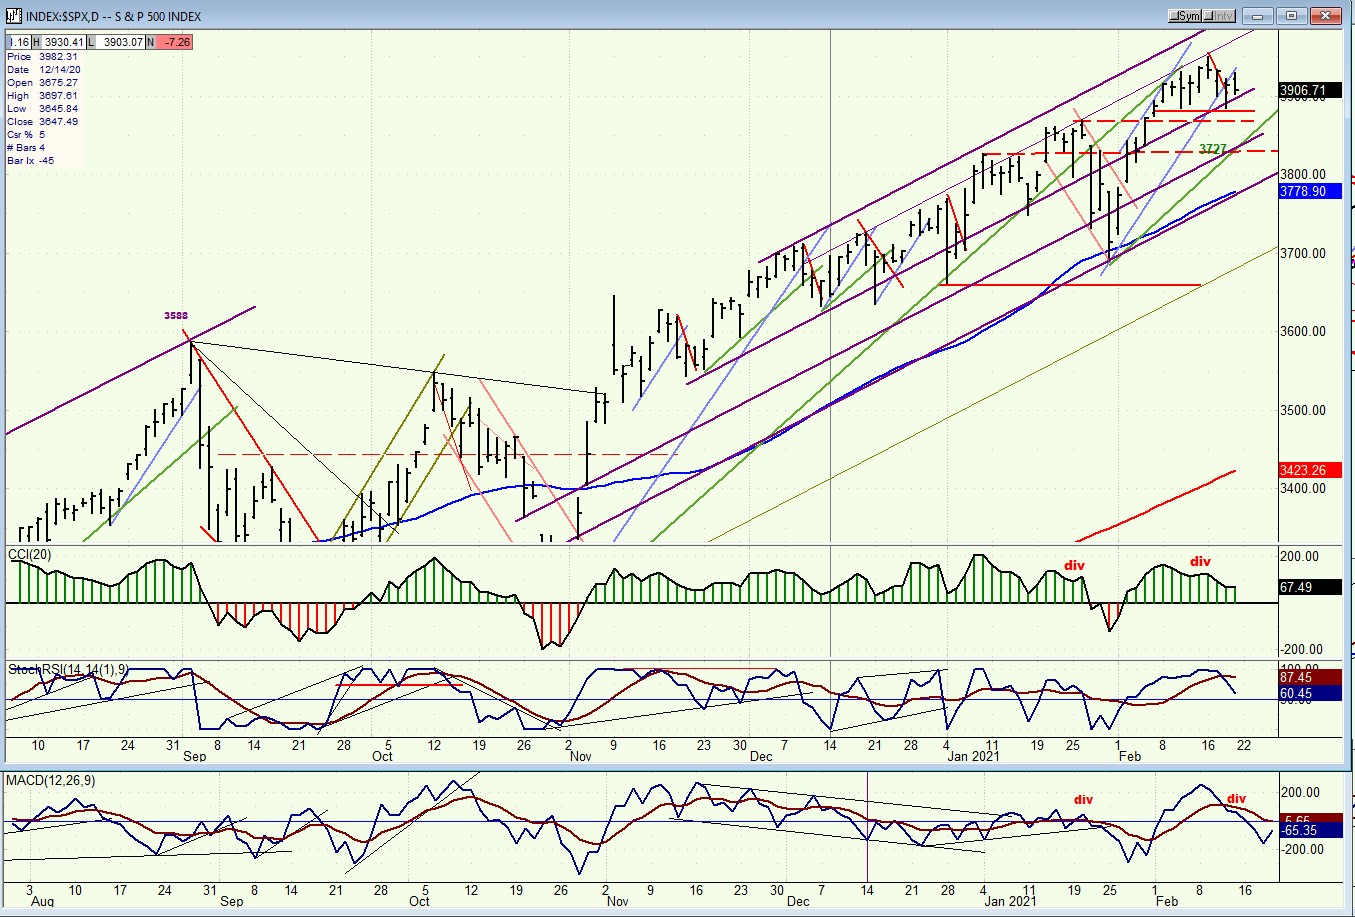
SPX daily chart
Last week, SPX showed some negative divergence in the CCI. This was a warning that a correction was about to take place. The prospect was that the index would come out of the blue channel representing the short-term trend since the 3694 low. It did on Thursday, rallied to the broken trend line on Friday, and started back down.
The initial decline stopped at the low of the previous support as well as on a mid-channel line. This created a red neckline which may be tested again early next week. If it does not hold, the correction should continue down to about 3830 which would represent a 50% retracement of the previous rally, and where there is good support from a previous short-term peak. This level is also confirmed by P&F distribution to the right of the 3950 high. If you look at the chart below, you will see that ~3830 is the area where there is a junction of two other trend lines. This makes it a good candidate for the low of this correction.
But first, SPX will have to break the second black trend line shown on the chart. Also, if 3830 is exceeded, the decline could continue down to the blue 50-dma (~3778) which is also the bottom of the rising channel.
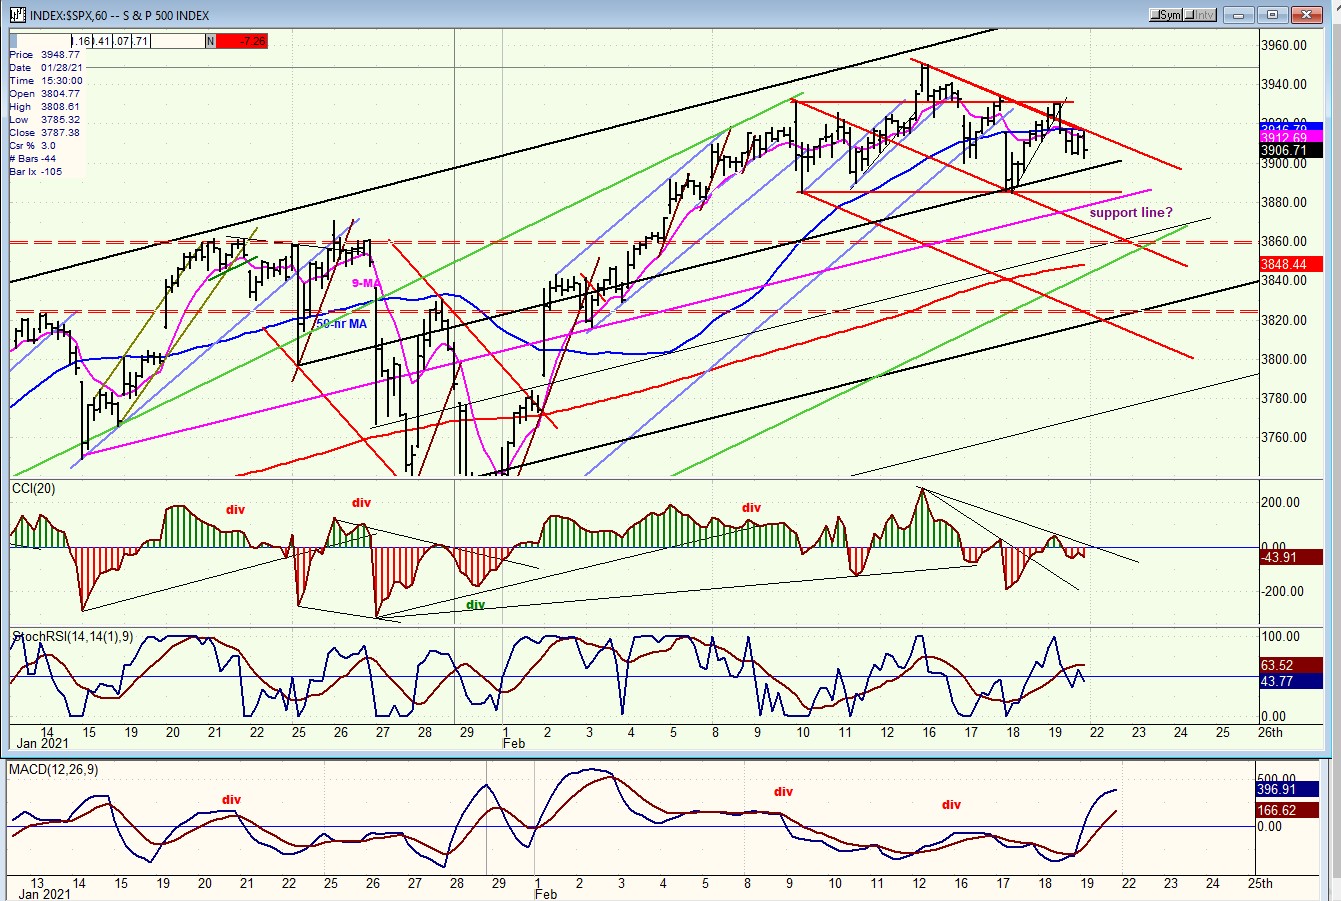
SPX hourly chart
SPX made a new all-time high and started to retrace. There are several valid support and resistance lines drawn on the chart which, as you can see, are all capable of stopping the price action either up or down. After the decline found initial support at a previous low, the index rallied but failed to first surpass the top red resistance line, and then the top red channel line -- which held for four hours on Friday and finally repelled prices into the close – so we can pretty much conclude that the correction is not complete. But this will have to be proven with, first a break below the black trend line, and then the red horizontal support line which held last Thursday.
There are other trend and support lines drawn lower which could indicate where the correction will end. My preference, which is expressed in the daily chart analysis, is in the vicinity of 3830 which combines a 50% retracement, a P&F count and support levels. Should we go beyond, adjustments to the analysis will be provided in the daily updates.
Another possibility is that the index will find support at least temporarily on the magenta trend line. We will know better early next week.
The oscillators are indecisive.
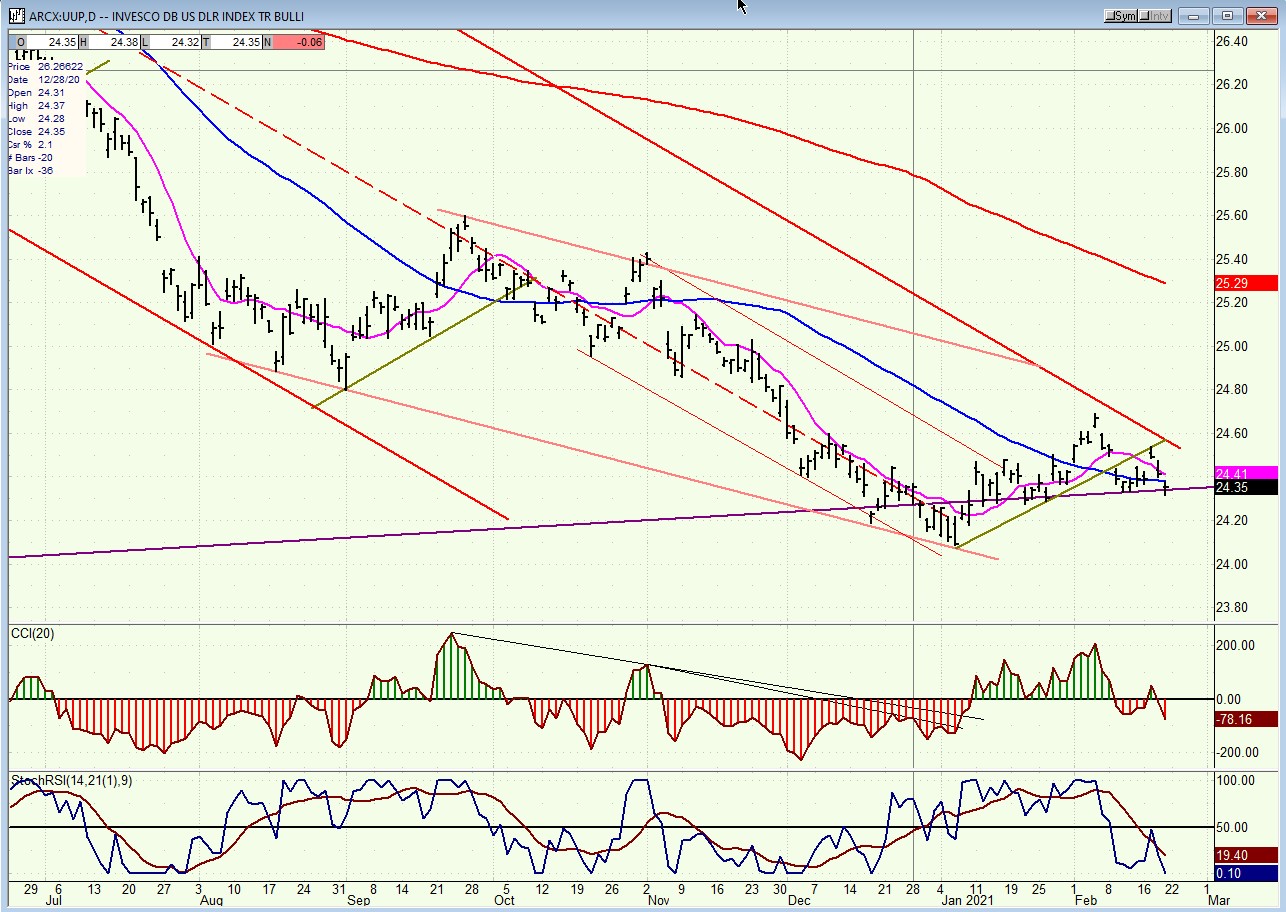
UUP (dollar ETF) WKLY ($USD chart is not available from this data provider)
It looks as if UUP is being repelled by its intermediate red channel line and that it will have to do some additional basing before it can go through it.
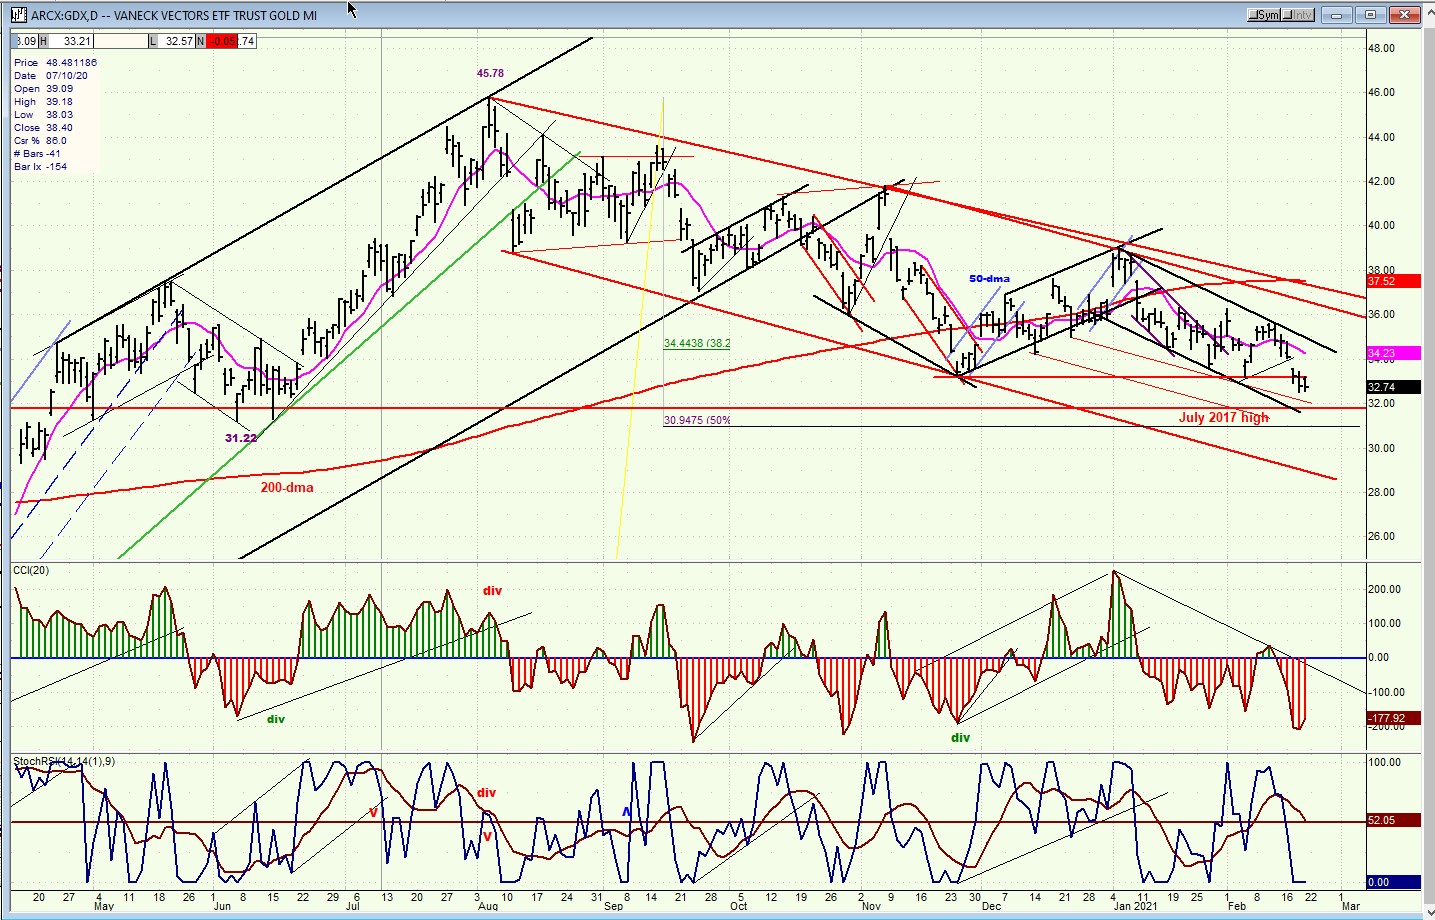
GDX (gold miners)-DLY
GDX is in the vicinity of an important cycle low which should end its consolidation. I had expected this low to come last week, but this week is good enough. There could be one final small climactic spike down, but it is not necessary and, if that should occur, there is important support directly below which should limit any further weakness.
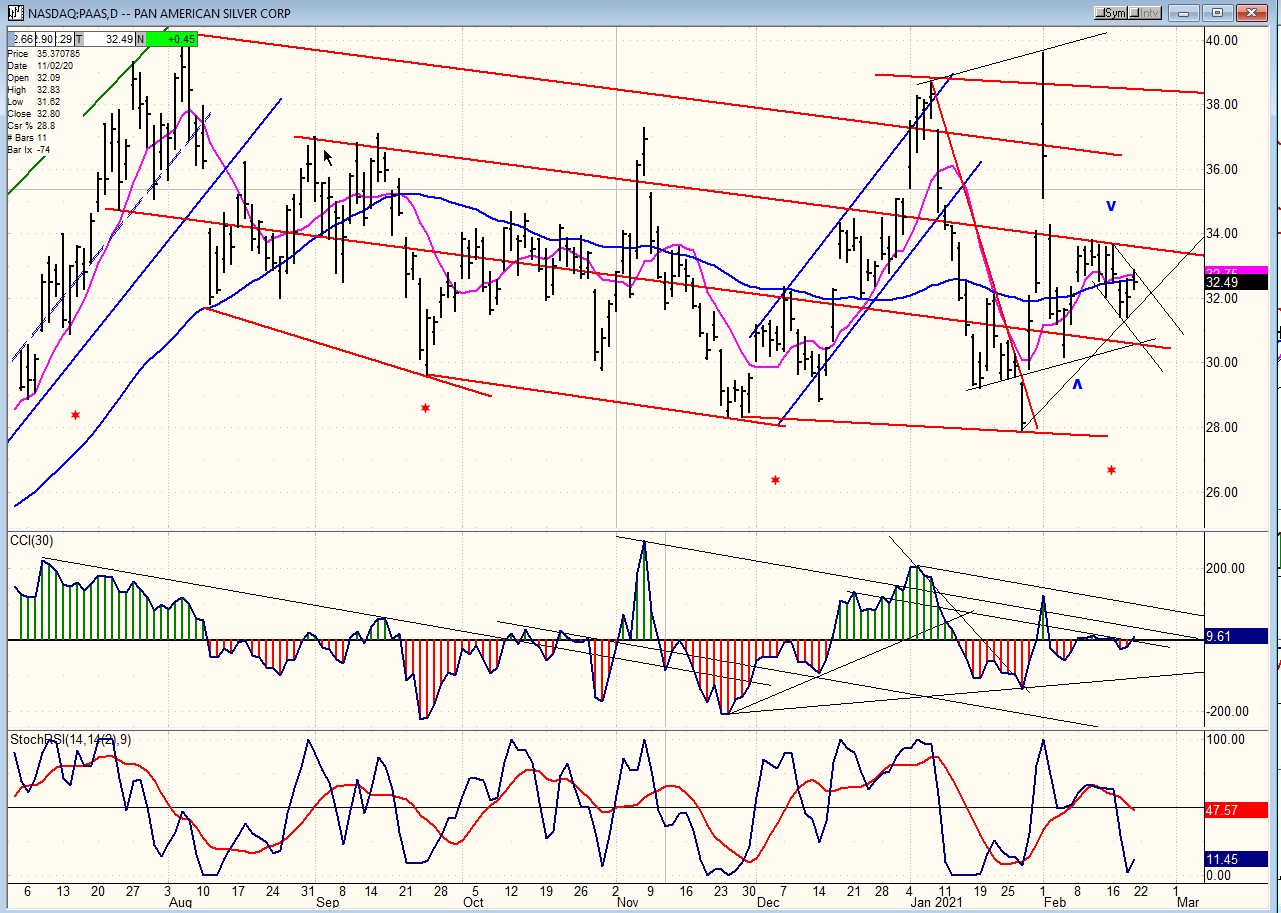
PAAS (Pan American Silver Corp-DLY)
PAAS is subject to the same cycles as GDX, so I could also have a final minor retracement before reversing; but it is stronger than GDX and already well off its lows.
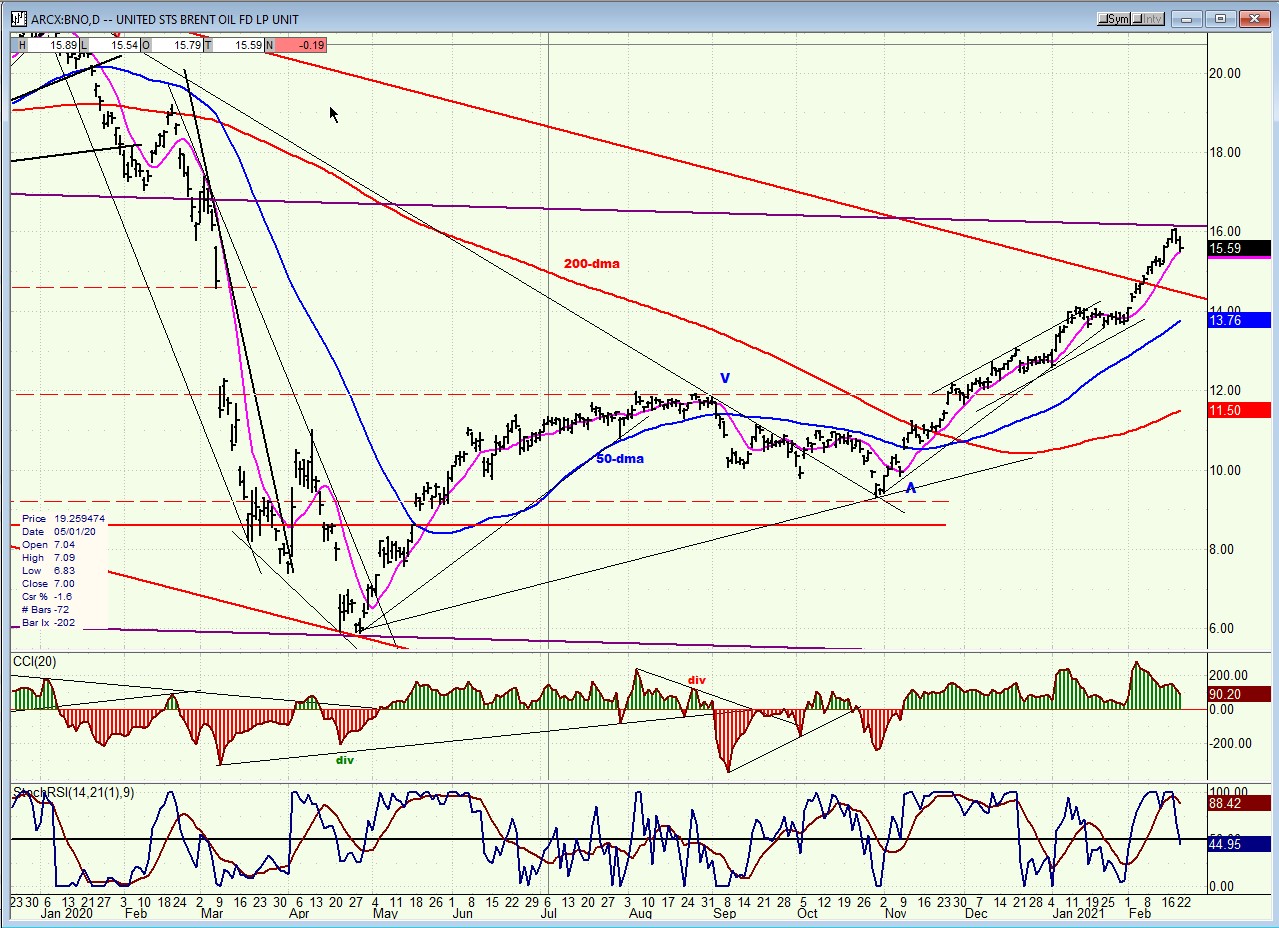
BNO (Brent oil fund) wkly.
BNO has reached its 16.00 projection target and should now consolidate, perhaps after distributing in this area for a little while longer.
SUMMARY
At the end of last week SPX started a minor pullback which may not be complete and could take prices down to 2830 (ideally) and even lower.
Free trial subscription
With a trial subscription, you will have access to the same information that is given to paid subscribers, but for a limited time-period. Over the years, I have developed an expertise in P&F charting (price projection), cycles (timing), EWT (structure), and general technical analysis which enables me to warn subscribers of pending reversals in market trends and how far that trend can potentially carry. For a FREE 2-week trial, subscription options and payment plans, I encourage you to visit my website at www.marketurningpoints.com.
The above comments and those made in the daily updates and the Market Summary about the financial markets are based purely on what I consider to be sound technical analysis principles. They represent my own opinion and are not meant to be construed as trading or investment advice but are offered as an analytical point of view which might be of interest to those who follow stock market cycles and technical analysis.
*********

When Andre Gratian was a stock broker years ago, a friend introduced him to technical analysis of the market. Consequently, it is not an exaggeration to say that Andre fell in love with this approach! Ever since then, it has become an increasingly important part of his professional life. Gratian has studied the works of Wyckoff, Edwards & Magee, Edward J. Dewey (cycles) and many others. However, one of my most profitable undertaking has probably been to study Point & Figure charting, which he finds invaluable in analyzing stocks and indices. If he were restricted to one methodology, this is the one that he would choose. This well-rounded background has given him what he feels to be a special insight into the stock market, facilitating the recognition of meaningful patterns and the ‘turning points’ in all trends, whether they be short or long term. Andre feels very comfortable discussing the stock market and passing on meaningful information to others. His subscribers include individuals and money managers throughout the world. Moreover, his Newsletters are currently published on several financial sites, here and abroad.


