Technical Analysis Of The Markets


Current Position of the Market
SPX Long-term trend: There is some evidence that we are still in the bull market which started in 2009 and which could continue into the first half of 2021 before major cycles take over and it comes to an end.
SPX Intermediate trend: SPX has completed the next phase of its intermediate uptrend and should correct.
Analysis of the short-term trend is done daily with the help of hourly charts. They are important adjuncts to the analysis of daily and weekly charts which determine longer market trends.
Phase Two Projection Reached
Cycles: Looking ahead!
90-yr cycle – Last lows: 1843-1933. Next low: ~2023
40-yr cycle -- Last lows: 1942 -1982. Next low: ~2022
7-yr cycle – Last lows: 2009-2016. Next low: ~2023
Market Analysis (Charts, courtesy of QCharts)
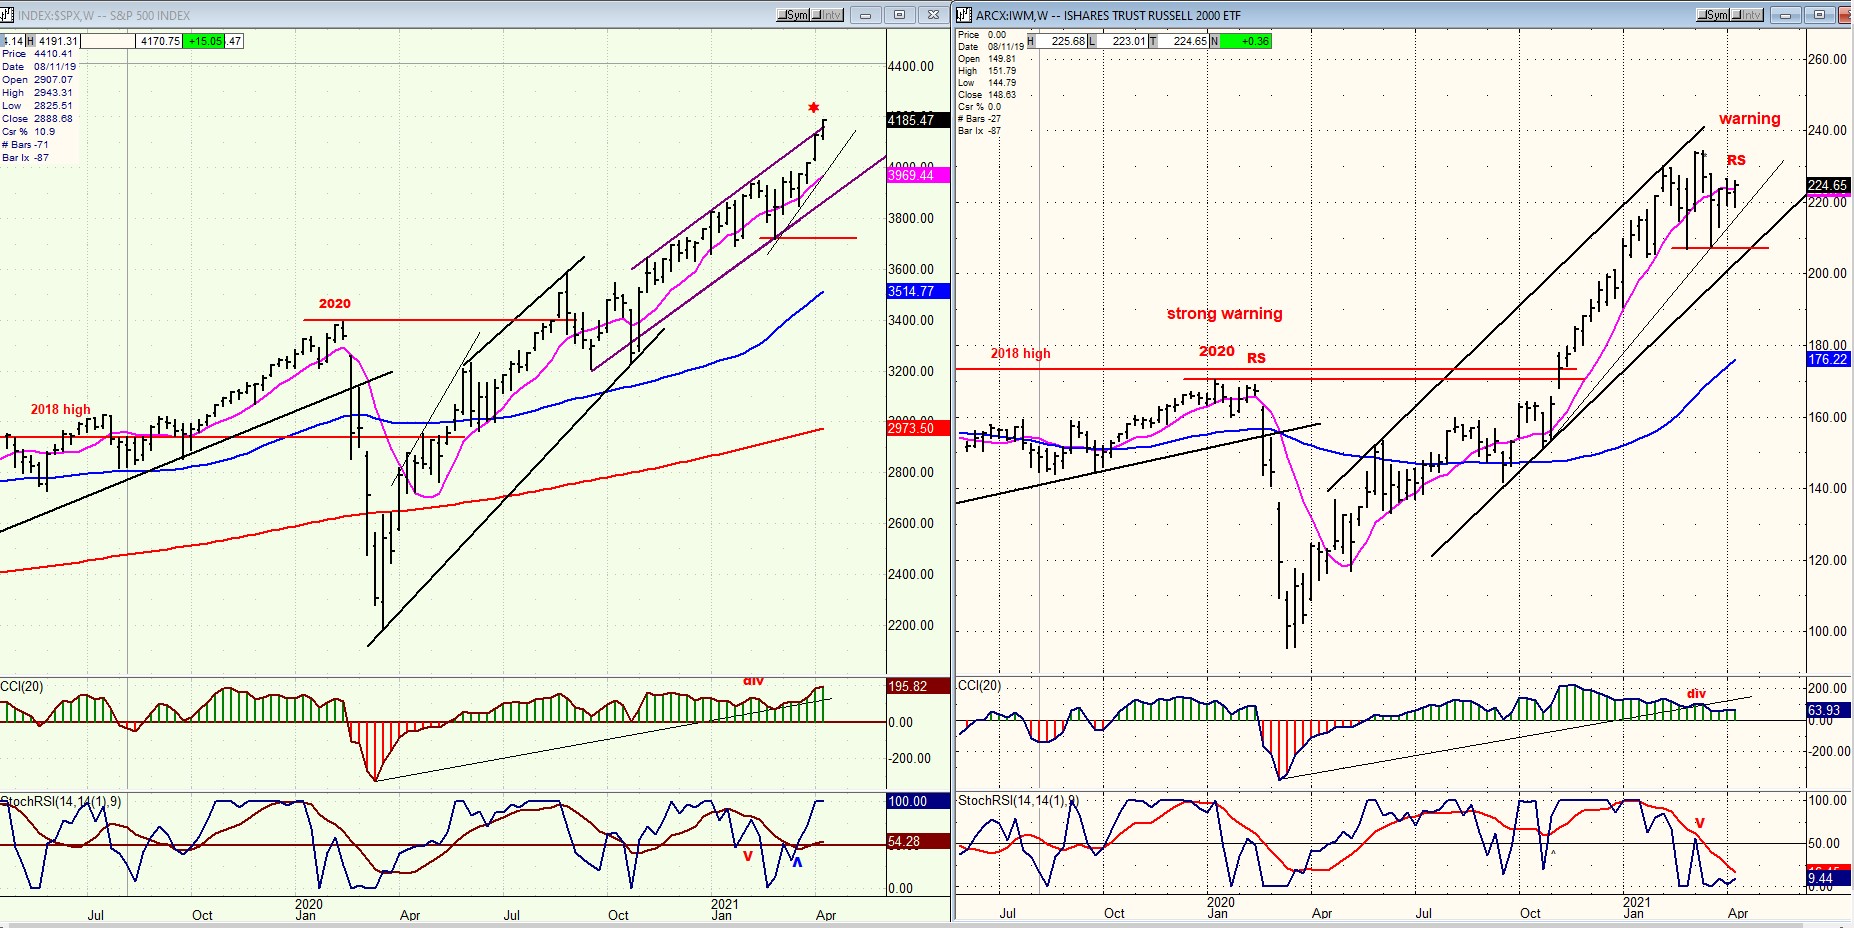
IWM vs SPX (weekly)
For the first time in several months, IWM is showing some significant relative weakness to SPX. In the past, this has been a warning that the latter was about to correct. Since this warning is also duplicated in the daily oscillators -- and since SPX is deemed to have reached an interim price projection -- an imminent reversal should be expected.
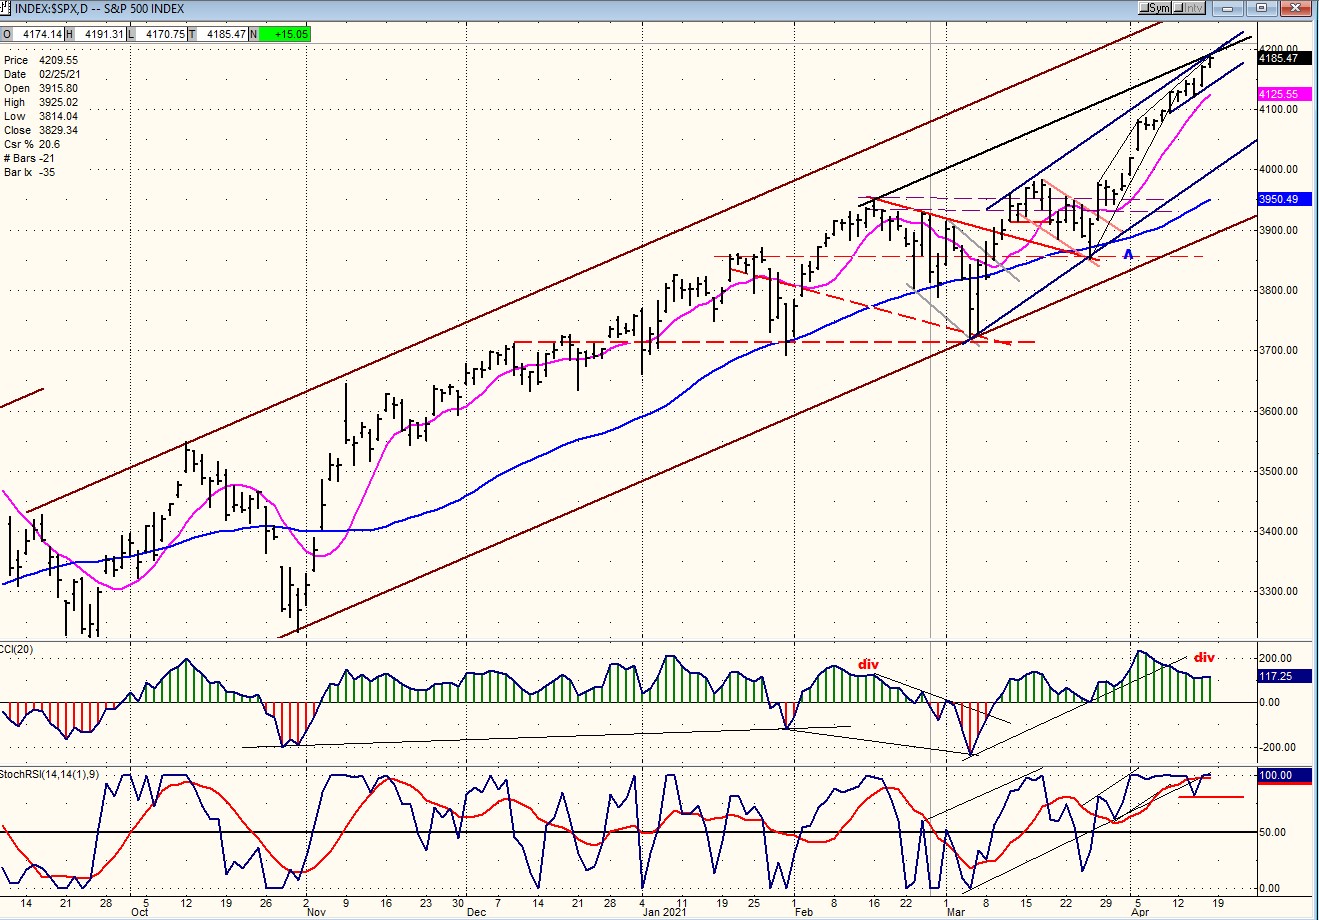
SPX daily chart
There are multiple warning signs that the uptrend which started from 3853 (which represents the second phase of the uptrend from 3723) is coming to an end. To make these as clear as possible, they are listed below:
1 – To begin with, the P&F congestion formed at the 3950 level gave us a count of 4180-4200. On Friday, SPX reached 4191 in what appeared to be a final, little climactic move in the last minutes of trading before pulling back and closing at 4185.
2 – From 3723, SPX has created a channel the top of which corresponds to the price achieved by the index on Friday. There is a larger channel which originates at the start of the intermediate channel from late October 2020. An internal trend line drawn as a parallel to that larger channel across the 2/16 top intersects with the smaller channel’s top line from 3723. The two combined should provide strong resistance to any further advance.
3 – The CCI is showing a clear negative divergence pattern, and the SRSI appears to be on the brink of a reversal.
4 – IWM is showing relative weakness to SPX -- a pattern which normally takes place just before a reversal in SPX.
The above listed conditions provide an irrefutable warning that SPX has come to the end of the move which started from 3853.
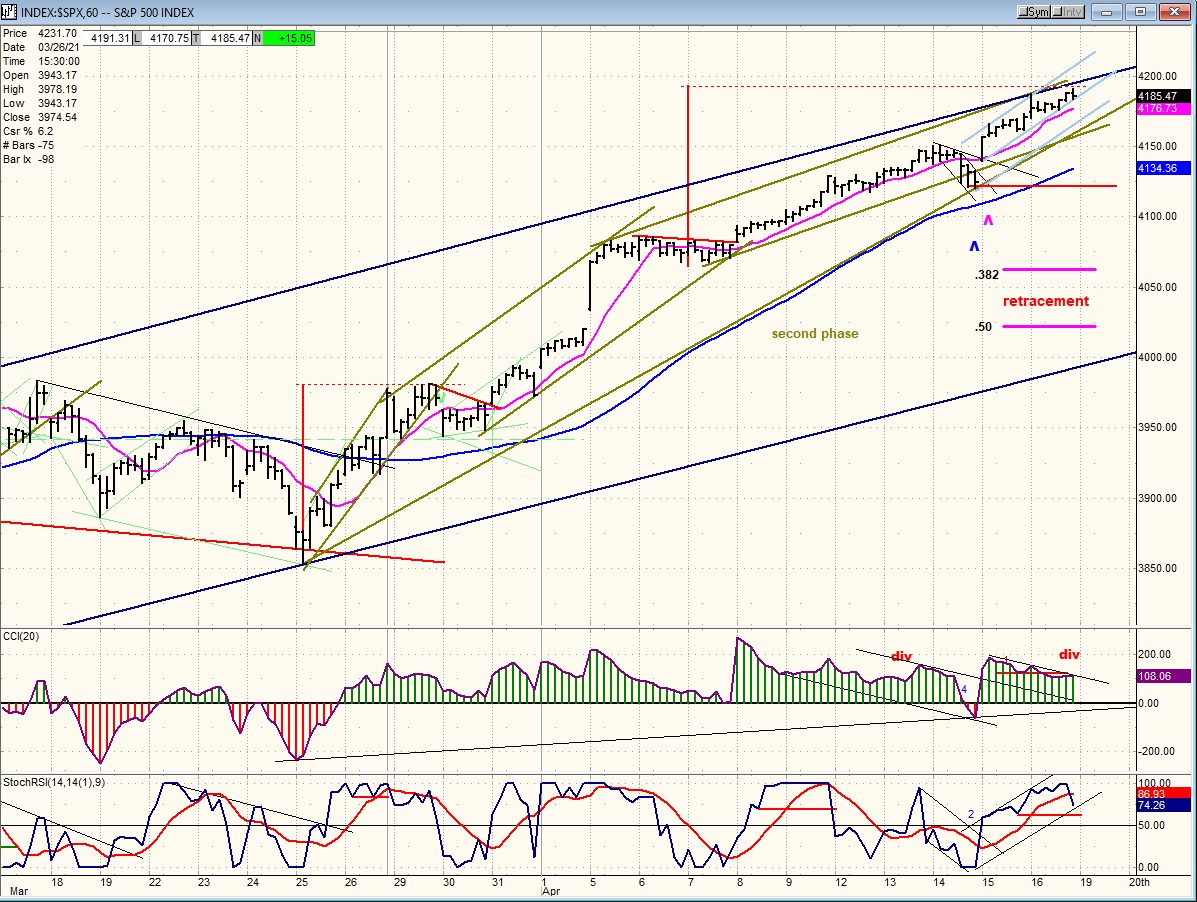
SPX hourly chart
Above, I listed several warning signs appearing at the daily level that a price reversal was imminent. More of the same also exists at the hourly level:
1 – The move from 3853 to 4191 consists of five waves. The fifth wave is of the same height as the first wave, which is a normal occurrence and suggests completion.
2 – The hourly CCI is also showing negative divergence, which reinforces the negativity existing in this indicator at the daily level. Also, the hourly SRSI has already reversed and simply needs to go negative to give a preliminary sell signal which will have to be confirmed by the CCI also going negative. This could come quickly.
If we do get a sell signal from Friday’s close (which appears likely), I have shown what could be anticipated as a normal correction somewhere between a .382 and .50 retracement of the distance between the beginning of the uptrend from 3853 and 4191, with a bias for the larger pullback which would end at approximately at 4022.
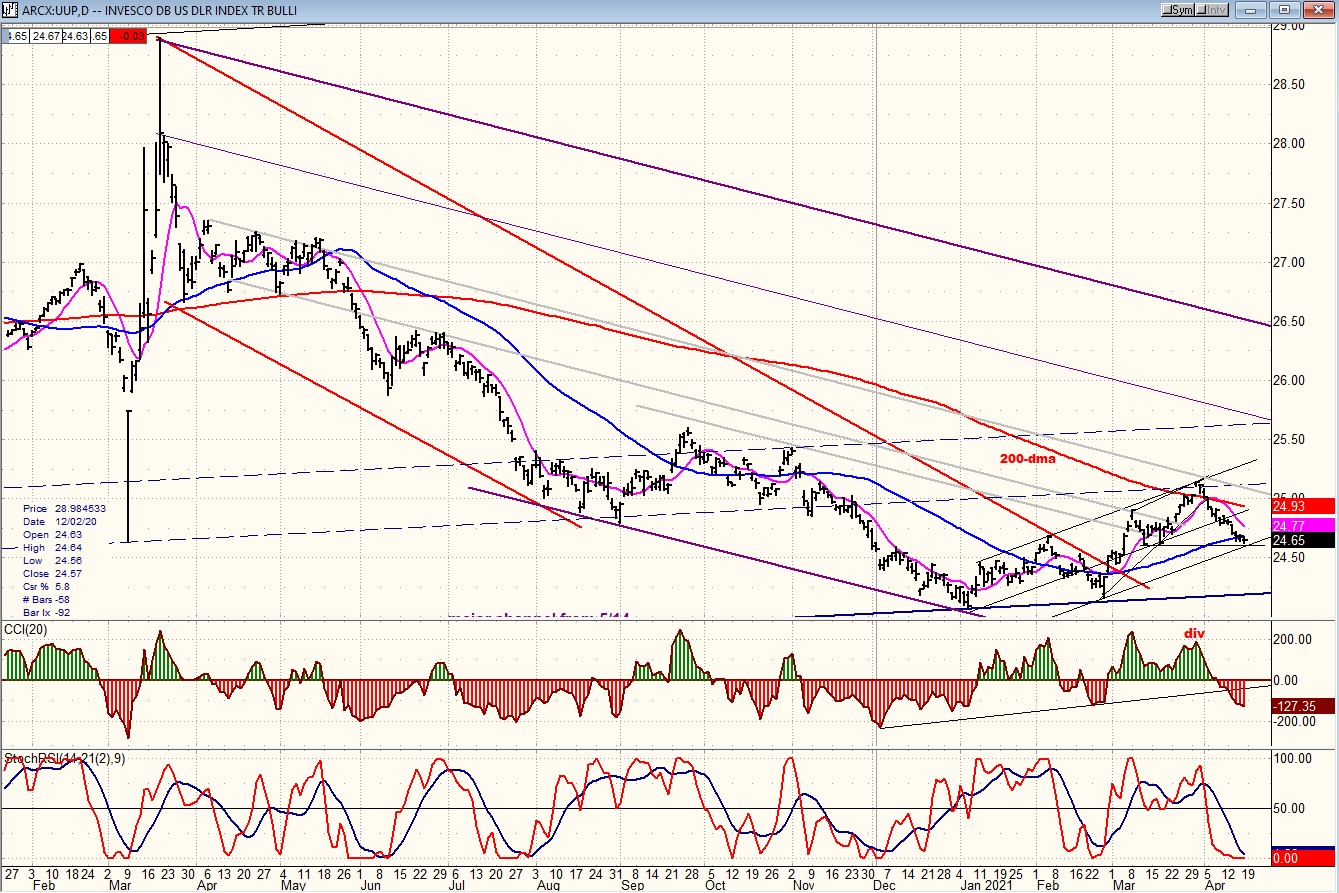
UUP (dollar ETF) DLY ($USD chart is not available from this data provider)
After making a double bottom on its long-term channel line, UUP created a short-term uptrend channel and rose to its top which corresponded with resistance from a previous consolidation pattern, which led to a pullback into last week. It should now find support from the bottom of the short-term channel as well as from the 50-dma, and attempt to resume its short-term uptrend. The 200-dma was breached on the last attempt, but not penetrated. Let’s see if it can be overcome on the next attempt.
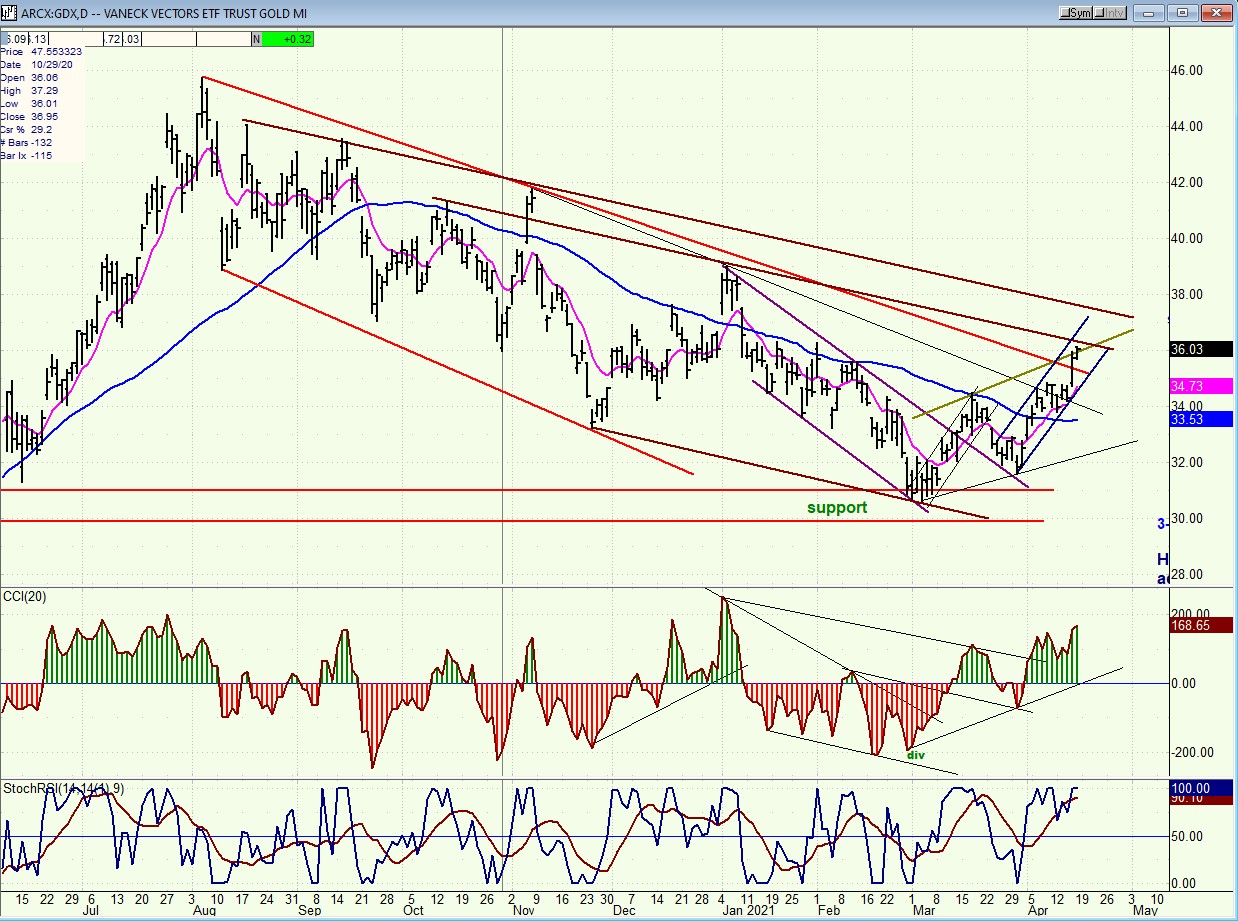
GDX (gold miners)-DLY
GDX has made a second bullish wave and is attempting to break-out of its corrective channel. It is not clear if this move will result in a clean breakout or if more basing will be needed before it resumes its uptrend, but for now a little more consolidation may be needed before it moves higher. The oscillators are suggesting that higher prices are likely, but probably not before a small pause.
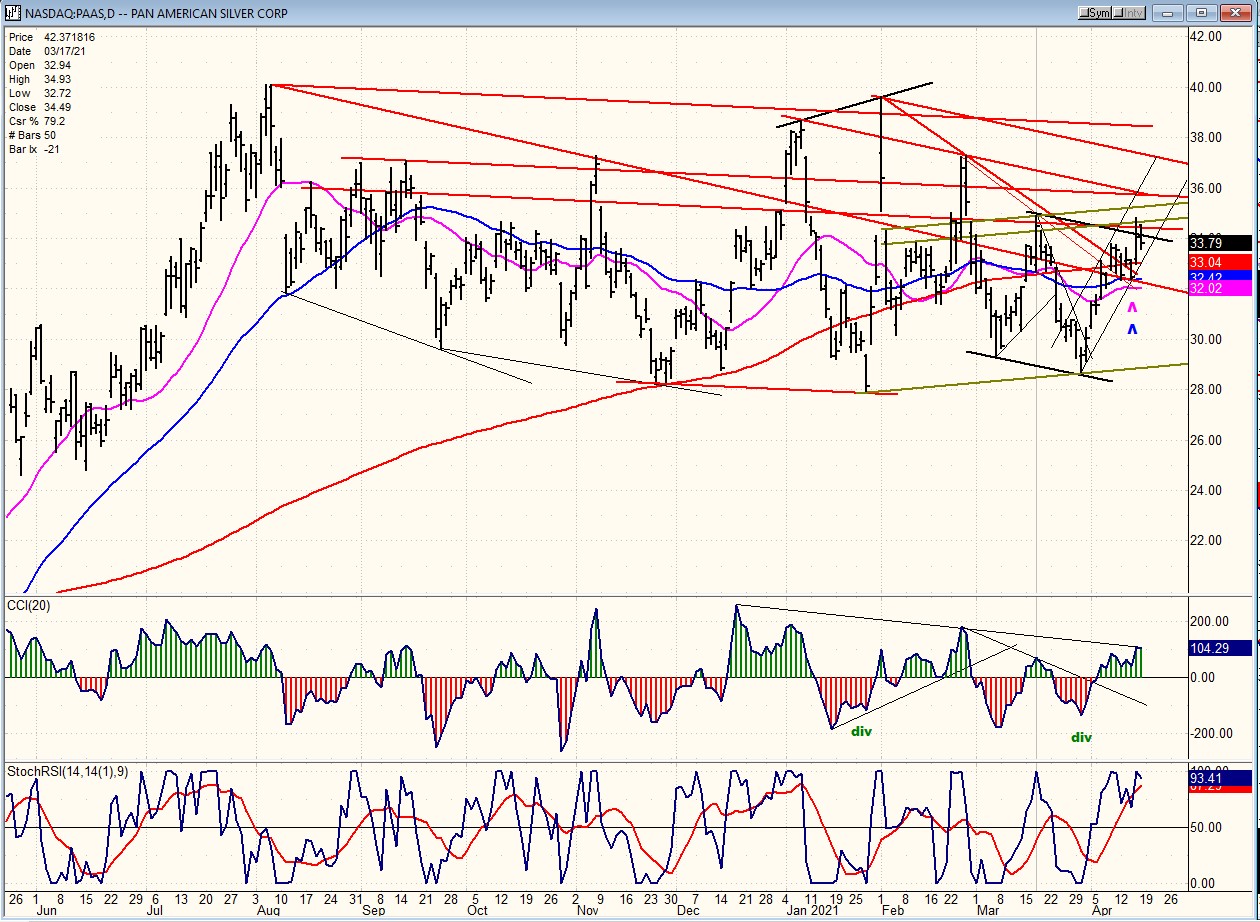
PAAS (Pan American Silver Corp-DLY)
The short-term structure of PAAS is somewhat different than that of GDX, but they still move in tandem -- suggesting that it, too, will need a little consolidation before the next advance.
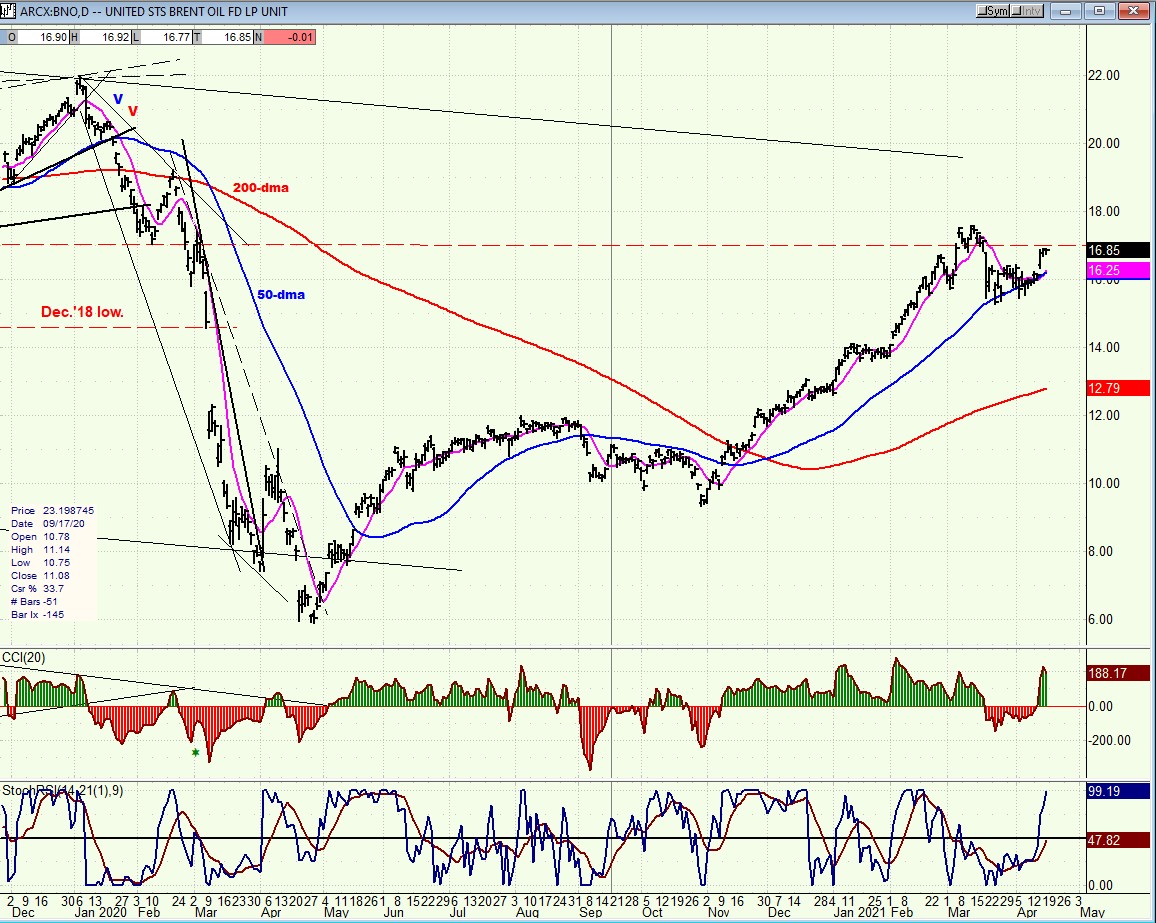
BNO (Brent oil fund) DLY.
BNO is undergoing a consolidation which may not be complete; it could move a little higher before continuing its pause.
SUMMARY
SPX probably completed its second bullish phase on Friday for the reasons stated above. Evidence of this should become manifest next week.
Free trial subscription
With a trial subscription, you will have access to the same information that is given to paid subscribers, but for a limited time-period. Over the years, I have developed an expertise in P&F charting (price projection), cycles (timing), EWT (structure), and general technical analysis which enables me to warn subscribers of pending reversals in market trends and how far that trend can potentially carry. For a FREE 2-week trial, subscription options and payment plans, I encourage you to visit my website at www.marketurningpoints.com.
The above comments and those made in the daily updates and the Market Summary about the financial markets are based purely on what I consider to be sound technical analysis principles. They represent my own opinion and are not meant to be construed as trading or investment advice but are offered as an analytical point of view which might be of interest to those who follow stock market cycles and technical analysis.
*********

When Andre Gratian was a stock broker years ago, a friend introduced him to technical analysis of the market. Consequently, it is not an exaggeration to say that Andre fell in love with this approach! Ever since then, it has become an increasingly important part of his professional life. Gratian has studied the works of Wyckoff, Edwards & Magee, Edward J. Dewey (cycles) and many others. However, one of my most profitable undertaking has probably been to study Point & Figure charting, which he finds invaluable in analyzing stocks and indices. If he were restricted to one methodology, this is the one that he would choose. This well-rounded background has given him what he feels to be a special insight into the stock market, facilitating the recognition of meaningful patterns and the ‘turning points’ in all trends, whether they be short or long term. Andre feels very comfortable discussing the stock market and passing on meaningful information to others. His subscribers include individuals and money managers throughout the world. Moreover, his Newsletters are currently published on several financial sites, here and abroad.
More from Gold-Eagle


