Technical Analysis Of The Markets


Current Position of the Market
SPX Long-term trend: There is some evidence that we are still in the bull market which started in 2009 and which could continue into the first half of 2021 before major cycles take over and it comes to an end.
SPX Intermediate trend: SPX has completed the next phase of its intermediate uptrend and should correct.
Analysis of the short-term trend is done daily with the help of hourly charts. They are important adjuncts to the analysis of daily and weekly charts which determine longer market trends.
SPX Short-term Correction
Cycles: Looking ahead!
90-yr cycle – Last lows: 1843-1933. Next low: ~2023
40-yr cycle -- Last lows: 1942 -1982. Next low: ~2022
7-yr cycle – Last lows: 2009-2016. Next low: ~2023
Market Analysis (Charts, courtesy of QCharts)
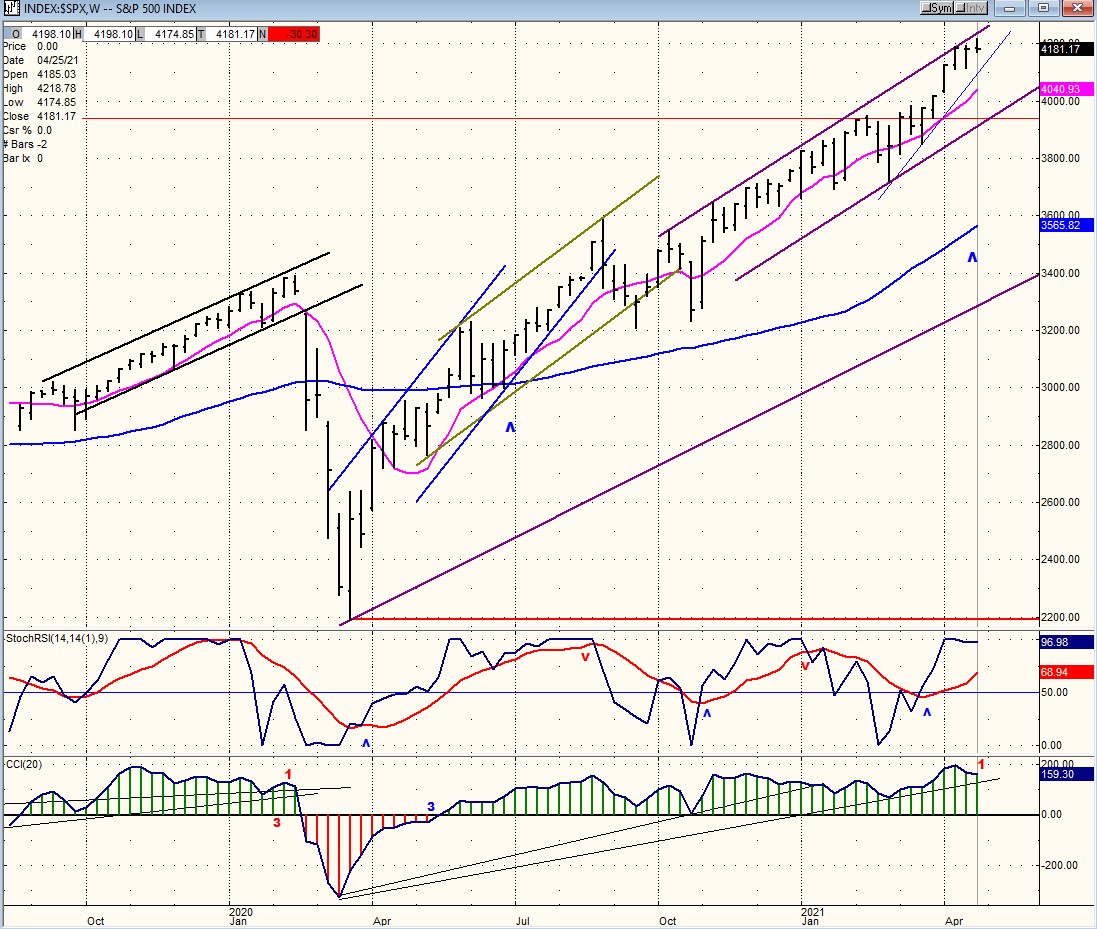
SPX (weekly)
The intermediate trend, as defined by the weekly SPX chart is still up and weeks away of giving a sell signal. This is verifiable with the chart pattern itself, which is still in an obvious uptrend, although apparently overbought since the index is trading at the top of the intermediate channel which started in October 2020. It is also apparent that the oscillators at the bottom of the chart are still in a buy mode, although the slightest warning is appearing that we may be coming to the end of this intermediate trend in a few more weeks. And finally, the P&F base pattern is projecting higher levels for the index ranging from 200 to 300 points higher before we should be concerned with an important correction.
The short-term trend, as we will see next, is not so bullish and it is warning of an impending downtrend.
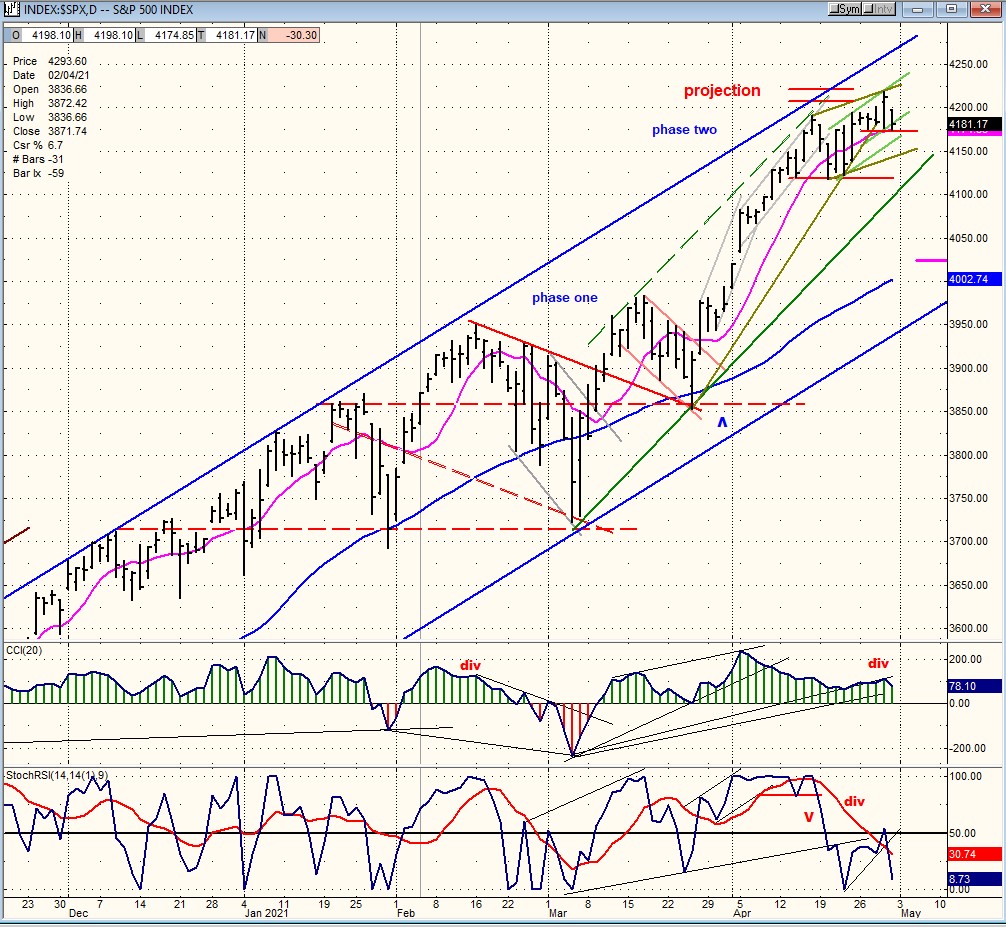
SPX daily chart
The daily chart shows that we have come to the end of phase two for the move which started from 3723 in March, and that we are ready for a short-term correction before the start of phase three of this move. The upside P&F price projection has been reached and the short-term trend line of phase two was broken in the last couple of days. The oscillators are also turning bearish. The CCI which had been flashing negative divergence for the past few days (something which happens in the last stages of a trend) turned down on Friday. The SRSI, which is the early bird, went negative ten days ago, and just marked time as the index was completing its 4210-20 P&F projection. SPX made a high of 4218.78 on Thursday before turning down.
The downside projection for the correction is estimated to be a 50% retracement of phase two, or ~4035. The top P&F count will not be available until we drop below the second horizontal red line. After this is accomplished, we can take an accurate count and see if it confirms the Fibonacci retracement.
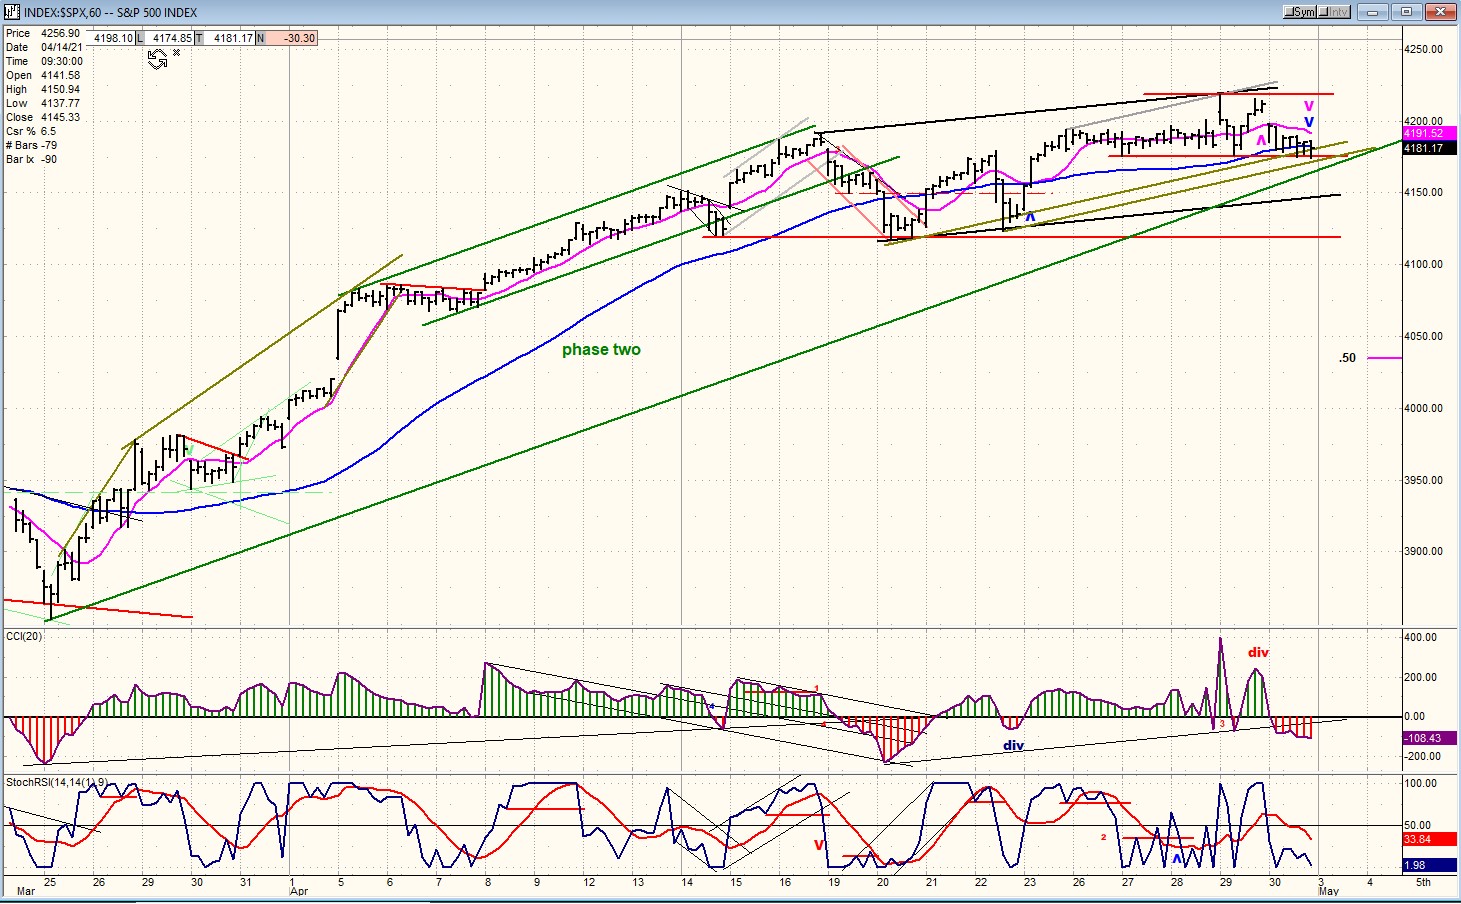
SPX hourly chart
We can see better the deceleration process which was taking place on the hourly chart; from a sharp uptrend off the 3853 level where phase two started, to a gradual rounding over of the price progression, and the nearly flat appearance of the past five days! Starting on Wednesday, attempts at pushing the price higher were defeated with the SRSI remaining mostly negative and the CCI trying to remain positive. But on Friday, the CCI went negative and stayed in the red for the rest of the day. This strongly suggests that selling pressure is building up and I would expect that the decline will probably begin on Monday.
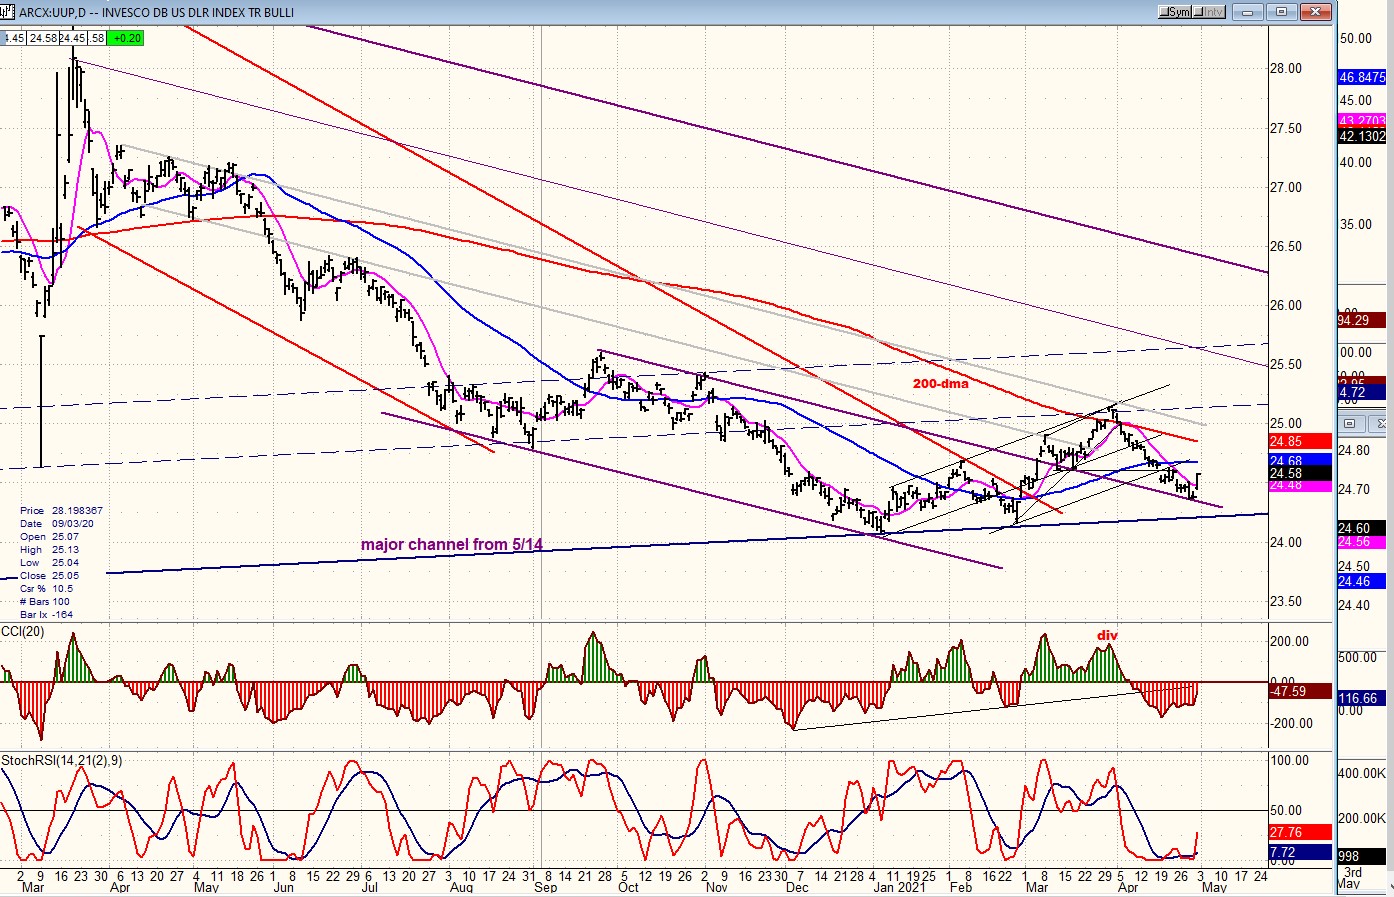
UUP (dollar ETF) DLY ($USD chart is not available from this data provider)
UUP found support on the top line of the lower channel and bounced, with the oscillators giving a preliminary buy signal. Let’s see how much of an uptrend it can muster. The dollar, which is currently at 92, might have enough of a base count to get to 94.
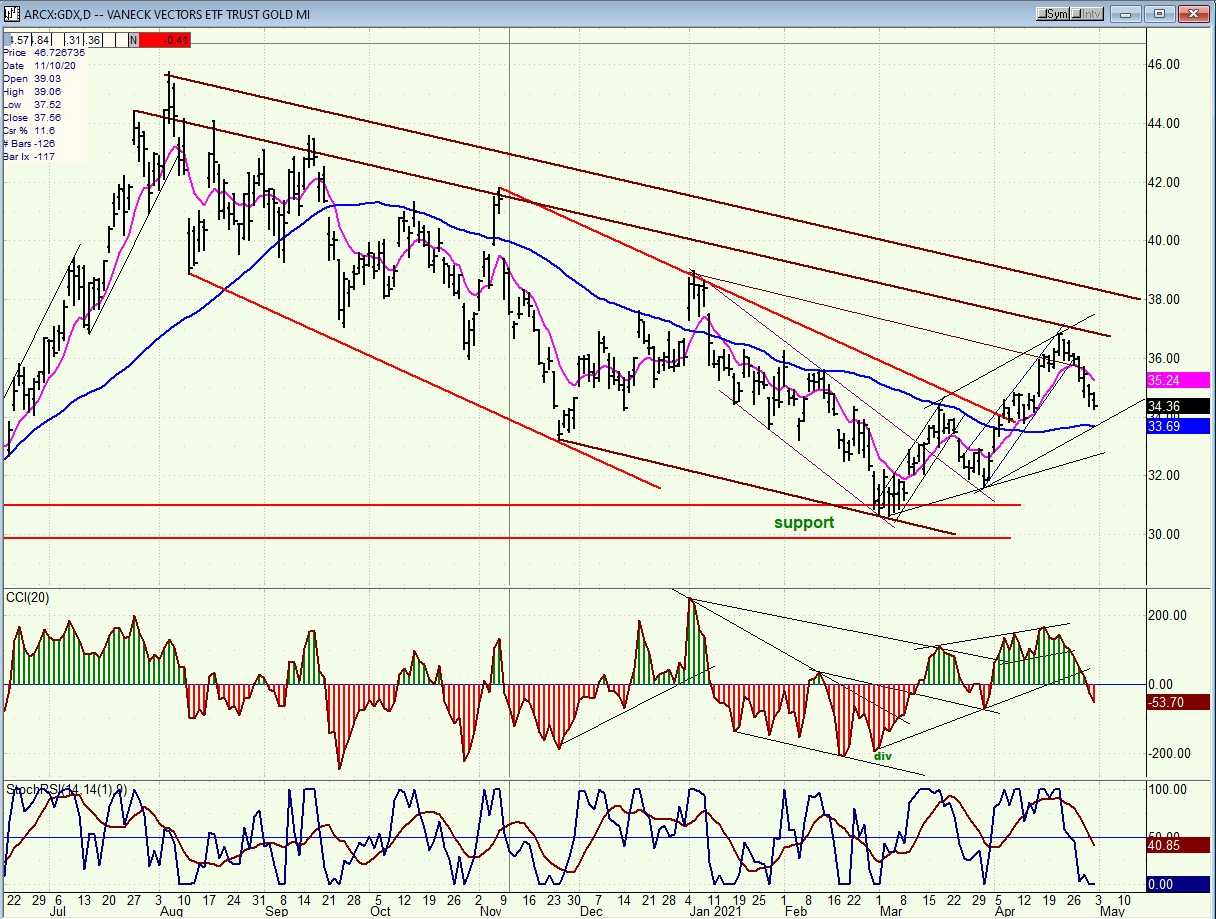
GDX (gold miners)-DLY
GDX has given a sell signal and is correcting. It has already overlapped its March peak, which is a sign of weakness suggesting that it is not making an impulse wave from its correction low of 31. Also, it has not broken out of its corrective channel. So, should we assume that it has to do so some additional basing before it can resume its uptrend?
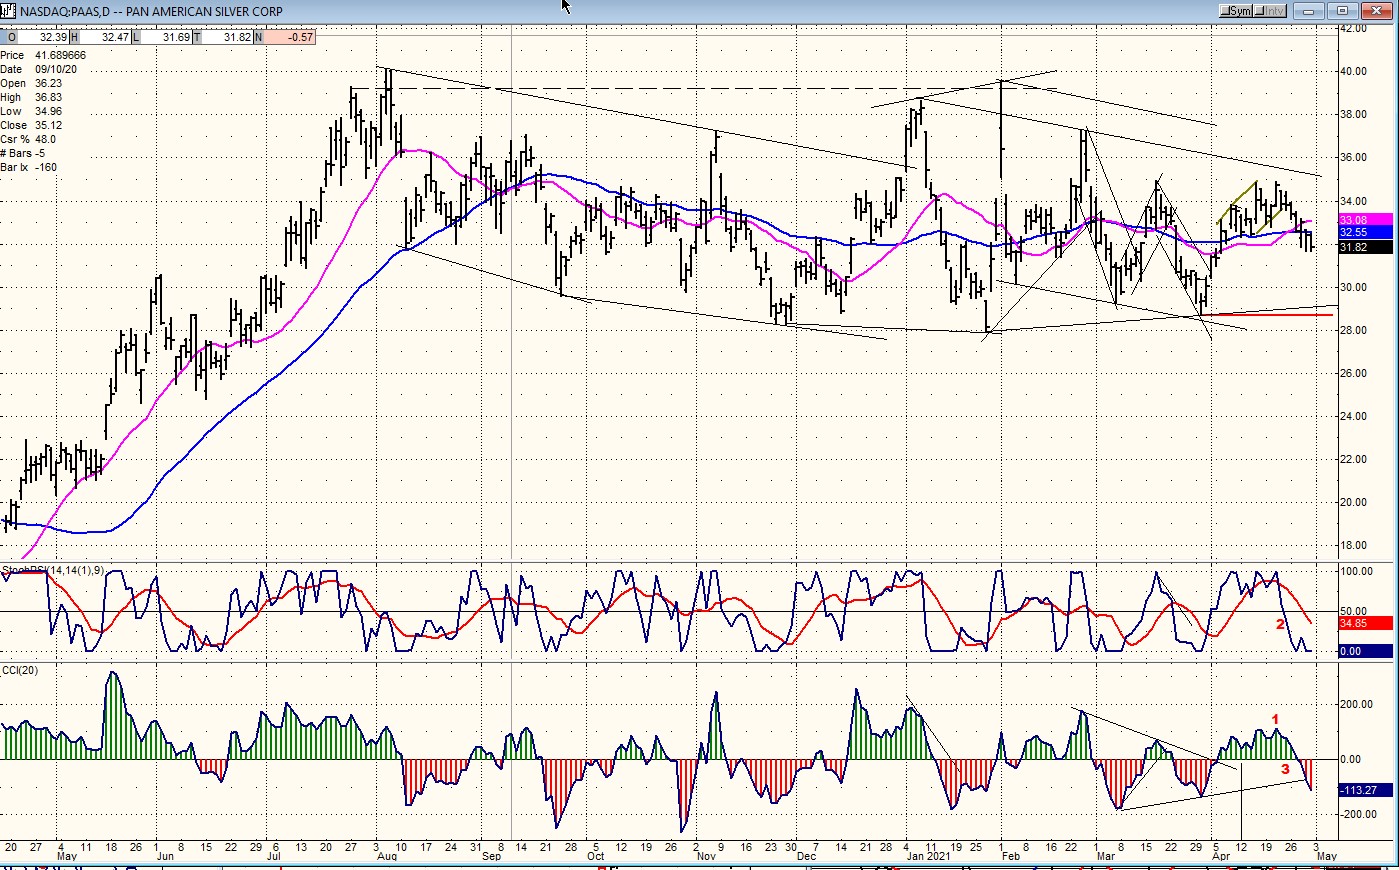
PAAS (Pan American Silver Corp-DLY)
Over the short-term, PAAS looks even weaker. Although it did not show as much weakness as gold during its intermediate correction, it was not even able to surpass its former short-term peak on its last minor uptrend. This is not a sign of strength! Like GDX, it has a strong base, and the correction has made what appears to be a good consolidation pattern, but until it can make a decisive move above 35 it may continue to trade in a sideways pattern. Short-term, like GDX it has given a sell signal, and since it tends to move with the market, it may have to wait until SPX has completed its correction before it can make another attempt at moving up. In the meantime, a retest of the low is a good possibility.
BNO (Brent oil fund) DLY.
BNO is retesting its recent high supported by its 50-dma. As long as it remains above it, it can continue to move up, but the oscillators are telling us that the MA may soon be challenged again.

SUMMARY
SPX is showing signs of having completed the second advance (phase two) from 3723. Unless buyers immediately return to prop up the price, the index is likely to start a short-term correction.
Free trial subscription
With a trial subscription, you will have access to the same information that is given to paid subscribers, but for a limited time-period. Over the years, I have developed an expertise in P&F charting (price projection), cycles (timing), EWT (structure), and general technical analysis which enables me to warn subscribers of pending reversals in market trends, and how far that trend can potentially carry. For a FREE 2-week trial, subscription options, and payment plans I encourage you to visit my website at www.marketurningpoints.com.
The above comments and those made in the daily updates and the Market Summary about the financial markets are based purely on what I consider to be sound technical analysis principles. They represent my own opinion and are not meant to be construed as trading or investment advice but are offered as an analytical point of view which might be of interest to those who follow stock market cycles and technical analysis.
*********

When Andre Gratian was a stock broker years ago, a friend introduced him to technical analysis of the market. Consequently, it is not an exaggeration to say that Andre fell in love with this approach! Ever since then, it has become an increasingly important part of his professional life. Gratian has studied the works of Wyckoff, Edwards & Magee, Edward J. Dewey (cycles) and many others. However, one of my most profitable undertaking has probably been to study Point & Figure charting, which he finds invaluable in analyzing stocks and indices. If he were restricted to one methodology, this is the one that he would choose. This well-rounded background has given him what he feels to be a special insight into the stock market, facilitating the recognition of meaningful patterns and the ‘turning points’ in all trends, whether they be short or long term. Andre feels very comfortable discussing the stock market and passing on meaningful information to others. His subscribers include individuals and money managers throughout the world. Moreover, his Newsletters are currently published on several financial sites, here and abroad.


