Technical Analysis Of The Markets


SPX Long-term trend: There is some evidence that we are still in the bull market which started in 2009 and which could continue into the first half of 2021 before major cycles take over and it ends. A move past 4500 is possible before the current bull market makes a final top and SPX corrects into its next major cycle low due in 2023.
SPX Intermediate trend: Phase three (wave 5 rom 3723) is now likely underway.
Analysis of the short-term trend is done daily with the help of hourly charts. They are important adjuncts to the analysis of daily and weekly charts which determine longer market trends.
Is the Correction Complete?
Cycles: Looking ahead!
7-yr cycle – Last lows: 2009-2016. Next low: ~2023
Market Analysis (Charts, courtesy of QCharts)
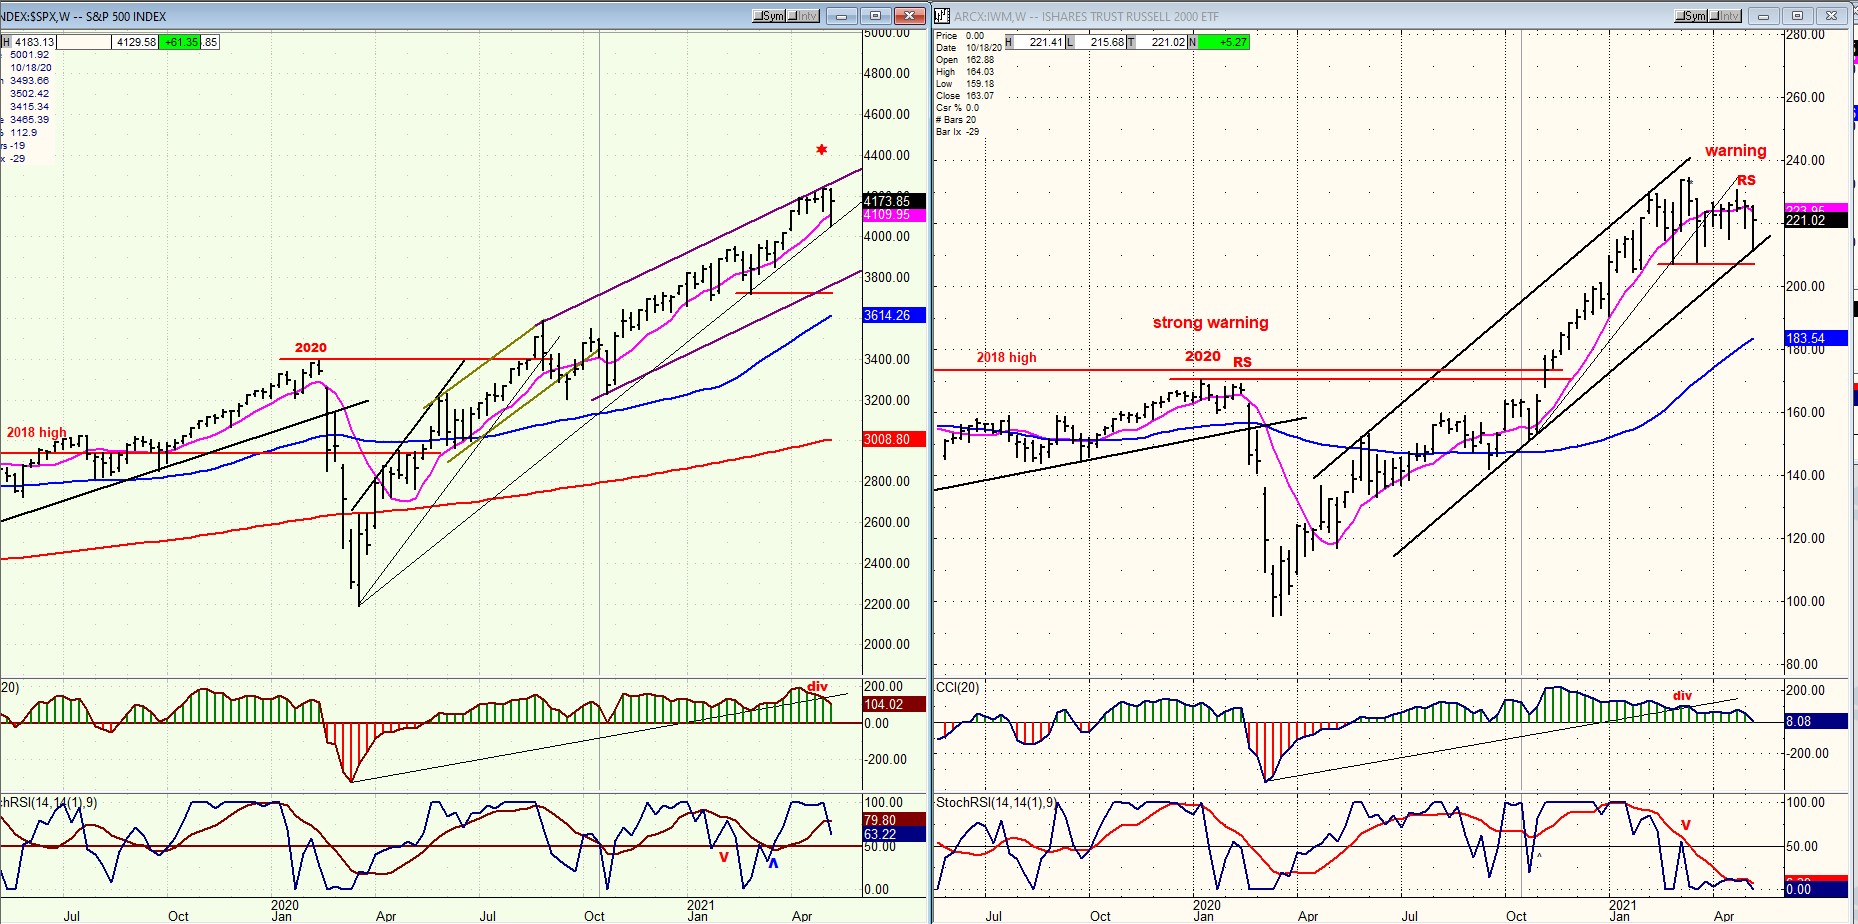
IWM - SPX (weekly)
Last week’s market action has done nothing to eliminate the relative weakness displayed by IWM. This is probably because IWM likely completed its intermediate wave 3 from the March 2020 low ahead of SPX and is waiting for the latter to put an end to its comparable structure before they can correct into wave 4 together.
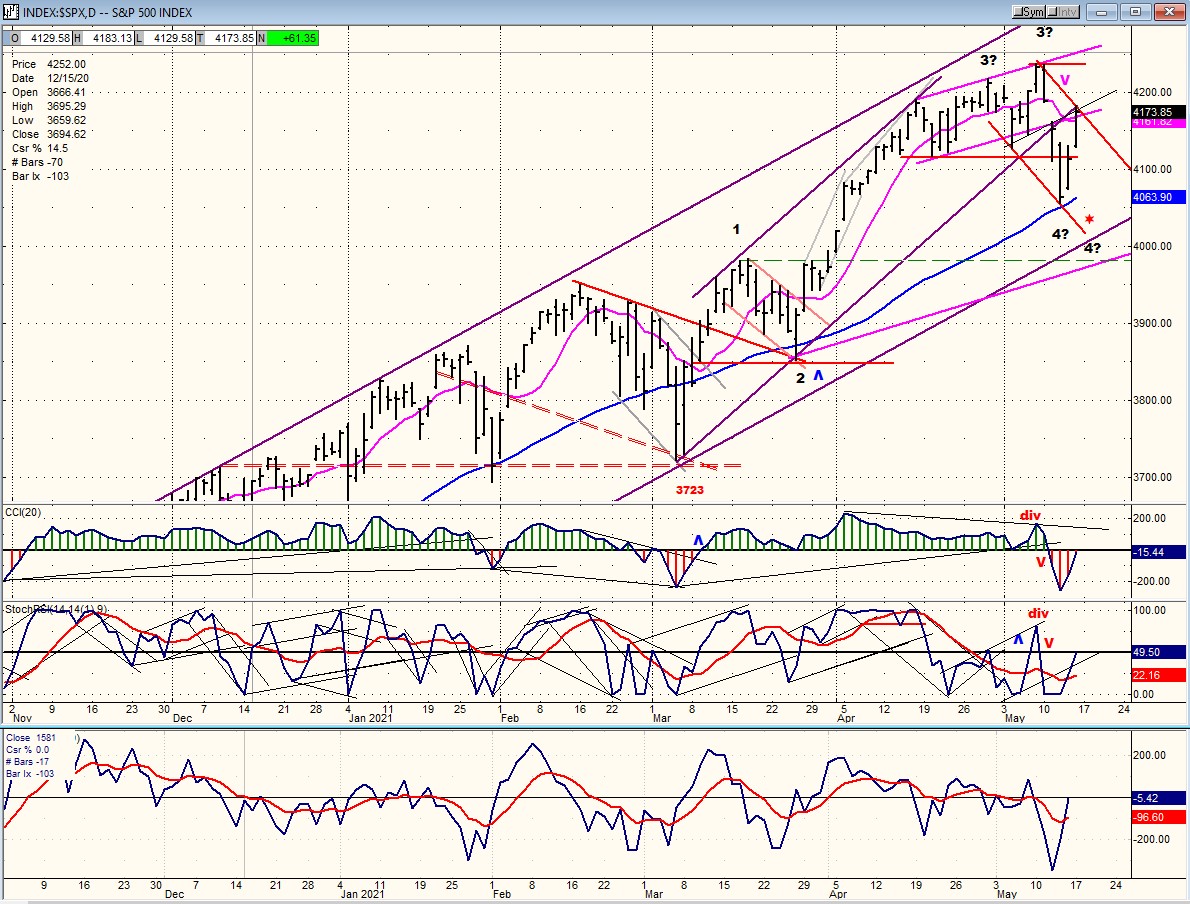
SPX daily chart
Last week’s letter was entitled “Extending Phase 2?”. That was quickly resolved last Monday when SPX started on wave 4 of the move from 3723, but this week, we have another dilemma! Are we done, with wave 4 correction finding support slightly above its 50-dma at 4055, or is there a little more to it? That will depend on how much of a pullback from Friday’s close at 4180 can be mustered by a final drop into a short-term cycle low due in the Monday-Wednesday window.
The P&F distribution which took place at the wave 3 top gave us two possible targets for the low of wave 4: either ~4055-4065, or ~3990. With SPX finding support on its 50-dma at 4056.87 and then rallying to 4180 by Friday’s close, it would seem that wave 4 is already complete. In which case, the rally to 4180 is already the start of the next short-term uptrend as wave 5 of the rally which started from 3723, and which has a determined objective of ~4330-4390 already established by the next-to-last phase of accumulation established at the March 2020 low.
After the completion of wave 3, we were also looking for a 50% pull-back of wave 2, which would have taken the index down to about 4045. Again, Wednesday’s low, although it did not exactly meet that requirement, was well within the ballpark to satisfy it. But to be more certain that wave 4 is finished, we should wait until the short-term cycle has made its low early next week and see if Wednesday’s low holds.
With Friday’s rally, all three oscillators turned up sharply from oversold positions, but all stopped just short of pushing into the green, which is another reason for waiting a couple more days to verify that the correction is over.
Everything considered, the odds favor that wave 4 is complete and that the pullback from the bottoming short-term cycle will only bring about a retest of the low.
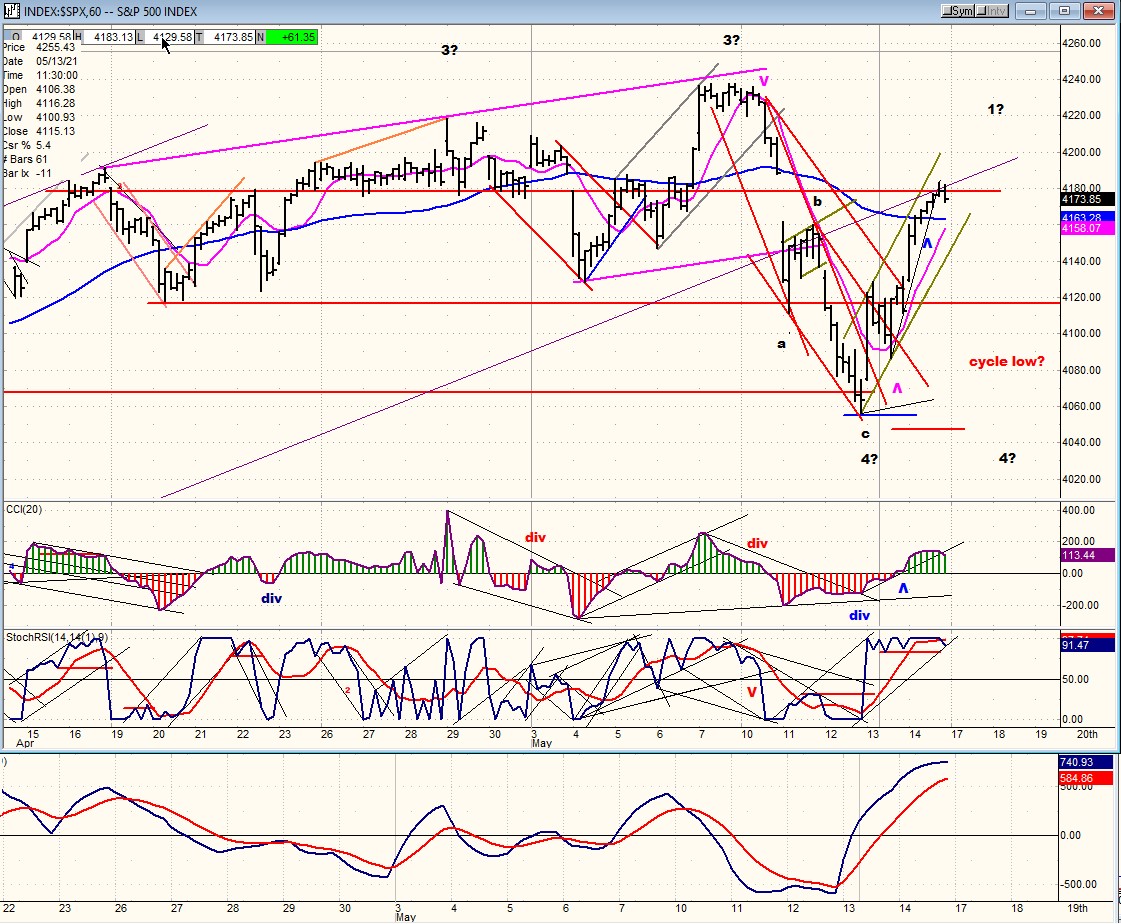
SPX hourly chart
The hourly chart provides a more detailed view of the structure formed by SPX. Wave 3 is in the past and we must now focus on whether wave 4 has really made its low. Two factors point to it! First, the size of the rally from the low which retraced a full 70% of its decline (and may not be complete) and second, the strength exhibited by the A/D oscillator which was impressive and suggests strong buying.
The index rallied all the way to its broken channel line (best seen on the daily chart) and the higher resistance band, where it finally paused after rallying above its 50-hr MA -- which is another sign of strength.
All this points to the probability that the correction ended at Wednesday’s low and that the beginning of the 5th wave has already started. Although the top of wave 5 is already estimated to be in the mid-4300’s, let’s wait for a little more congestion to form on the chart for a final confirmation.
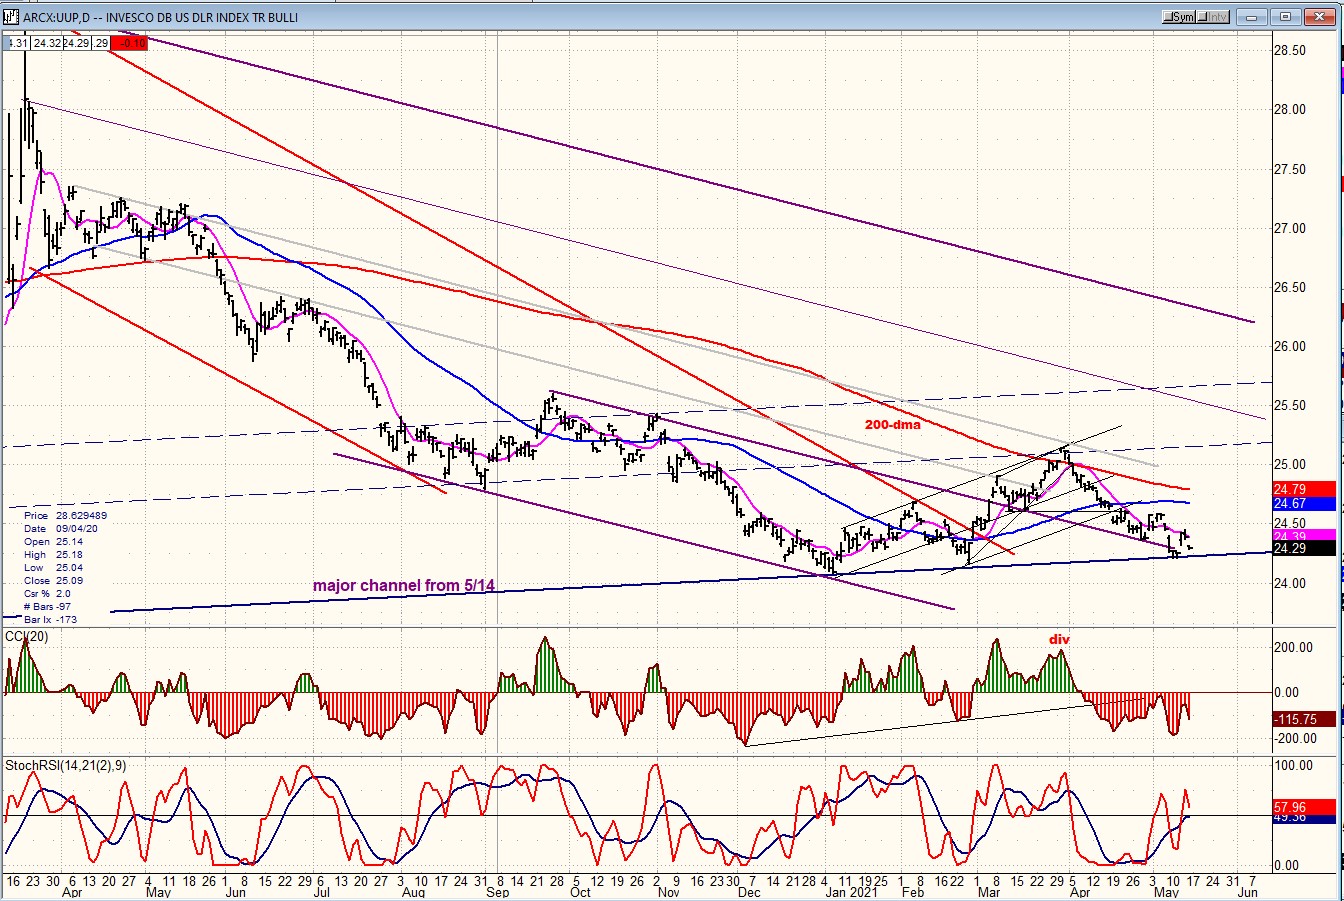
UUP (dollar ETF) DLY ($USD chart is not available from this data provider)
UUP is holding at a major channel line, but weakness is evident by the fact that it is not able to rebound after touching it. Nevertheless, until it makes a new low it is possible that it will continue to build a base in this area.
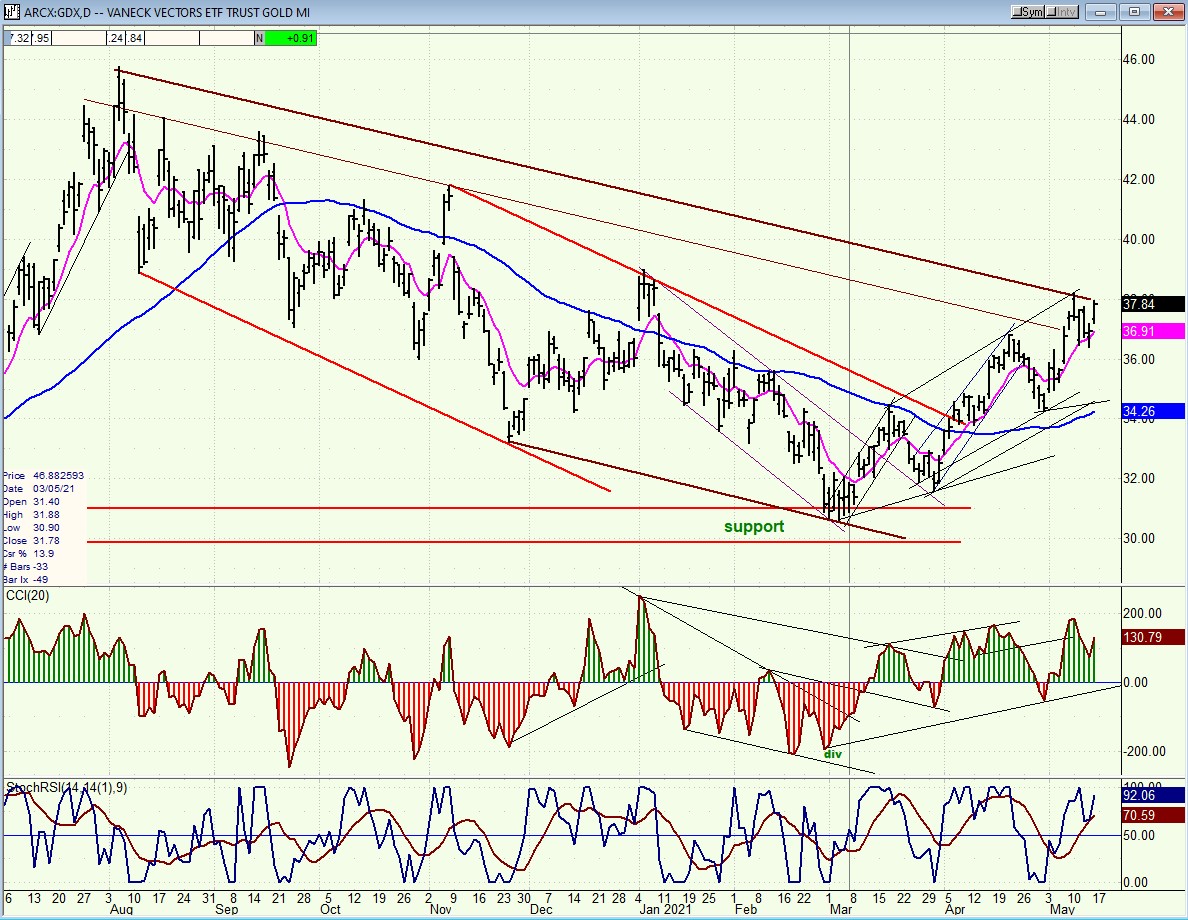
GDX (gold miners)-DLY
GDX continues to act well. After completing an intermediate correction just above 30, it has rallied past 37 where it reached the top of its intermediate channel. This a critical area which could determine how long it needs to consolidate at this level before moving higher to challenge the former high of 45+. A little consolidation before pushing through the channel line would be normal. On the other hand, it may decide to push to 40-41, before consolidating.
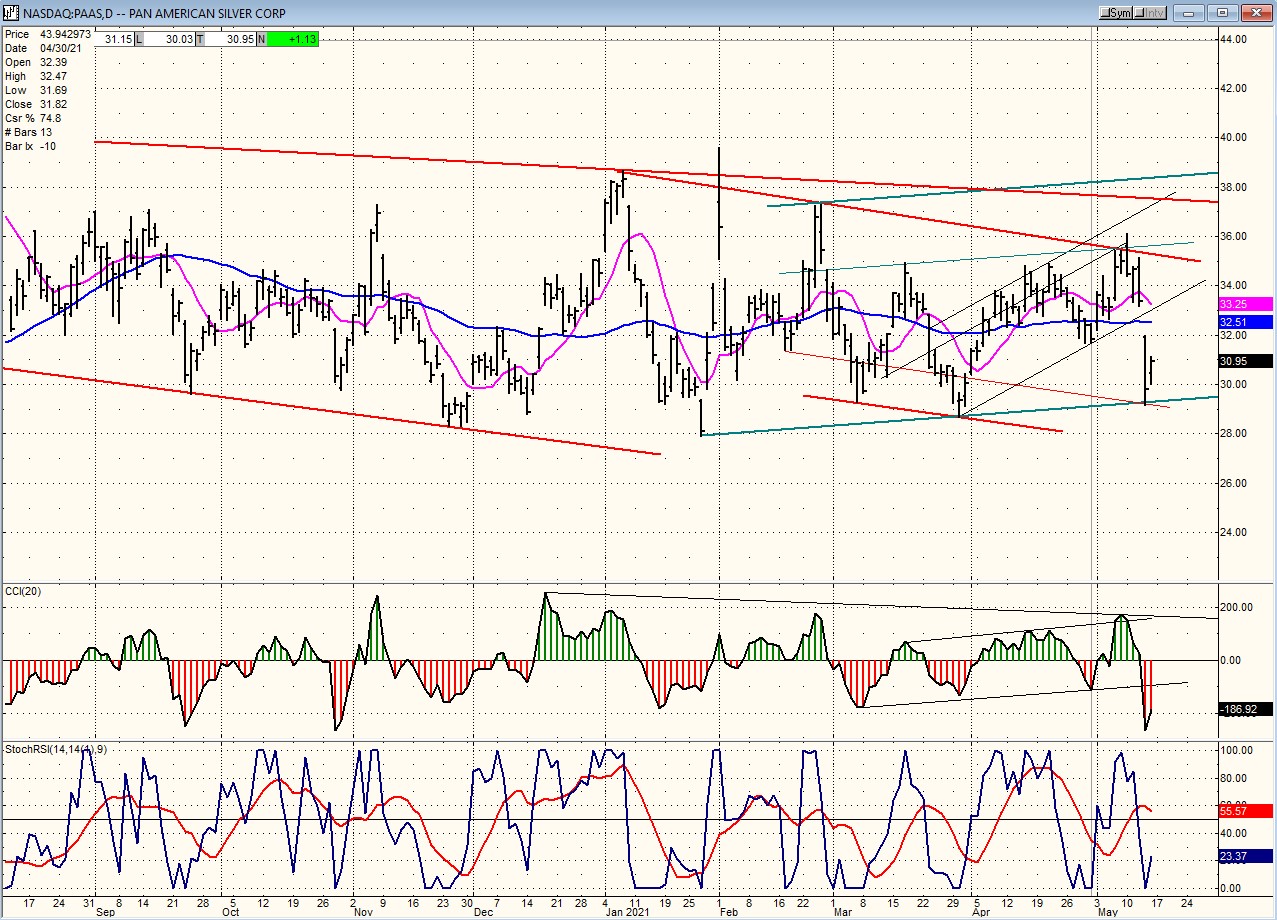
PAAS (Pan American Silver Corp-DLY)
PAAS failed to meet its estimated quarterly earnings and the stock was pushed back down to the bottom of its base. If it can hold this level, this will prove to be only a temporary set-back from which it can build another base for a move higher. Continued strength in silver should be beneficial since no real damage has been done to the chart pattern.
BNO (Brent oil fund) DLY.
BNO has rallied slightly past its previous short-term top but must extend quickly if it wants to move higher. The current oscillator pattern is not constructive but could be easily remedied. On the other hand, a drop below the 50-dma would prolong the consolidation at this level.

SUMMARY
From its 3723 low, SPX started an uptrend which appears to have now completed a 4th wave correction and to have started on the last phase of this uptrend. A pull-back resulting from a short-term cycle low due early next week is likely before it extends its move above 4300.
Free trial subscription
With a trial subscription, you will have access to the same information that is given to paid subscribers, but for a limited time-period. Over the years, I have developed an expertise in P&F charting (price projection), cycles (timing), EWT (structure), and general technical analysis which enables me to warn subscribers of pending reversals in market trends, and how far that trend can potentially carry. For a FREE 2-week trial, subscription options, and payment plans I encourage you to visit my website at www.marketurningpoints.com.
The above comments and those made in the daily updates and the Market Summary about the financial markets are based purely on what I consider to be sound technical analysis principles. They represent my own opinion and are not meant to be construed as trading or investment advice but are offered as an analytical point of view which might be of interest to those who follow stock market cycles and technical analysis.
*********

When Andre Gratian was a stock broker years ago, a friend introduced him to technical analysis of the market. Consequently, it is not an exaggeration to say that Andre fell in love with this approach! Ever since then, it has become an increasingly important part of his professional life. Gratian has studied the works of Wyckoff, Edwards & Magee, Edward J. Dewey (cycles) and many others. However, one of my most profitable undertaking has probably been to study Point & Figure charting, which he finds invaluable in analyzing stocks and indices. If he were restricted to one methodology, this is the one that he would choose. This well-rounded background has given him what he feels to be a special insight into the stock market, facilitating the recognition of meaningful patterns and the ‘turning points’ in all trends, whether they be short or long term. Andre feels very comfortable discussing the stock market and passing on meaningful information to others. His subscribers include individuals and money managers throughout the world. Moreover, his Newsletters are currently published on several financial sites, here and abroad.


