Technical Analysis Of The Markets


Current Position of the Market
SPX Long-term trend: There is some evidence that we are still in the bull market which started in 2009 and which could continue into 2021 before major cycles take over and it ends. A move up to ~4500 is possible before the current bull market makes a final top and SPX corrects into its next major cycle low due in 2023.
SPX Intermediate trend: SPX is approaching its intermediate top projection of ~4310.
Analysis of the short-term trend is done daily with the help of hourly charts. They are important adjuncts to the analysis of daily and weekly charts which determine longer market trends.
4310 Right Around the Corner!
Cycles: Looking ahead!
7-yr cycle – Last lows: 2009-2016. Next low: ~2023
Market Analysis (Charts, courtesy of QCharts)
WEEKLY INDICES:
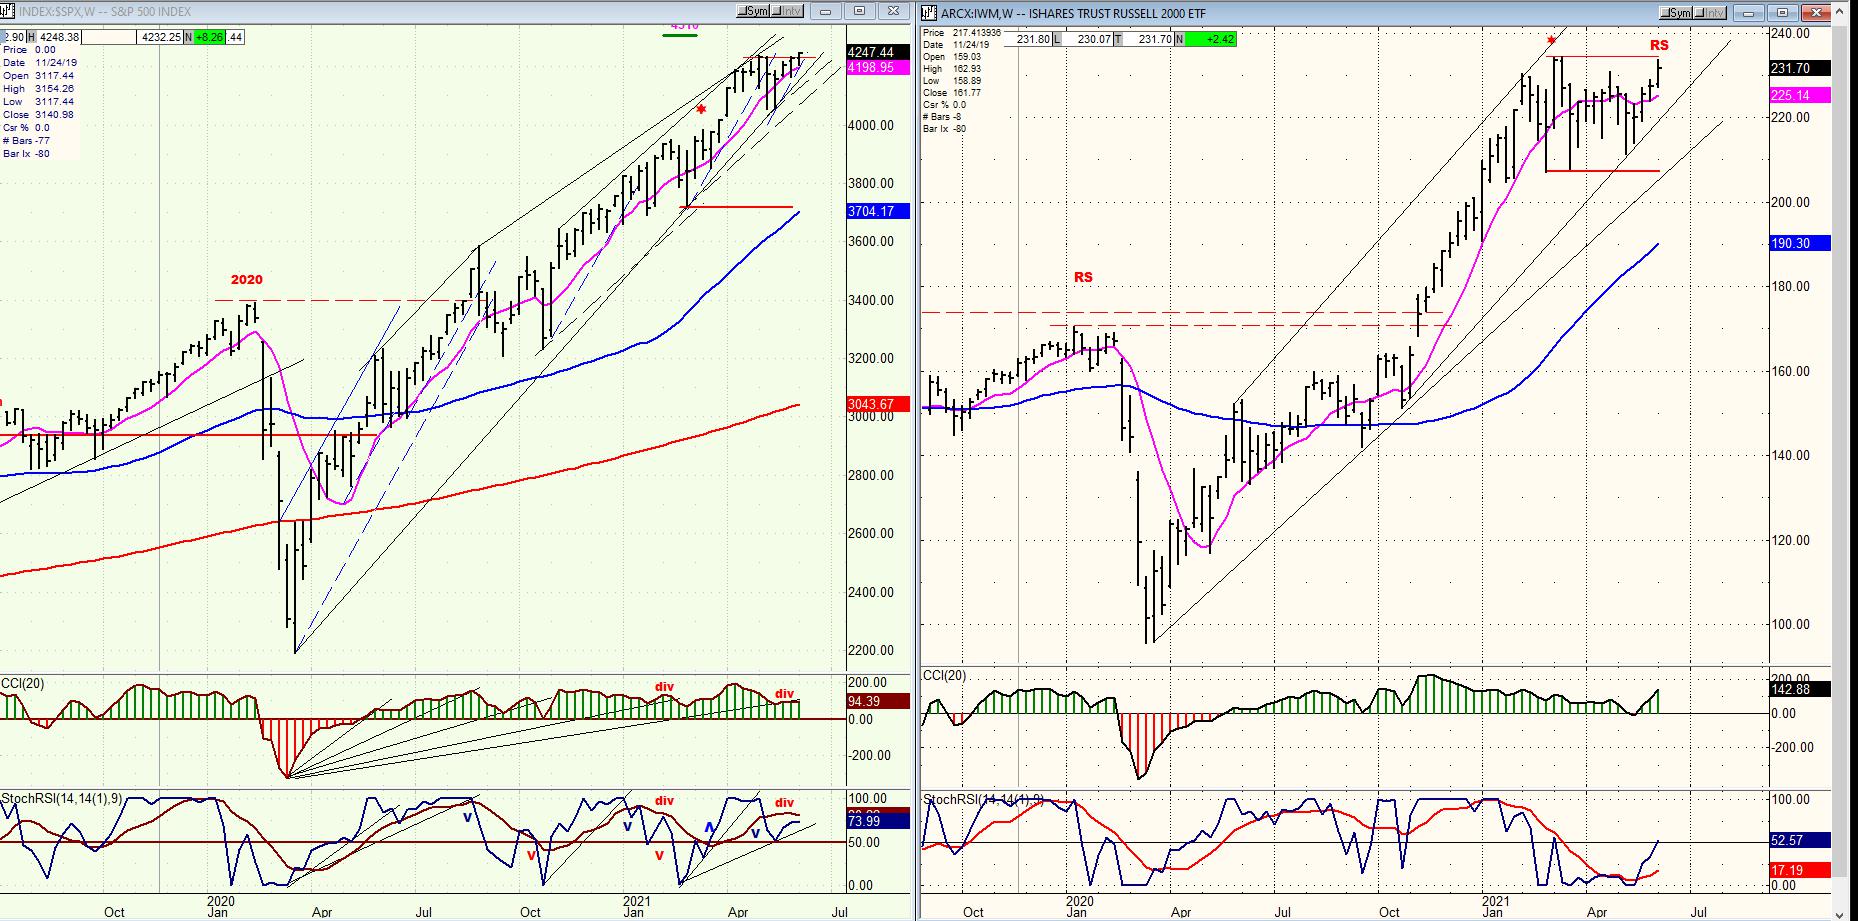
IWM vs. SPX
IWM showed a little more life last week but still trails SPX, especially when compared to the latter’s rise above its March high, from which point it continued to move higher while IWM essentially jogged in place. Consequently, the relative weakness prevails, and the warning of an approaching high remains valid.
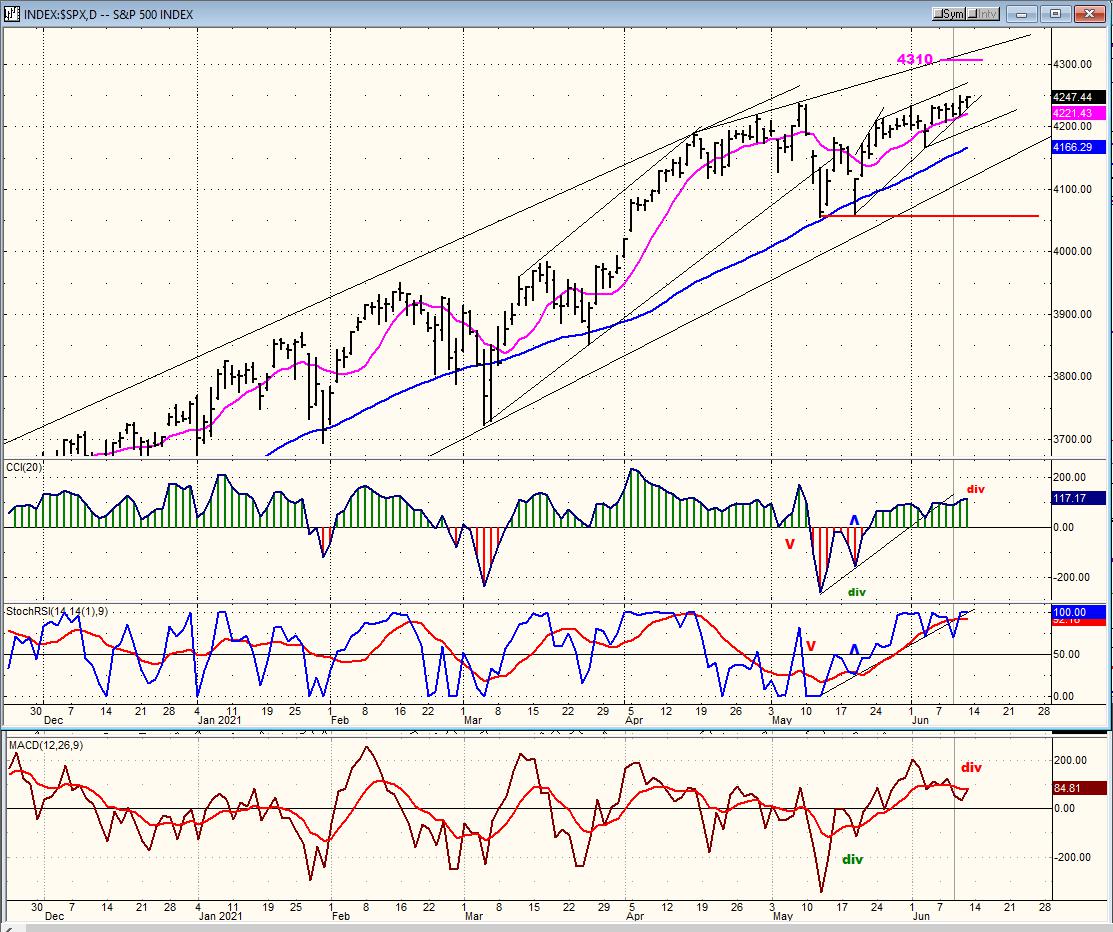
SPX daily chart
The daily SPX finally made a new all-time high last week, the first one since 5/06 – but only by a measly 14 points. I should not have to explain what this means: “A correction is coming! A correction is coming!” -- perhaps over the next 10 days.
If looking at the deceleration in the price index itself is not enough, take a look at CCI! If you go back to the beginning of the page, you see that the green has been punctuated by an occasional red. So long as the green prevails, the index remains in an uptrend. When the oscillator turns red, we are given a sell signal which stays in effect until the CCI becomes green again.
The CCI also gives an advance warning in the form of negative divergence. This is currently (mildly) in effect, so we know that, unless the negative divergence disappears, we should be on our guard for the start of a price decline.
The lowest oscillator is based on the A-Ds. It provides a good confirming signal to the CCI. It too is showing (strong) negative divergence. When all three oscillators go negative, the index should begin its correction.
When should that take place? Not that we really need to be that precise, but we have access to another advance warning system! According to the long-term P&F chart, the index should top near 4310 only 60 points away from where we are today.
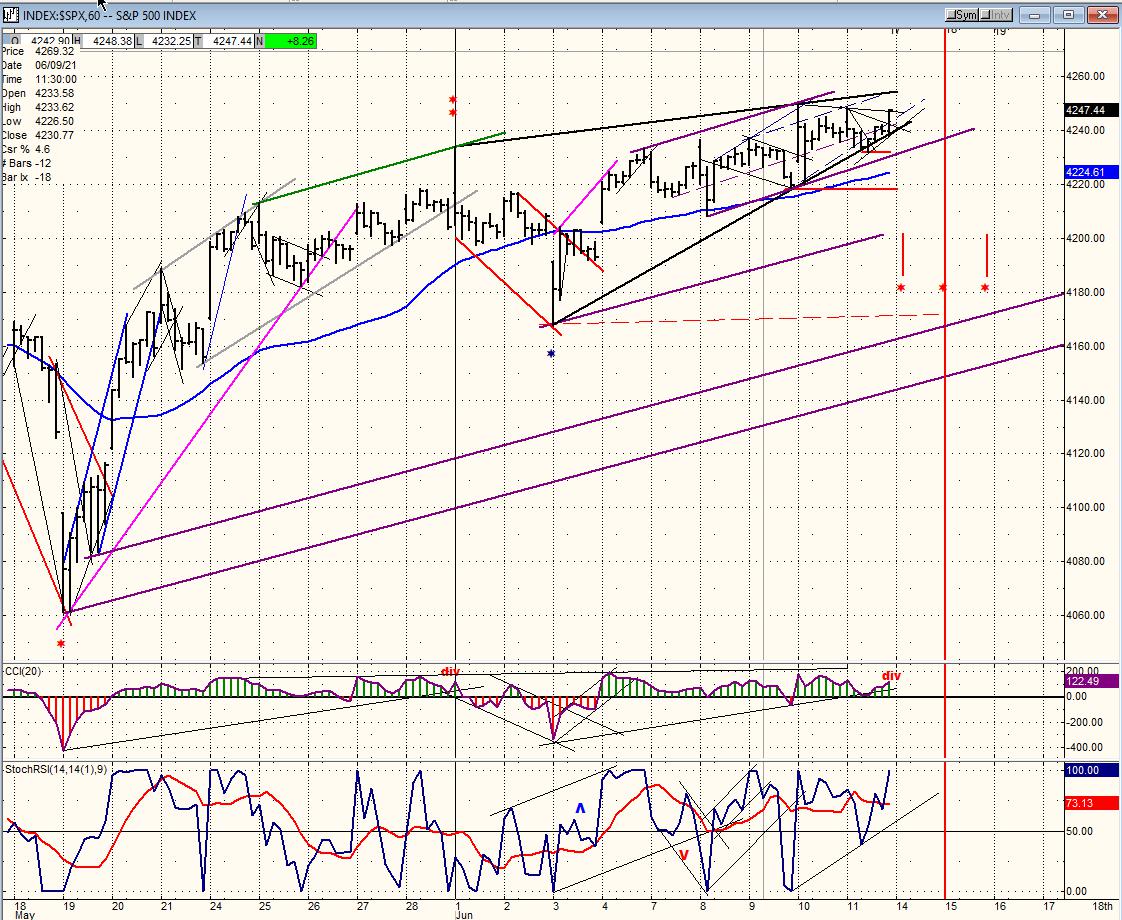
SPX hourly chart
SPX is, to some extent, governed by a short-term cycle which spans about 26 calendar days or about 17-19 trading days (red asterisks). It varies substantially in amplitude, and the current one is a good example of this. We are ostensibly one to three days away from its low, and it has not yet pressured SPX into a short-term downtrend. Since it does not have a history of inverting, I must assume that its low is still ahead of us and will occur early next week. After that low, the index should be ready to make its final high in the designated price range.
Any cycle is influenced by other cycles which can expand or curtail its range. In this case, the minor cycle which bottomed early in the month is probably responsible for the delay in the 18-19 day-cycle making its low, and that means that the final price drop will probably come at the very last minute and all at once.
On Friday, the closing spurt created some negative divergence in the CCI. Probably a final warning.
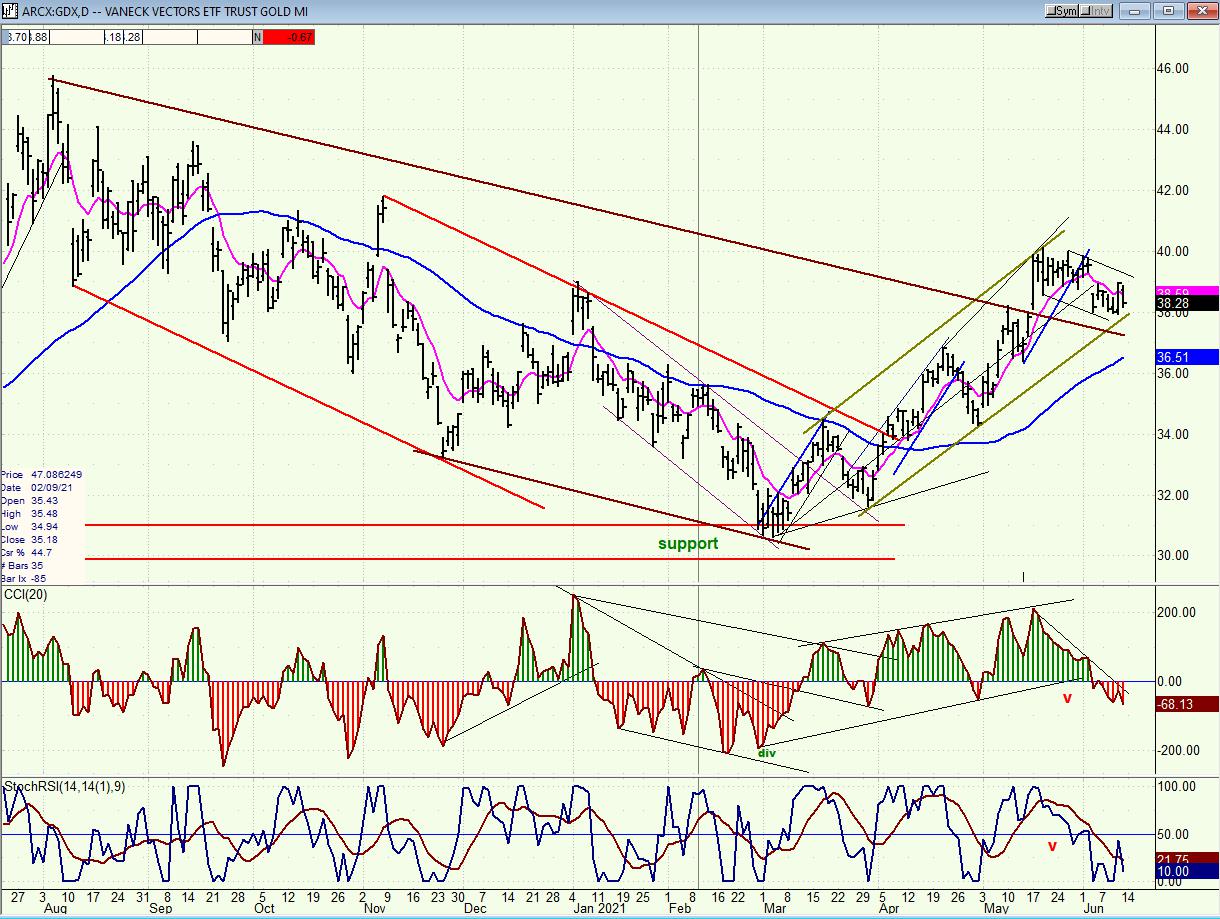
GDX (gold miners)-(dly)
GDX rallied about 10 points before making a small consolidation pattern which looks nearly complete. By next week, the index may be ready to move higher, to 43 and then 47.
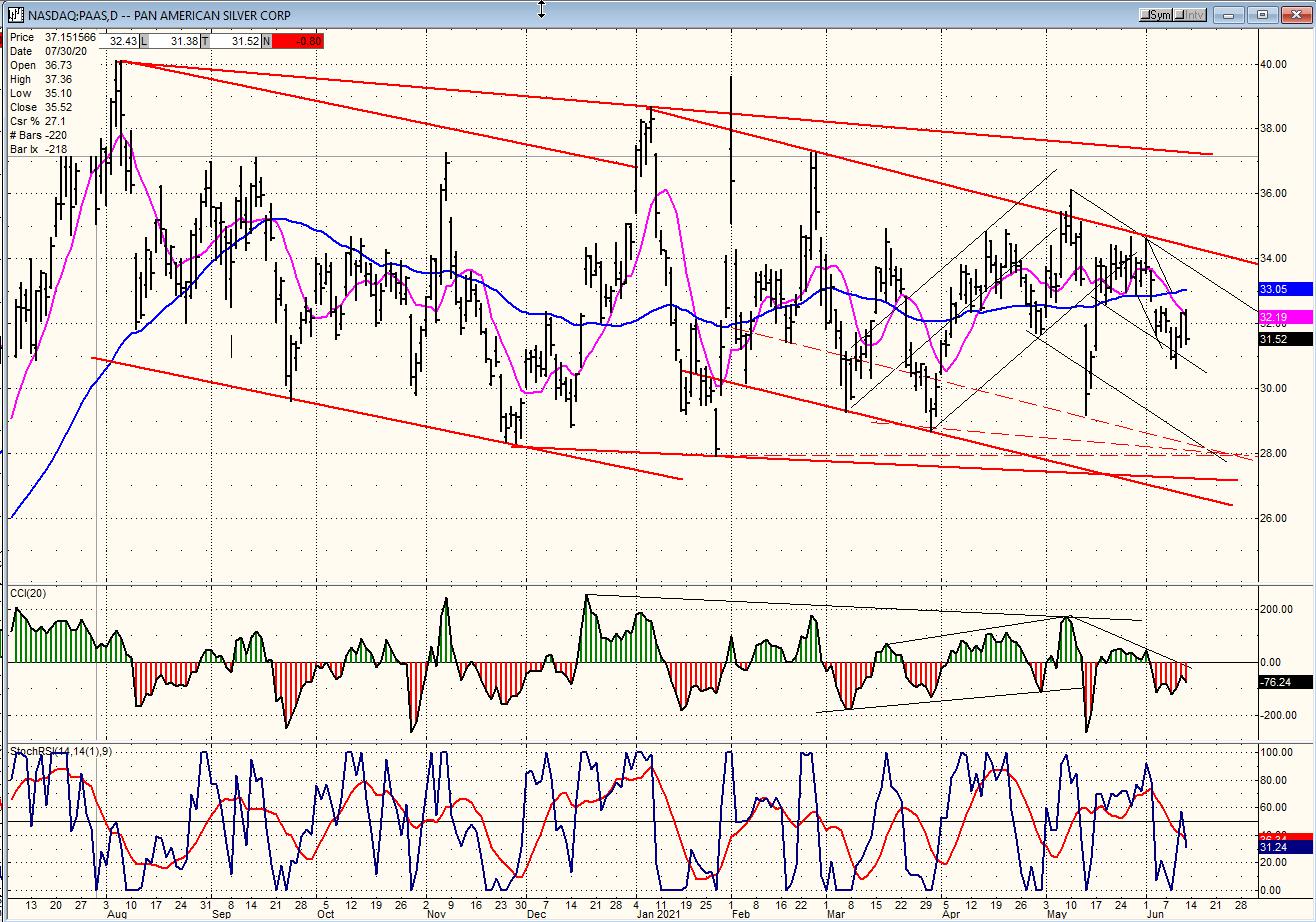
PAAS (Pan American Silver Corp-(dly)
PAAS also consolidated after moving off its low but has not been able to break out of its consolidation pattern. This could change shortly with an initial move to 39.
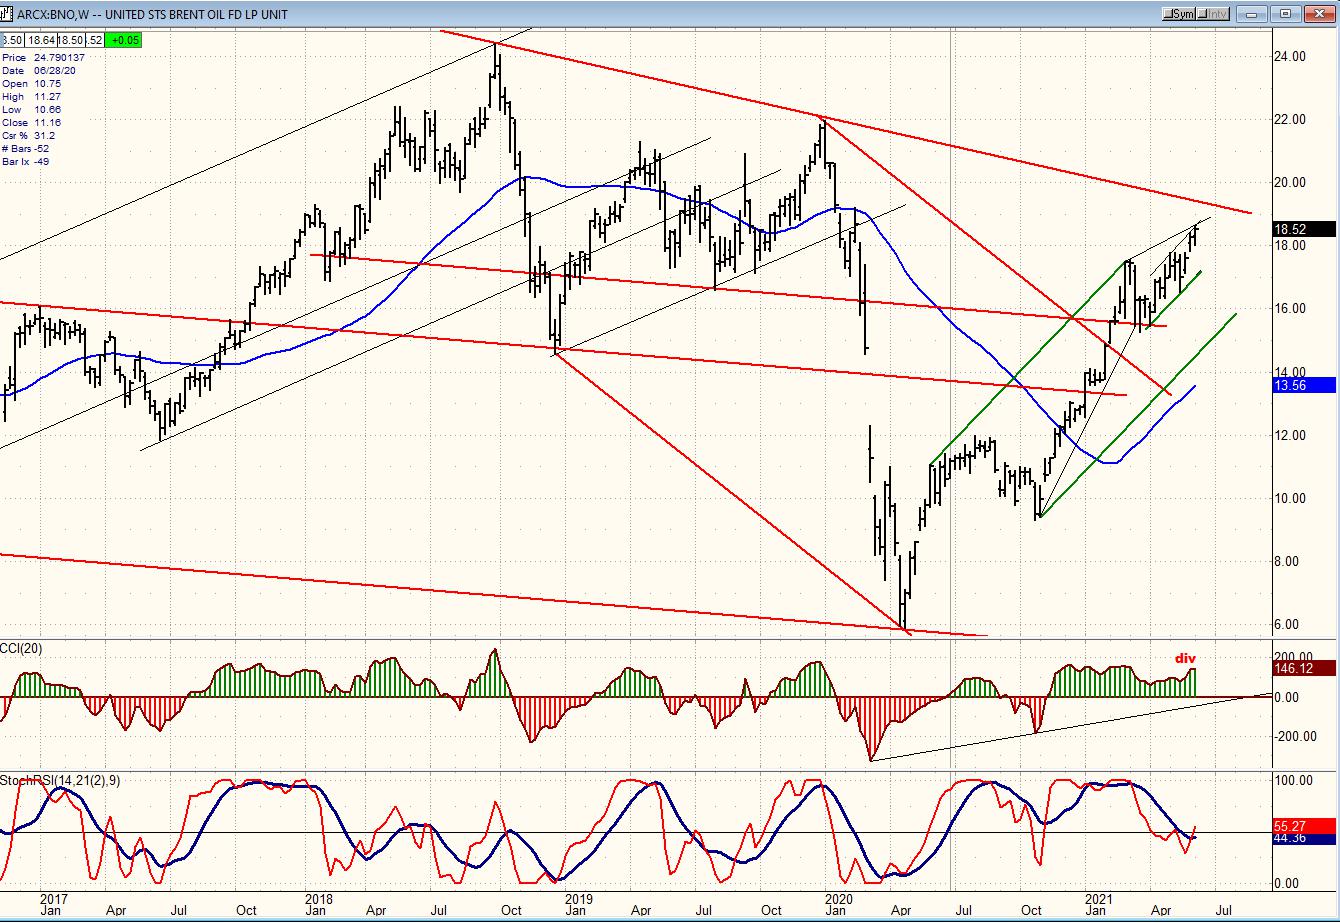
BNO (Brent oil fund) wkly
BNO pushed a little higher last week, but still looks limited on the upside and vulnerable to a correction.
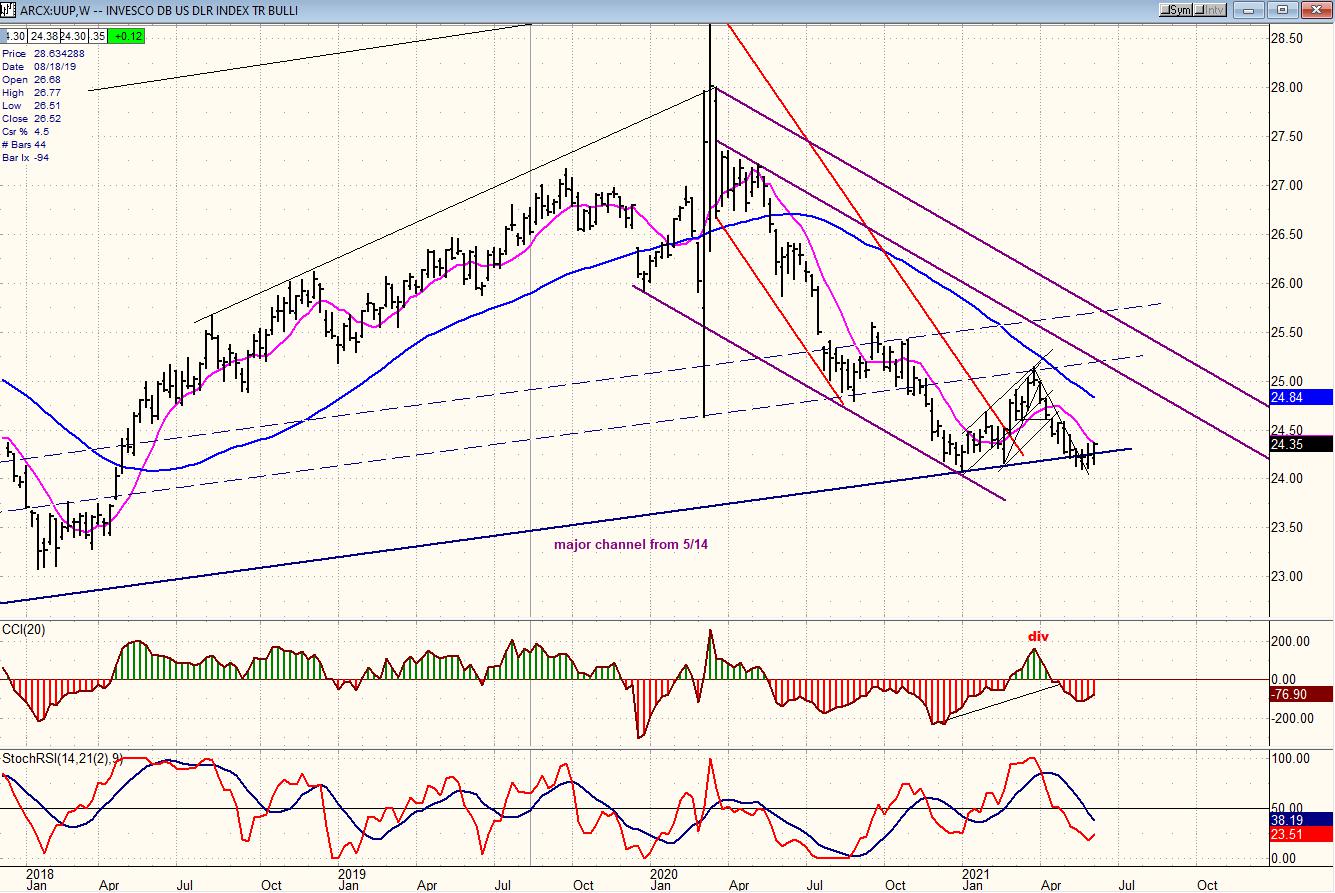
UUP (dollar ETF) (wkly) ($USD chart is not available from this data provider)
UUP bounced last week but has not yet given a buy signal.
SUMMARY
SPX is on its way to an intermediate top, which could arrive shortly. We should look for it after the short-term cycle has made its low and after the index has reached the vicinity of 4310.
NOTE: I have a new email: [email protected]
Free trial subscription
With a trial subscription, you will have access to the same information that is given to paid subscribers, but for a limited time-period. Over the years, I have developed an expertise in P&F charting (price projection), cycles (timing), EWT (structure), and general technical analysis which enables me to warn subscribers of pending reversals in market trends, and how far that trend can potentially carry. For a FREE 2-week trial, subscription options, and payment plans I encourage you to visit my website at www.marketurningpoints.com.
The above comments and those made in the daily updates and the Market Summary about the financial markets are based purely on what I consider to be sound technical analysis principles. They represent my own opinion and are not meant to be construed as trading or investment advice but are offered as an analytical point of view which might be of interest to those who follow stock market cycles and technical analysis.
********

When Andre Gratian was a stock broker years ago, a friend introduced him to technical analysis of the market. Consequently, it is not an exaggeration to say that Andre fell in love with this approach! Ever since then, it has become an increasingly important part of his professional life. Gratian has studied the works of Wyckoff, Edwards & Magee, Edward J. Dewey (cycles) and many others. However, one of my most profitable undertaking has probably been to study Point & Figure charting, which he finds invaluable in analyzing stocks and indices. If he were restricted to one methodology, this is the one that he would choose. This well-rounded background has given him what he feels to be a special insight into the stock market, facilitating the recognition of meaningful patterns and the ‘turning points’ in all trends, whether they be short or long term. Andre feels very comfortable discussing the stock market and passing on meaningful information to others. His subscribers include individuals and money managers throughout the world. Moreover, his Newsletters are currently published on several financial sites, here and abroad.
More from Gold-Eagle


