Technical Analysis Of The Markets


Current Position of the Market
SPX Long-term trend: There is some evidence that we are still in the bull market which started in 2009 and which could continue into 2021 before major cycles take over and it ends. A move up to ~4500 is possible before the current bull market makes a final top and SPX corrects into its next major cycle low due in 2023.
SPX Intermediate trend: SPX has likely reached the top pf its intermediate phase.
Analysis of the short-term trend is done daily with the help of hourly charts. They are important adjuncts to the analysis of daily and weekly charts which determine longer market trend
Projection Reached - Cycles Topping
Cycles: Looking ahead!
7-yr cycle – Last lows: 2009-2016. Next low: ~2023
Market Analysis (Charts, courtesy of QCharts)
DJIA – NDX – NYA daily charts
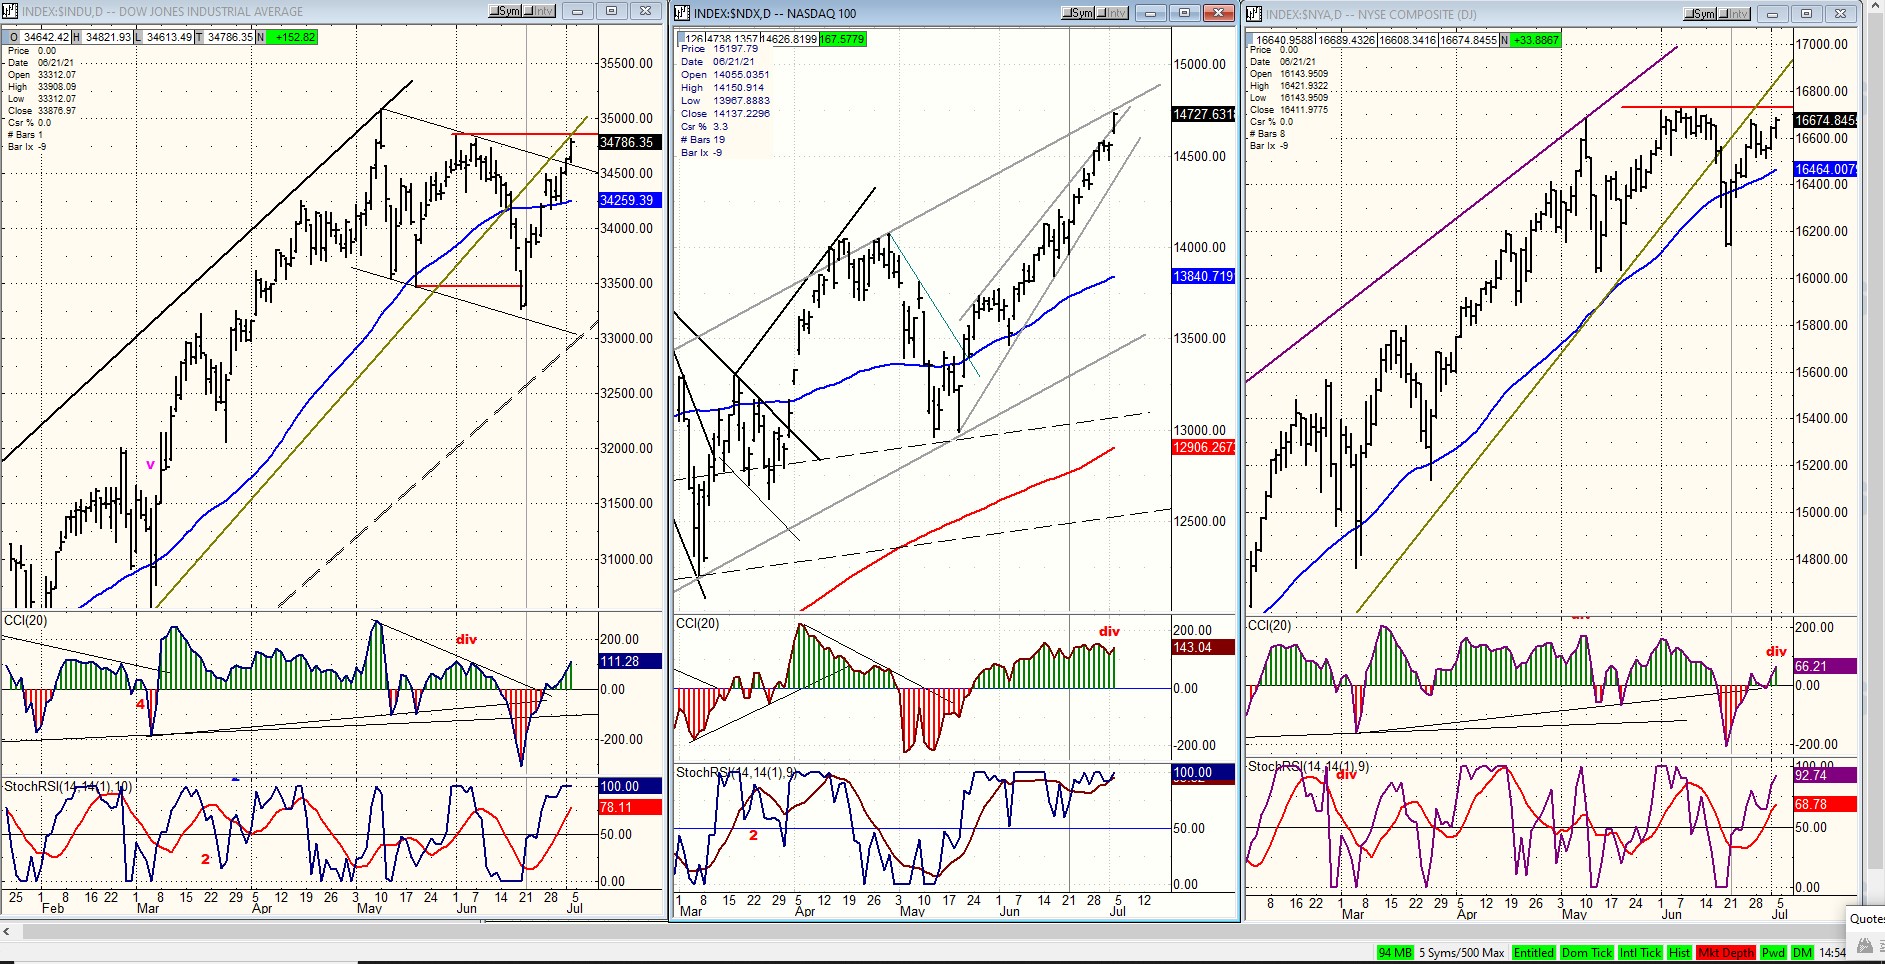
It is clear, when we watch this group of charts, that NDX is the index that has been driving the market higher -- especially the SPX which is a hybrid between the DJIA and the NDX. The contrast between NDX and the other benchmarks shown here, DJIA and NYA (which includes the greatest numbers of stocks by far) is stark! While NDX is possibly “blowing off” after forming a steep wedge, the other two indexes are simply retesting their former highs and may not exceed them.
SPX daily chart
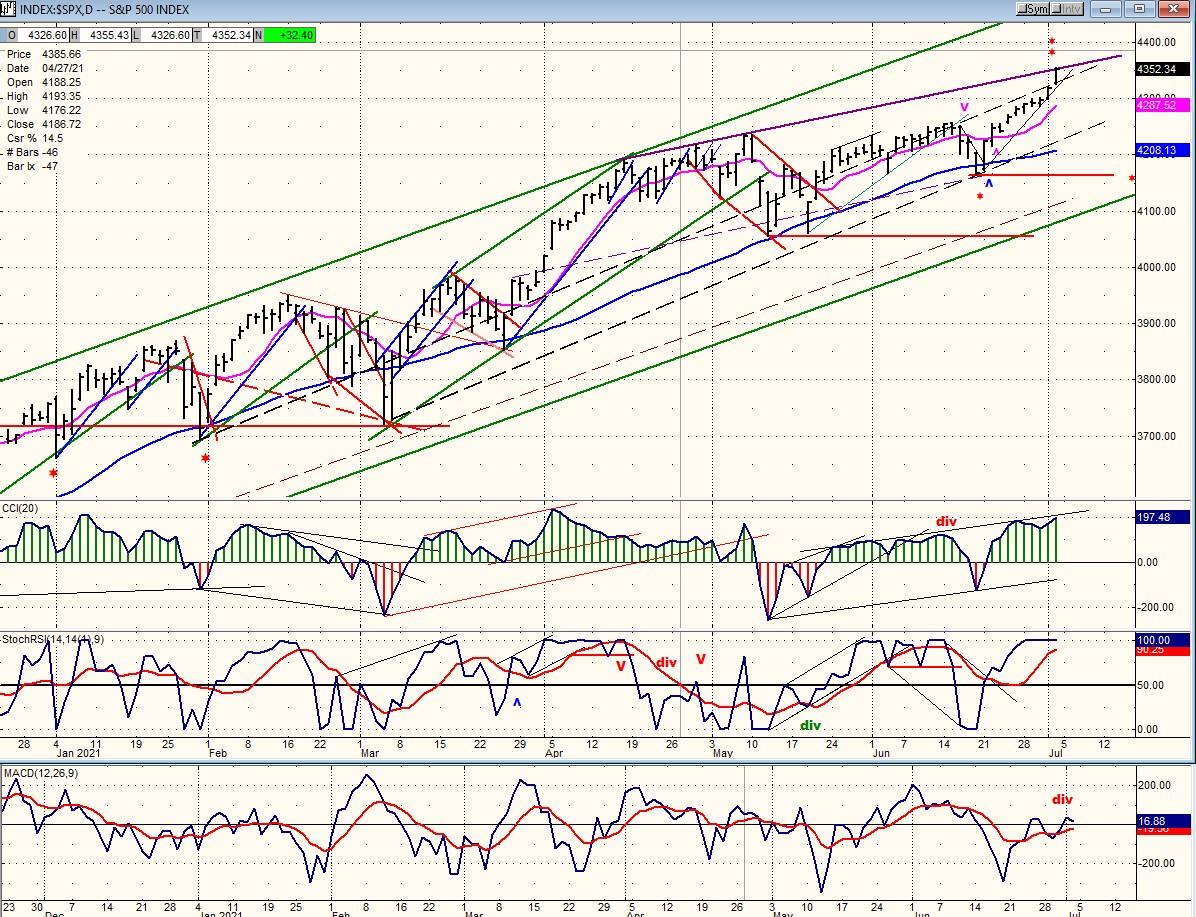
A few weeks ago, I thought that, based on its March ‘20 base P&F pattern, SPX could go to 4350. However, after seeing the degree of weakness in DJIA when it dropped into its short-term cycle low, I kept the likely projection price target at 4310. On Friday, driven by a possible climactic move in NDX, SPX reached an all-time high of 4355.43 and closed at 4352.34 but shows no confirmation of having struck a high point -- although that could come early next week.
The P&F base created in March 2020 should provide a clue for the end of the current bullish phase in the SPX. There were at least two possibilities for a high and, since this is only expected to be a phase count and not the end of the entire base-derived projection, the current targets could be exceeded. This is why they must be confirmed by the price action itself; but clues can also be derived from other technical tools.
One which is definitely getting our attention right now is the market breadth. Look at the A/D oscillator below! After a sharp drop into the short-term cycle low, it has barely remained positive. This is primarily due to the performance of the NYA (above) which, along with the DJIA is clearly lagging SPX, and especially NDX. The price indicators themselves are overbought with minor divergence showing in the CCI. But CCI negative divergence is clearly evident on the above NDX chart.
Also, we should not lose sight of the fact that the short-term cycle is now past its mid-point and should start to exert downward pressure on a severely overbought market.
Perhaps the strongest warning comes from Eric Hadik, the expert on cycles, who characterizes the current market as having reached its “ultimate, extreme, upside targets”
SPX hourly chart
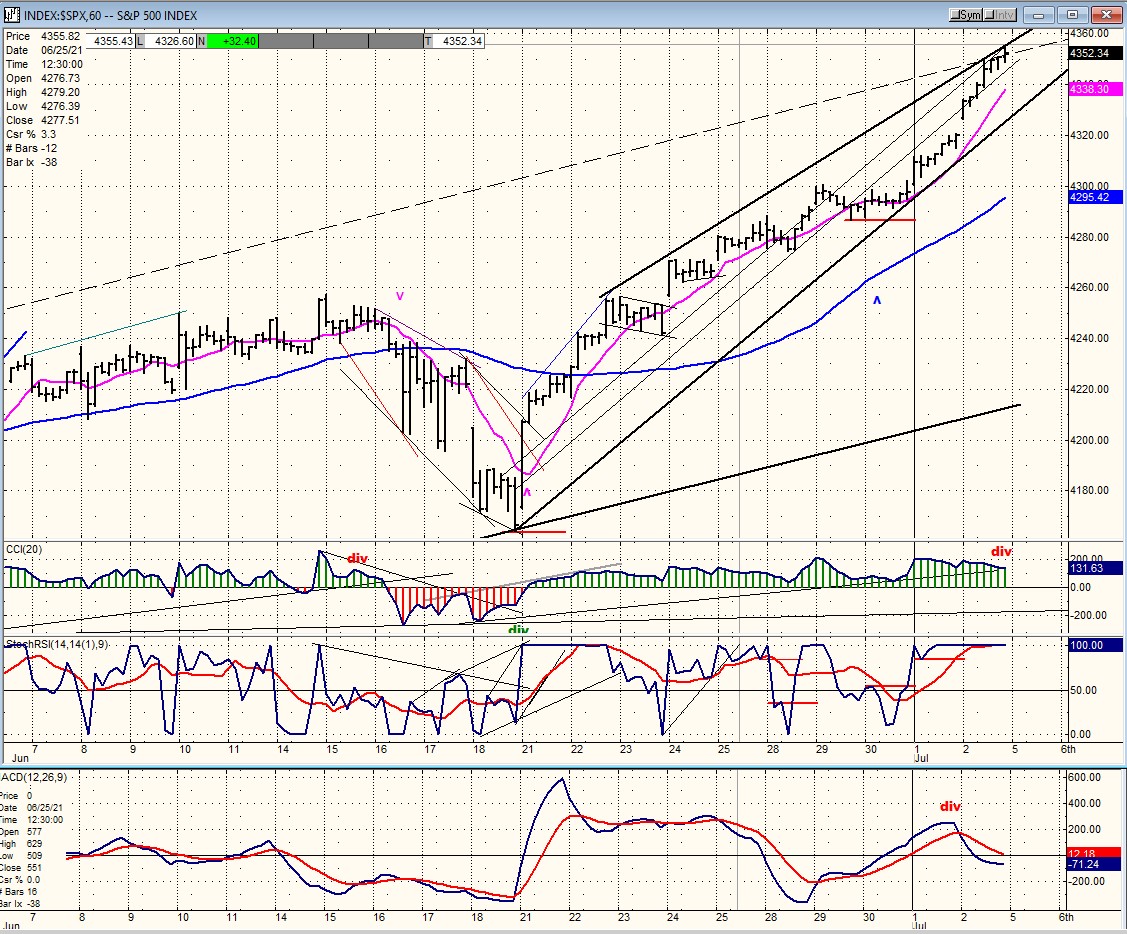
Influenced by what looks like a climactic wedge in the NDX index, hourly SPX has also produced a smaller wedge since the last short-term cycle low. The straight-up move in this index has failed to create noticeable divergence in the CCI, although upon closer look, we see that the high of that index was made four days ago while the latter rose 55 points. So, the divergence is there, just not that obvious. And, of course, the divergence is apparent in the breadth indicator -- especially on Friday during the final 30 points of the uptrend during which the indicator actually retreated.
Wedge patterns are notoriously bearish and often cause a price retracement down to the beginning of the formation which in this case would be 4164. So, the course of the coming correction into the cycle low may well be a continuous decline rather than a gradual one.
GDX (gold miners) (dly)
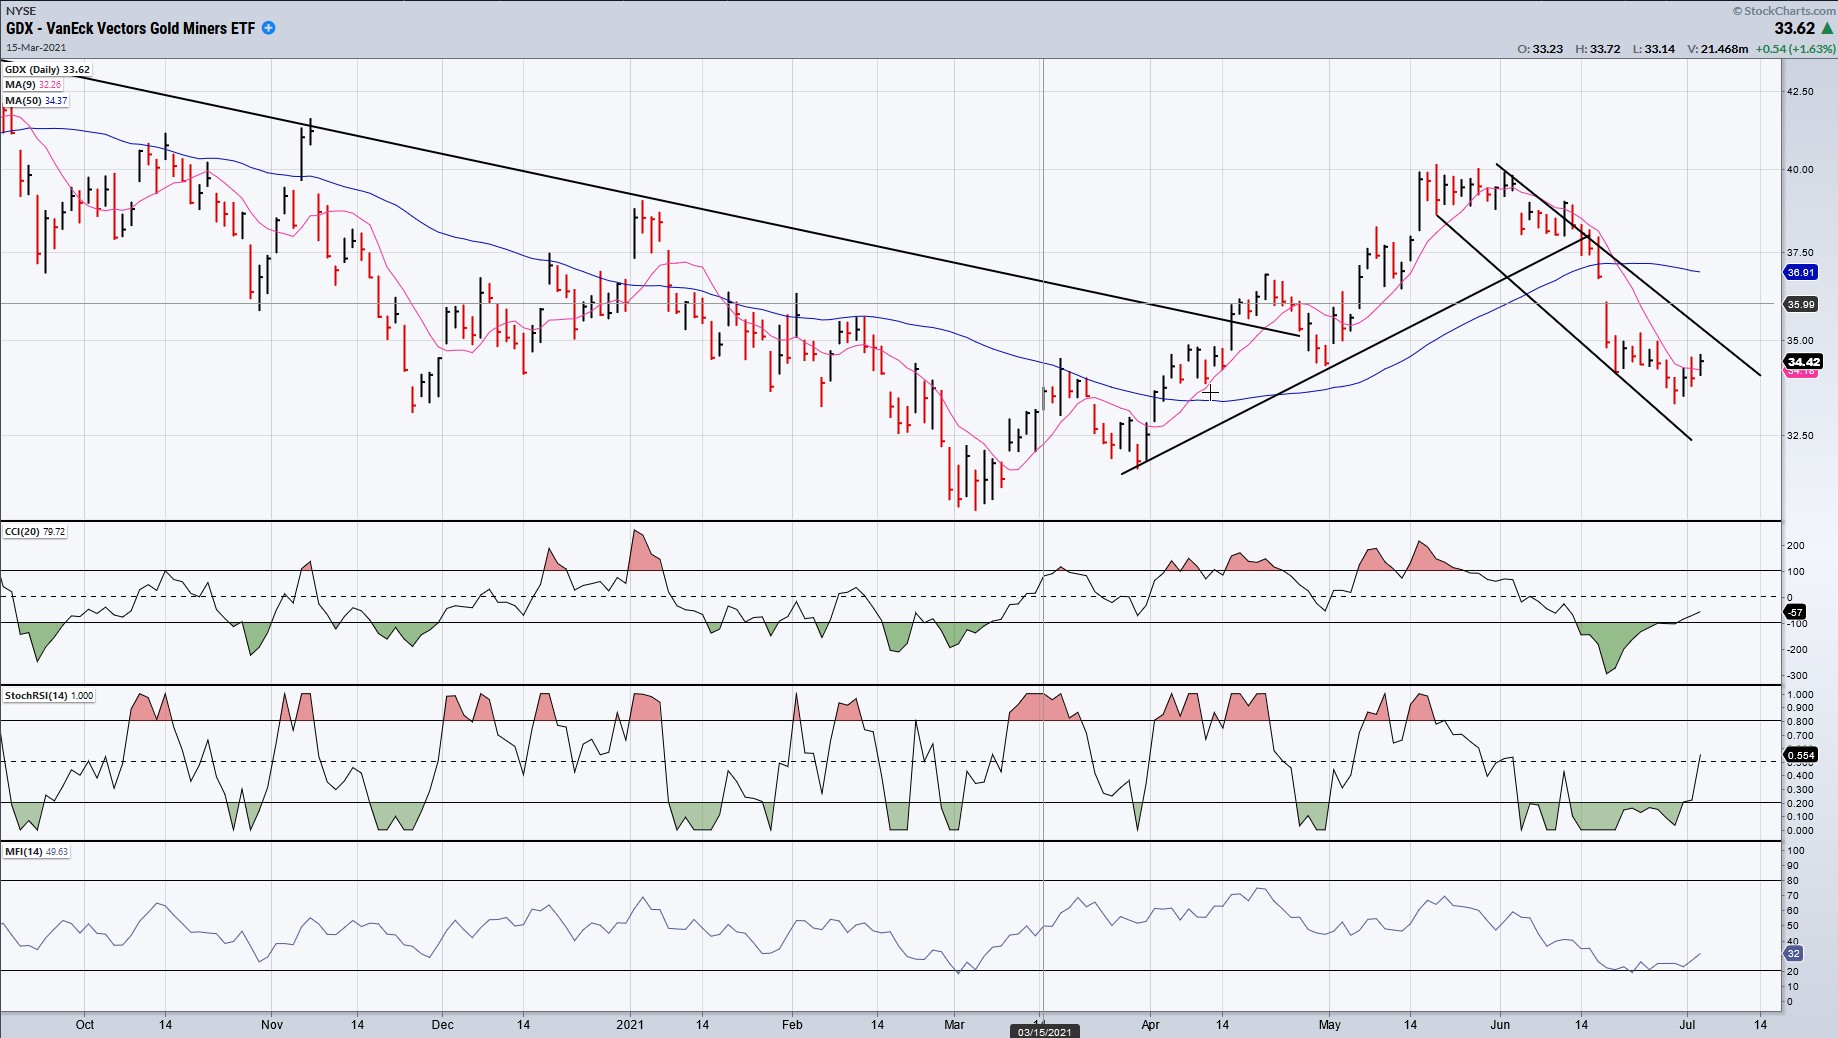
GDX may have found a cycle low. It has started a minor uptrend which will have to expand and move out of its channel in order to suggest that buyers are returning in a meaningful way. Indicators look favorable, but it may have to build another base above 35 before it can make much headway.
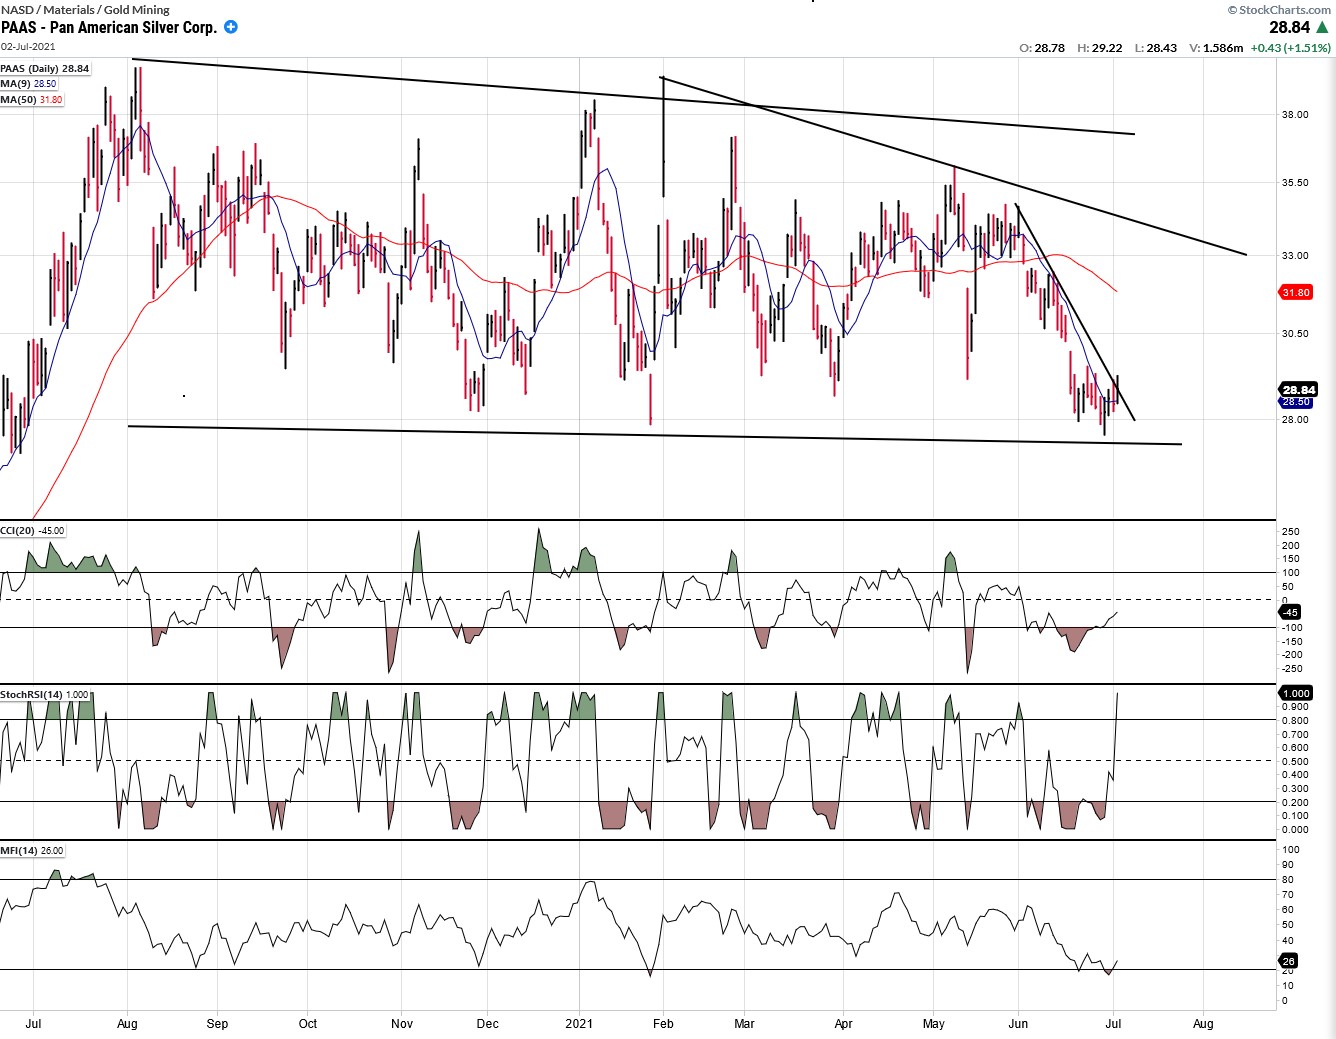
PAAS (dly)
PAAS is following GDX -- or vice-versa. Short-term patterns for both are almost identical and should produce the same results. PAAS may have a small P&F advantage, having already had a couple of one-point reversals.
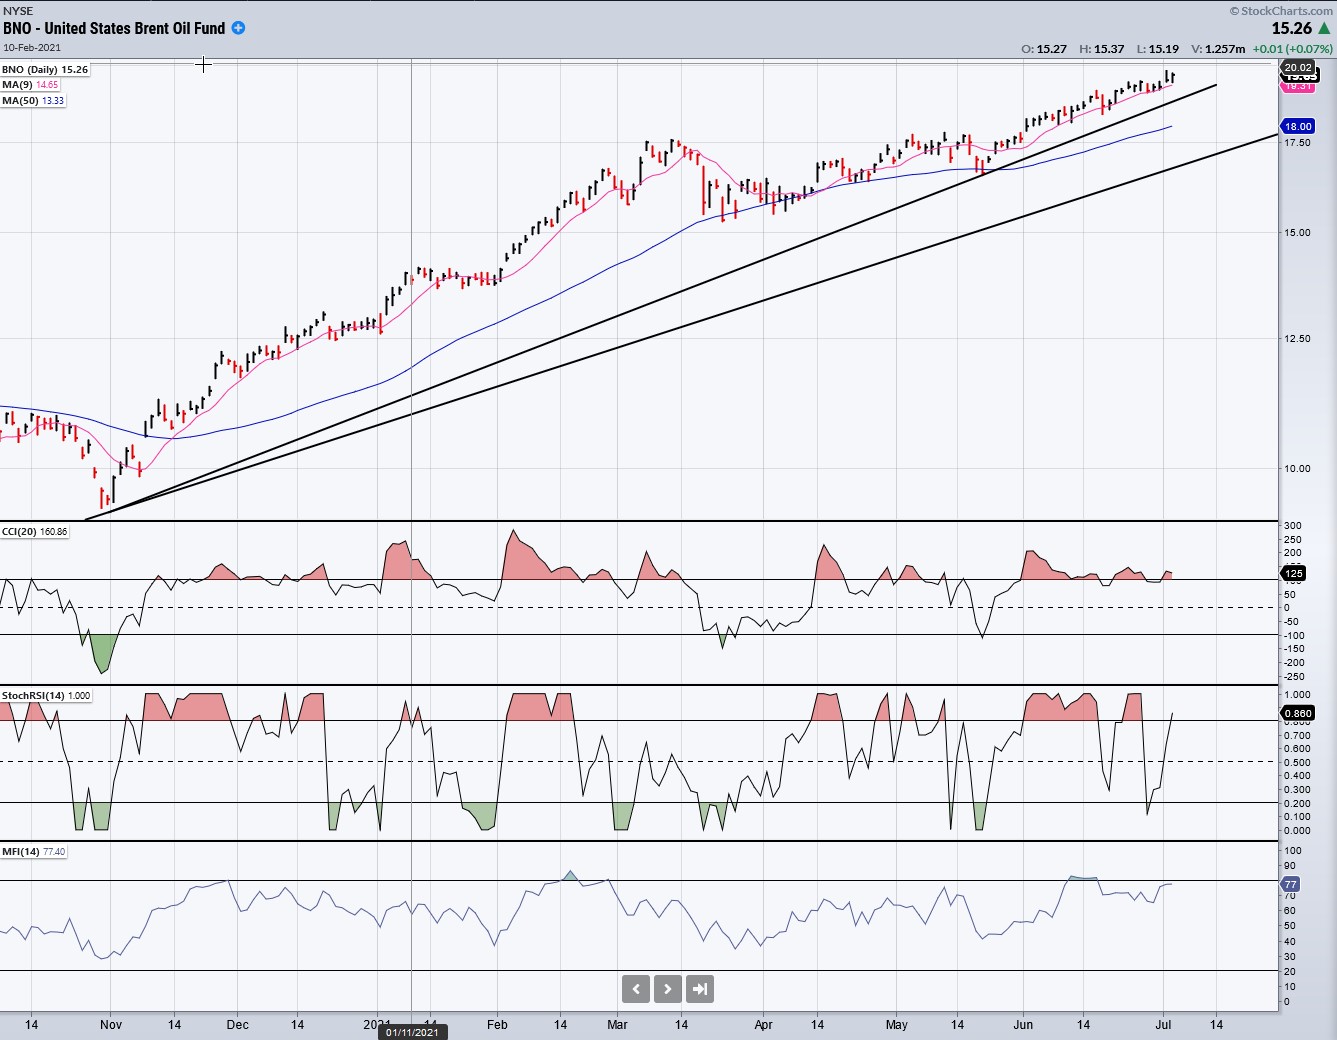
BNO (Brent oil fund) dly
BNO is beginning to show signs of topping in its indicators. It will have to break below the top trend line, or at least below the shorter MA to start a correction.
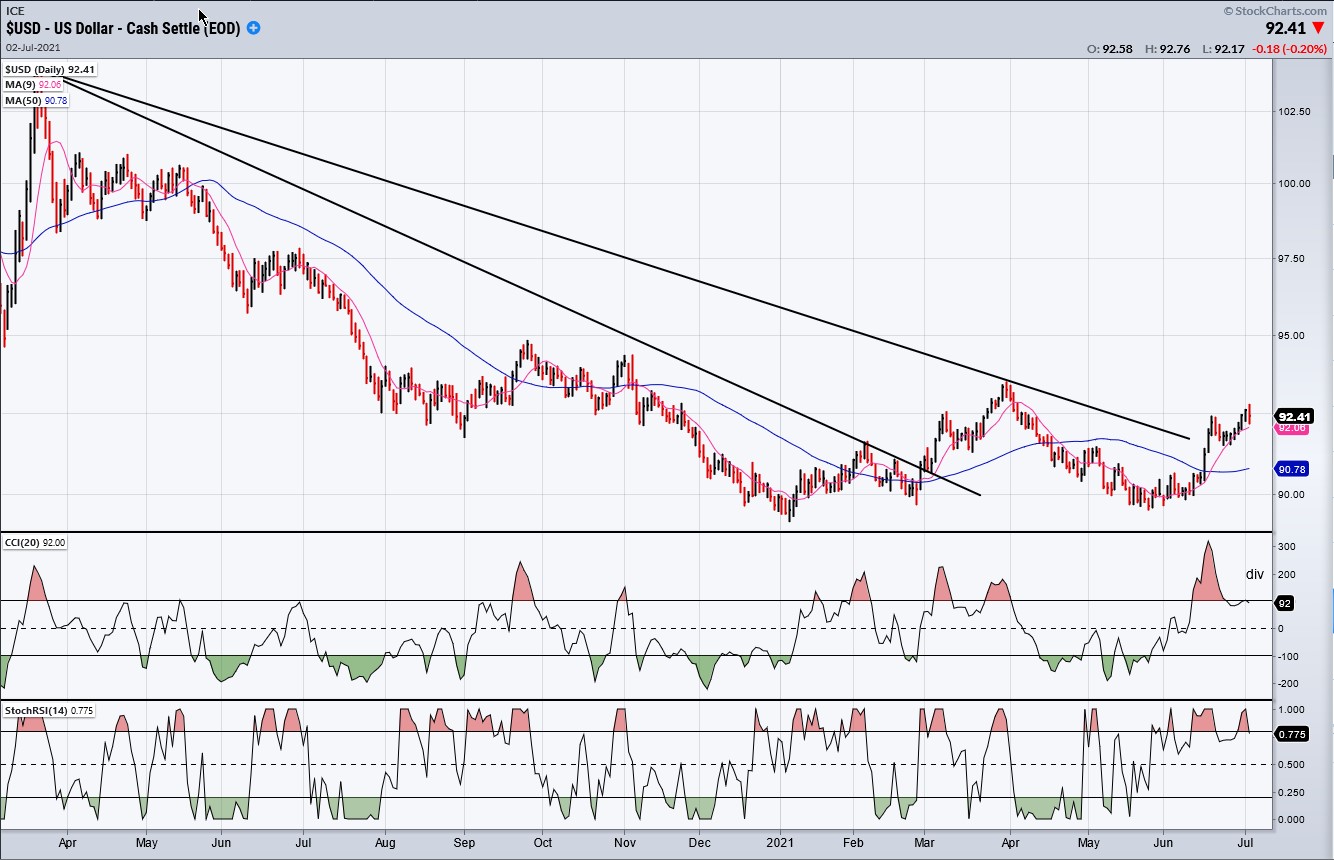
USD (dollar) (dly)
The dollar has bounced twice off its base but may have already reached the top of its second rally. Divergence has developed in the indicators which could lead to a pull-back. If this occurs, it could benefit gold and silver.
SUMMARY
Is the NDX making a climactic finale? With the chart pattern having formed a narrow, extended wedge it’s certainly possible. This strength combined with a rally in DJIA has enabled the SPX to reach its phase projection, and this could lead to the start of an intermediate correction, especially with breadth making such a poor showing.
Free trial subscription
With a trial subscription, you will have access to the same information that is given to paid subscribers, but for a limited time-period. Over the years, I have developed an expertise in P&F charting (price projection), cycles (timing), EWT (structure), and general technical analysis which enables me to warn subscribers of pending reversals in market trends, and how far that trend can potentially carry. For a FREE 2-week trial, subscription options, and payment plans I encourage you to visit my website at www.marketurningpoints.com.
The above comments and those made in the daily updates and the Market Summary about the financial markets are based purely on what I consider to be sound technical analysis principles. They represent my own opinion and are not meant to be construed as trading or investment advice but are offered as an analytical point of view which might be of interest to those who follow stock market cycles and technical analysis.
********

When Andre Gratian was a stock broker years ago, a friend introduced him to technical analysis of the market. Consequently, it is not an exaggeration to say that Andre fell in love with this approach! Ever since then, it has become an increasingly important part of his professional life. Gratian has studied the works of Wyckoff, Edwards & Magee, Edward J. Dewey (cycles) and many others. However, one of my most profitable undertaking has probably been to study Point & Figure charting, which he finds invaluable in analyzing stocks and indices. If he were restricted to one methodology, this is the one that he would choose. This well-rounded background has given him what he feels to be a special insight into the stock market, facilitating the recognition of meaningful patterns and the ‘turning points’ in all trends, whether they be short or long term. Andre feels very comfortable discussing the stock market and passing on meaningful information to others. His subscribers include individuals and money managers throughout the world. Moreover, his Newsletters are currently published on several financial sites, here and abroad.


