Technical Analysis Of The Markets


Current Position of the Market
SPX Long-term trend: There is some evidence that we are still in the bull market which started in 2009 and which could continue into 2021 until major cycles take over, and it ends. A move up to ~4500 is possible before the current bull market makes a final top and SPX corrects into its next major cycle low due in 2023.
SPX Intermediate trend: SPX should now have reached its next intermediate top.
Analysis of the short-term trend is done daily with the help of hourly charts. They are important adjuncts to the analysis of daily and weekly charts which determine longer market trends.
Stock Market Dichotomy
Cycles: Looking ahead!
7-yr cycle – Last lows: 2009-2016. Next low: ~2023
Market Analysis (Charts, courtesy of StockCharts)
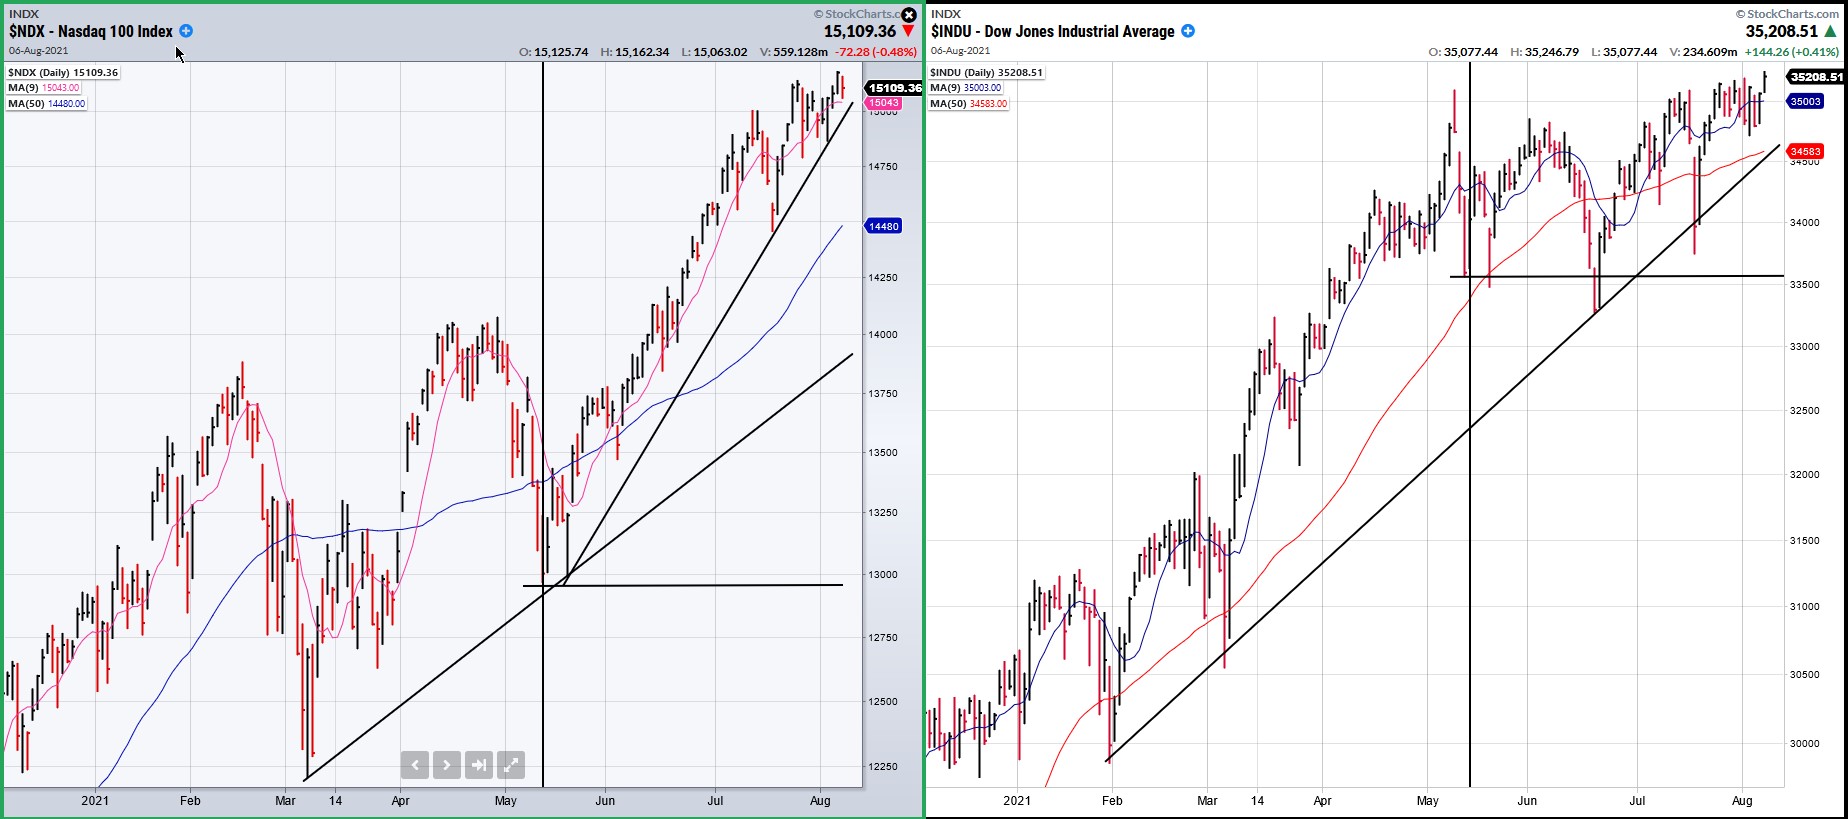
NDX vs. NYA
I’m willing to bet that few investors are aware of the pronounced dichotomy which exists between the NDX, on the left, and the DJIA, on the right with the news media continuing to report that “today, the market made another new high”. For the first part of the year, the Dow outperformed the NDX, but from May forward, it’s been all NDX. That makes it a little difficult to state accurately what the “market” is doing! In this newsletter, I discuss primarily the SPX which is a composite of the two and which consequently is probably the best representation of the whole market.
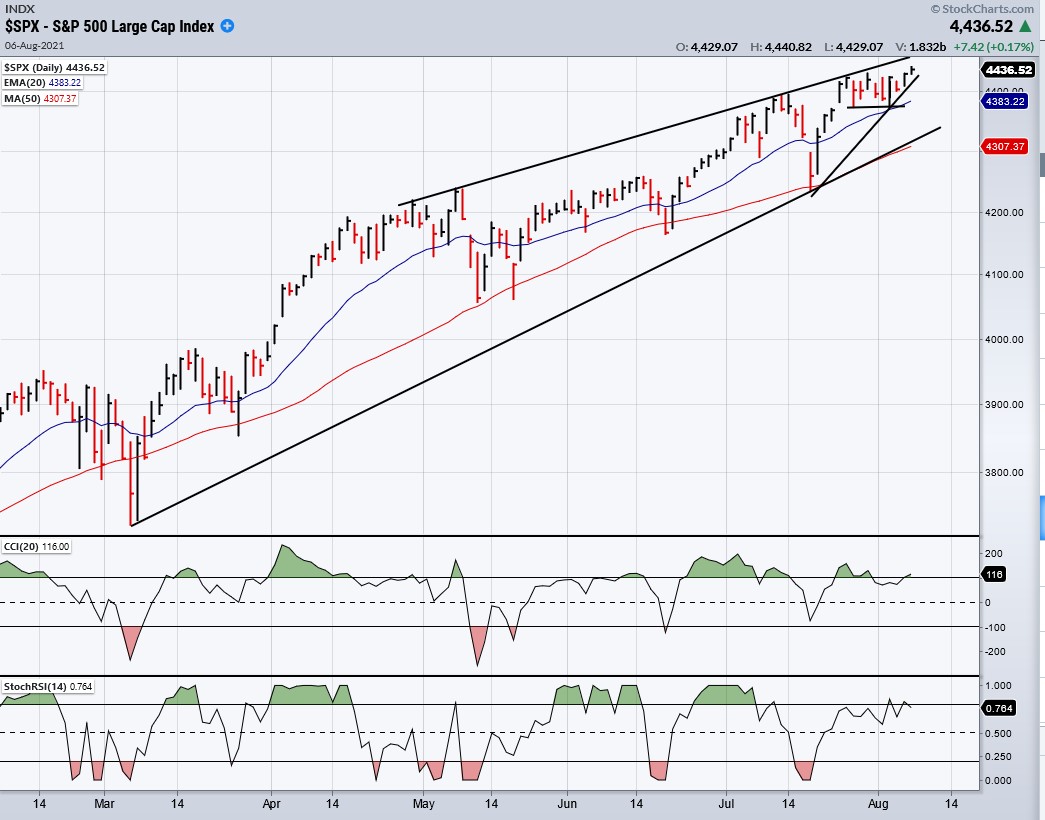
SPX daily chart
Even though SPX is a composite of the two indexes shown above, it can still be analyzed individually. The chart below shows the entire intermediate phase which SPX should be completing at this time. In the P&F chart, the action from the 3950 high into the 3723 low, produced a congestion level which recharged the index’s batteries and projected a move to 4440. After two weeks of hesitation around 4420, that level was finally reached at the opening on Friday, after which the index traded in a narrow range but did not exceed it for the rest of the day. Can we now start the anticipated correction? Not until we break the secondary trend line shown on the chart and follow that with a move below the horizontal trend line (4372).
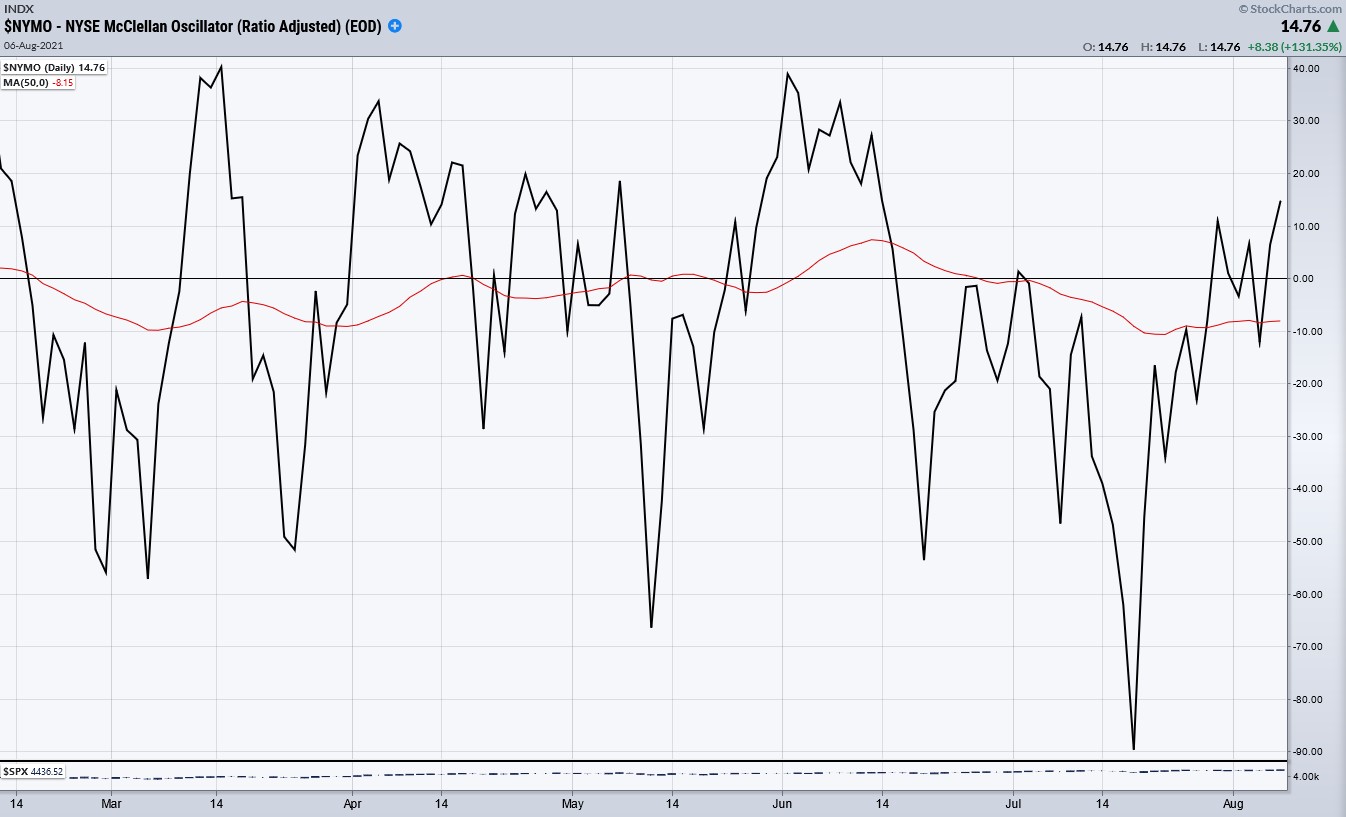
There are good reasons to believe that this will soon take place! The oscillators at the bottom of the chart have been showing negative divergence for over a week, and the McClellan oscillator which measures market breadth is recovering from posting the lowest mark since the March 2020 bottom, but it remains barely positive. And the best reason yet is that the short-term cycle is due to make its low next week. There are times when it waits for the last minute and declines all at once. The last two phases are good examples of that, with the index declining suddenly during the last four days of the cycle phase.
And then what? It’s obvious that the tech sector is currently keeping SPX bullish. The DJIA may already be acquiring the profile of an intermediate top, but more needs to happen before everything falls into place and we have created the top formation which will lead to a decline into the 7-year cycle low – including (potentially) a final high around 4550 in SPX.
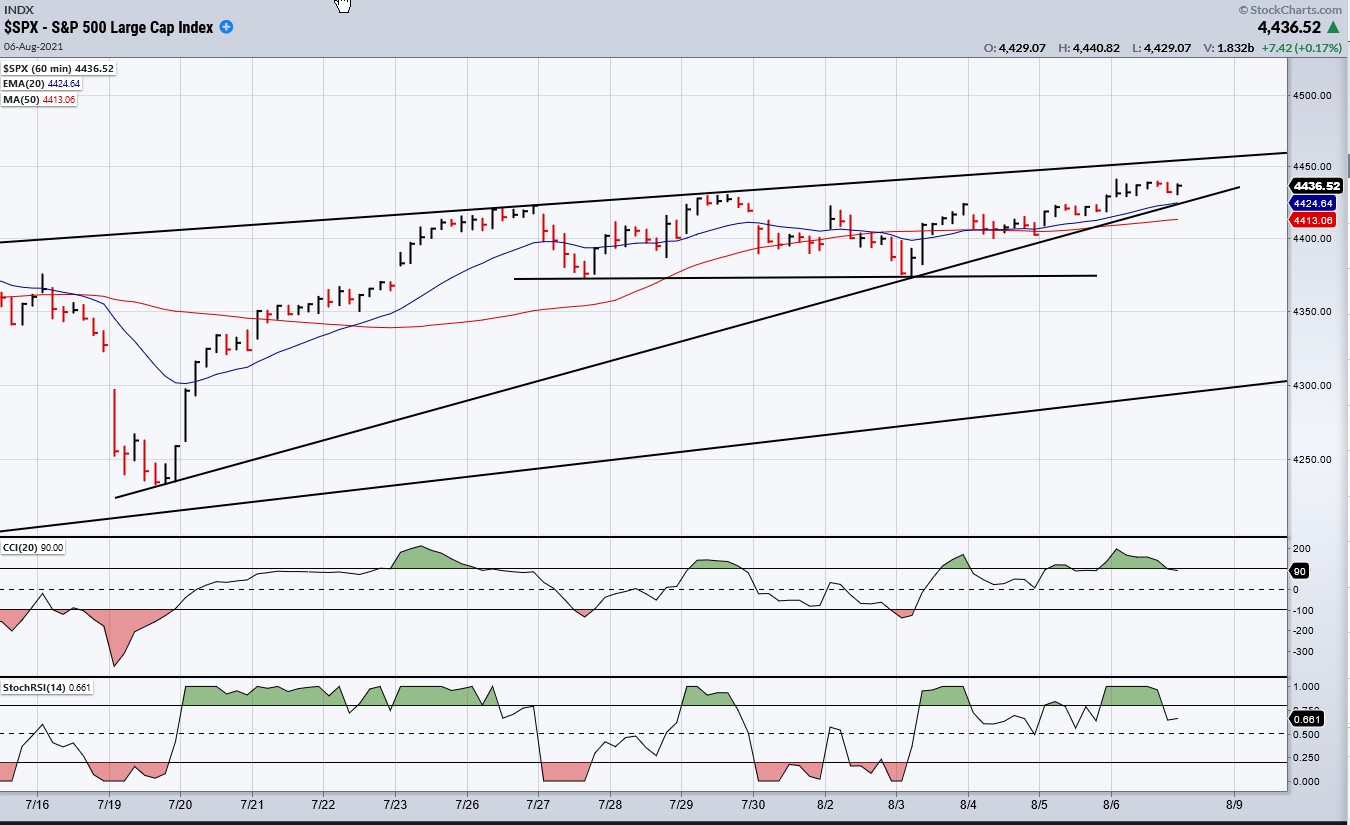
SPX hourly chart
This 60m chart represents the profile of the current short-term cycle. SPX got off to a fast start, as it usually does in a bull market, but started to stall early in its positive phase. This led to expectations that It might turn down early after coming within ten points of the 4440 projection in late July; but after successfully retesting the 4372 low, it continued to drift higher and finally reached 4440 on Friday, bolstered by a good jobs report. Its action on Friday created a little negative divergence in the indicators and brought it close to the secondary trendline (its phase trend line) which will have to be broken decisively to suggest that it has started the decline into its low. There are only a few days left in the cycle phase, so this could happen at any time.
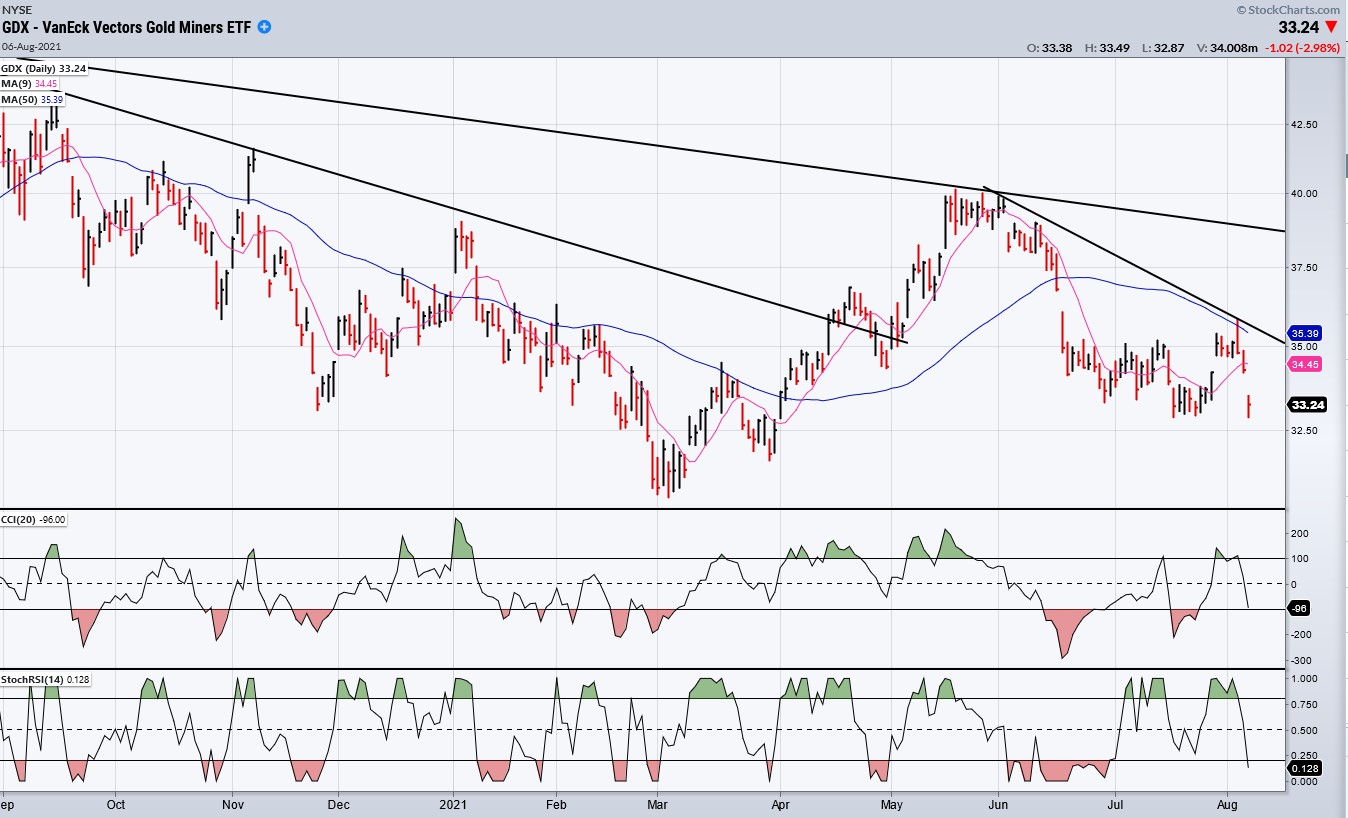
GDX (gold miners) (dly)
When GDX looked as if it were stabilizing recently, I mentioned that its upside options were limited, perhaps 35-35.50, In fact, it made it to 35.82 before running into selling which drove it right back to its low. Why did it stop there? First, because that was all the P&F base allowed. Second, because that’s where it ran into the 50-dma. If it can hold the former lows, it can add to its base and make it to a higher level next time -- if it can clear the 50-dma.
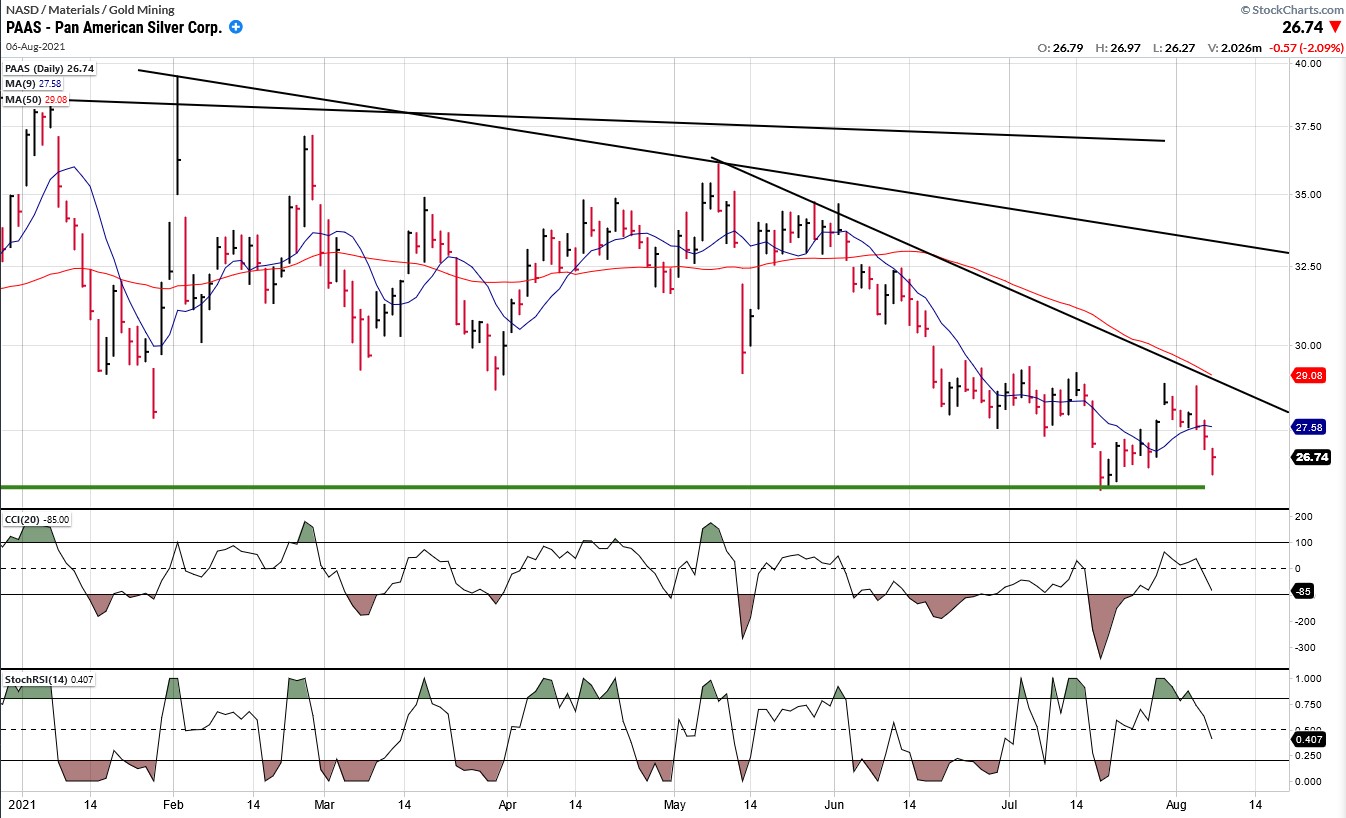
PAAS (dly)
The same thing happened to PAAS, but there is a slight difference! PAAS is situated on a much stronger support base and is farther along in building a base which would allow for a decent move to about 33 (if it can clear 29 and get past the 200-dma).
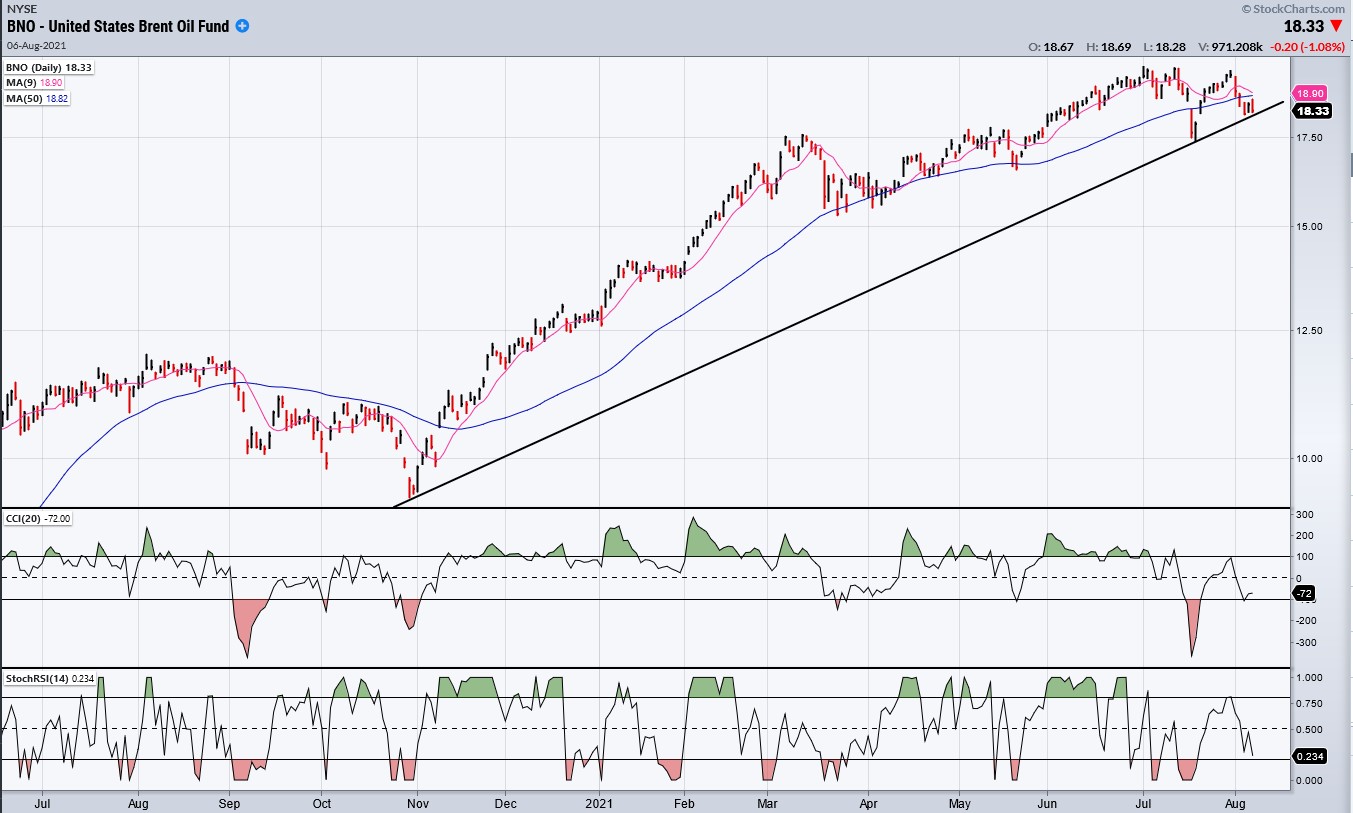
BNO (Brent oil fund) dly
BNO is flirting with a retracement down to 15. All it needs to do is to close below its trend line.
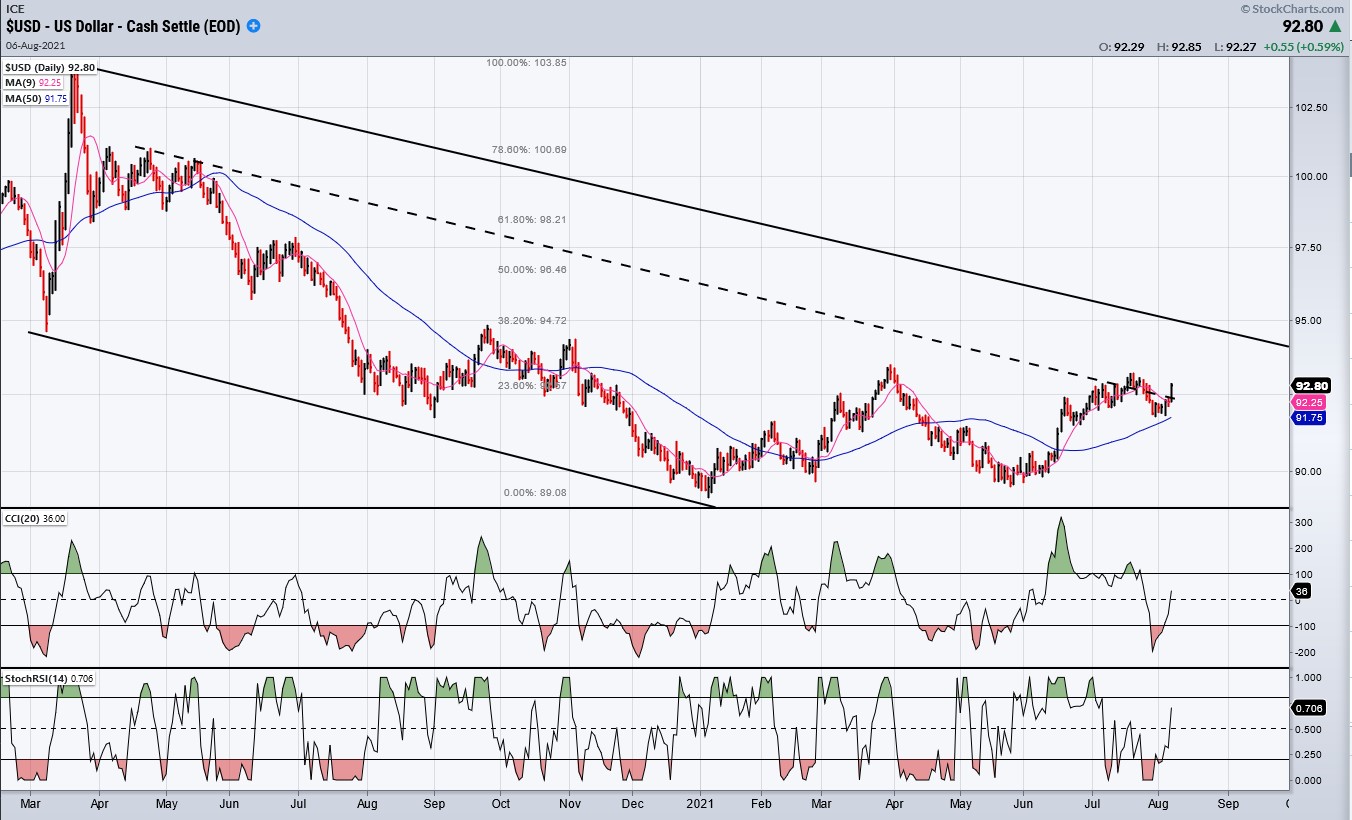
USD (dollar) dly
As long as it can hold above 91, the dollar can still challenge the top of its corrective channel.
SUMMARY
The DJIA is obviously losing intermediate momentum, but it can regain it if it can work its way back into a short-term uptrend right away-- which does not seem likely with the short-term cycle ready to keel over. A correction in NDX would also help SPX turn down also.
Free trial subscription
With a trial subscription, you will have access to the same information that is given to paid subscribers, but for a limited time-period. Over the years, I have developed an expertise in P&F charting (price projection), cycles (timing), EWT (structure), and general technical analysis which enables me to warn subscribers of pending reversals in market trends, and how far that trend can potentially carry. For a FREE 2-week trial, subscription options, and payment plans I encourage you to visit my website at www.marketurningpoints.com.
The above comments and those made in the daily updates and the Market Summary about the financial markets are based purely on what I consider to be sound technical analysis principles. They represent my own opinion and are not meant to be construed as trading or investment advice but are offered as an analytical point of view which might be of interest to those who follow stock market cycles and technical analysis.
********

When Andre Gratian was a stock broker years ago, a friend introduced him to technical analysis of the market. Consequently, it is not an exaggeration to say that Andre fell in love with this approach! Ever since then, it has become an increasingly important part of his professional life. Gratian has studied the works of Wyckoff, Edwards & Magee, Edward J. Dewey (cycles) and many others. However, one of my most profitable undertaking has probably been to study Point & Figure charting, which he finds invaluable in analyzing stocks and indices. If he were restricted to one methodology, this is the one that he would choose. This well-rounded background has given him what he feels to be a special insight into the stock market, facilitating the recognition of meaningful patterns and the ‘turning points’ in all trends, whether they be short or long term. Andre feels very comfortable discussing the stock market and passing on meaningful information to others. His subscribers include individuals and money managers throughout the world. Moreover, his Newsletters are currently published on several financial sites, here and abroad.
More from Gold-Eagle


