Technical Analysis Of The Markets
 share
share
 share
share
 share
share
 share
share
 share
share
Current Position of the Market
SPX Long-term trend: There is some evidence that we are still in the bull market, which started in 2009 and which could continue into 2021 until major cycles take over, and it ends. A move up to ~4500 is possible before the current bull market makes a final top…and SPX corrects into its next major cycle low due in 2023.
SPX Intermediate trend: SPX should now have reached its next intermediate top.
Analysis of the short-term trend is done daily with the help of hourly charts. They are important adjuncts to the analysis of daily and weekly charts which determine longer market trends
Strong Intermediate Reversal Warning
Cycles: Looking ahead!
7-yr cycle – Last lows: 2009-2016. Next low: ~2023
Market Analysis (Charts, courtesy of StockCharts)
SPX vs. IWM (comparison and warning)
There are many ways that a technical analyst can determine the state of the stock market. We know that the latter progresses in stages, a bullish phase followed by a bearish phase, followed by another bullish phase, etc…. This process repeats itself ad infinitum over the short-term (days), the intermediate term (weeks) and the long term (months). One of the most reliable ways to determine the future intermediate market trend is by comparing the action of IWM (Russell 2000 ETF) to SPX (S&P500). As far as I know, IWM has never failed to predict the end of a trend in SPX by topping ahead of it, though the warning period can vary greatly. On the charts below, we can see that just ahead of the severe decline into March 2000, the warning only came about a month ahead of time.
So, what is IWM telling us today!
The charts posted below are weekly charts, best suited to forecast the intermediate trend of the market. Three market phases are well defined on the charts, plus the beginning of a fourth (incomplete?) one. During phase 1, the two indices performed similarly, with IWM only slightly underperforming SPX. During the second phase, IWM made up for it by outperforming its market counterpart. After that, starting in early March of this year, IWM started to show some relative weakness. This continued until mid-July, during which time SPX -- primarily propelled higher by NDX -- continued to move aggressively higher.
We now come to the most important period of this analysis. SPX had a brief one week decline at “3”, while IWM declined for 4 weeks during that relative period, dropping back to the level at which it traded at “2” (3/01). For the next month (which brings us to Friday’s close) SPX progressed higher, past its 9-dma, while IWM could not get past it and even turned down last week, while SPX continued still higher.
Conclusion: I have warned for some time that we were coming into an intermediate market top and so has IWM! That warning reached a heightened level last week. We should listen!

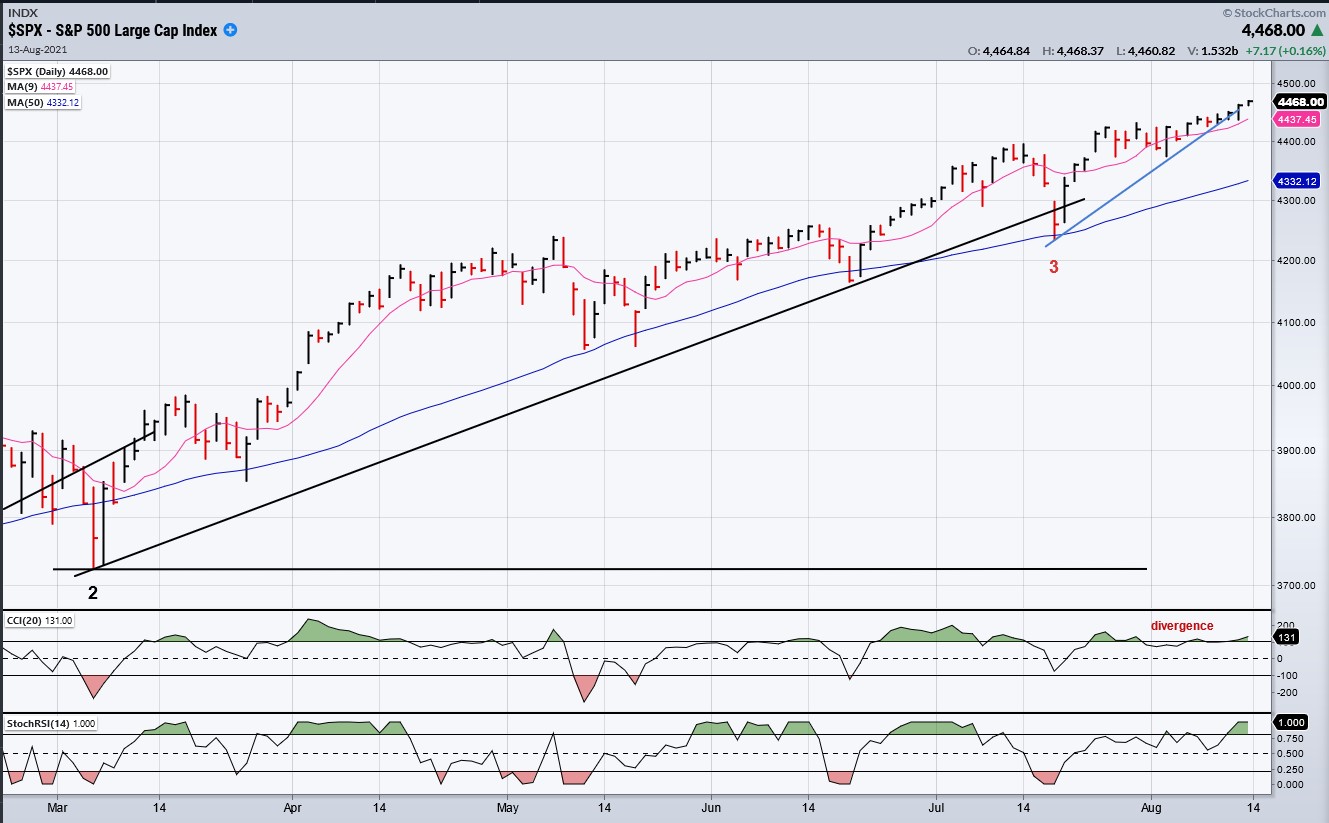
SPX daily chart
This is the daily rendition of the SPX weekly chart starting at “2”. I did not display IWM, but you know what it did during this period by looking on the chart above. Focus particularly on the period at the start of “3”. After a quick move upward fostered by a new phase of the short-term cycle, SPX did not do much, trading in a range limited on the upside at ~4430. For some time, I have had a projection to 4440 dating from the P&F pattern made at the 3723 re-accumulation low, and it looked as if we were preparing to touch that level and reverse in conjunction with the down phase of the short-term cycle. Instead, the index started to crawl higher closing at 4468 on Friday, seemingly disregarding both the 4440 target and ignoring the down phase of the short-term cycle.
I will next continue this analysis with the hourly chart. But I first want to point out the negative divergence which has persisted in the CCI for the past two weeks; adding to the perception that we are about to get a price reversal.
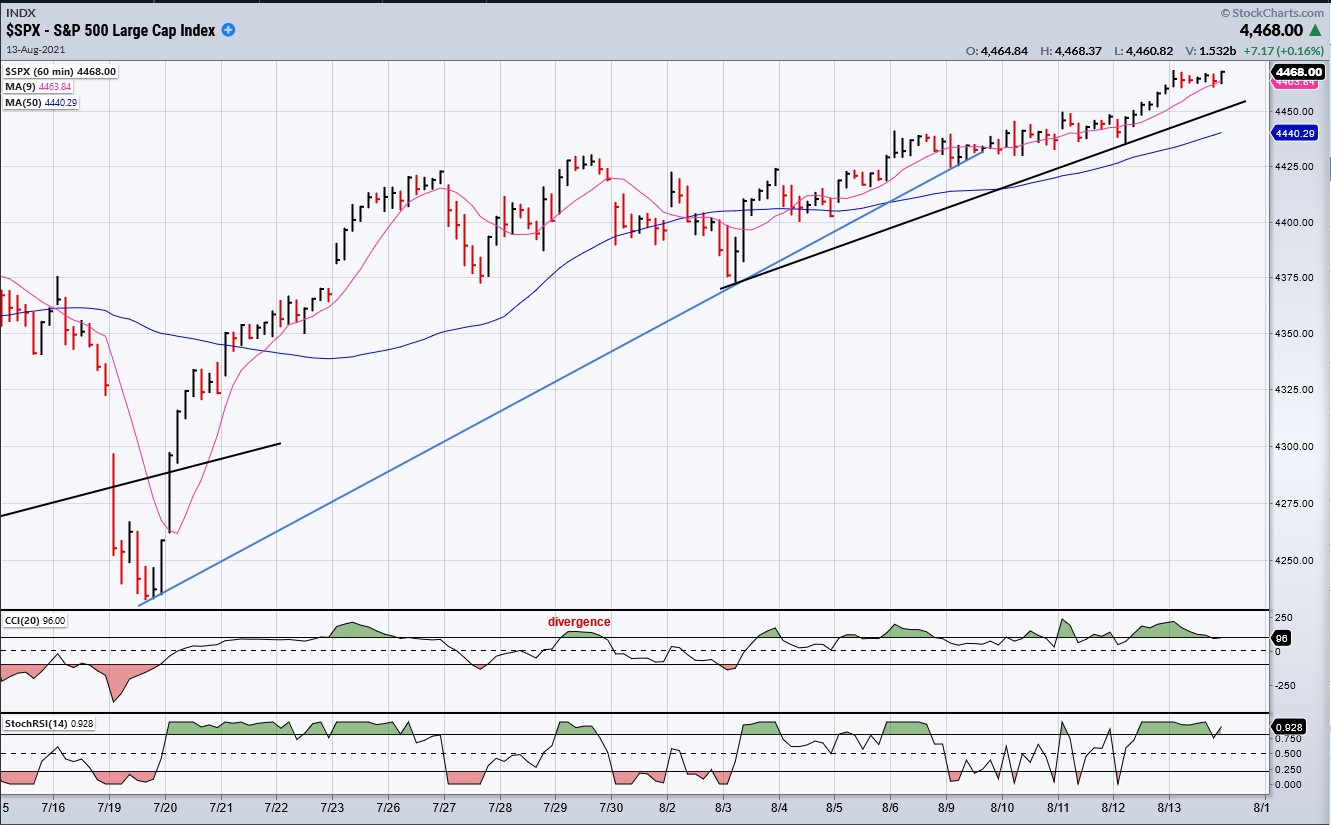
SPX hourly chart
This chart represents the ending phase of the last short-term cycle and the beginning phase of the new cycle which should now be in its down phase but which, instead has found new life and is moving higher. Also, instead of rolling over after meeting the 4440-projection, the index appears to have made another short-term re-accumulation phase above 4373, pointing to a potential move to 4480. This may be the level for which the index is aiming before pulling back. It is also possible that the cycle has ‘extended’ and will start retracing when that level is reached or approximated. In any case, the process should clarify itself over the next couple of days with the breaking of the last small trend line which starts on 8/3, perhaps with a sharp retracement if the cycle low was indeed delayed. This scenario seems to fit in with the warning of the IWM pattern. If you are a bull, some caution may be warranted.
GDX (gold miners) (dly)
GDX is currently retesting its former March low and may not be done -- at least there is no sign of it yet. More time is required.

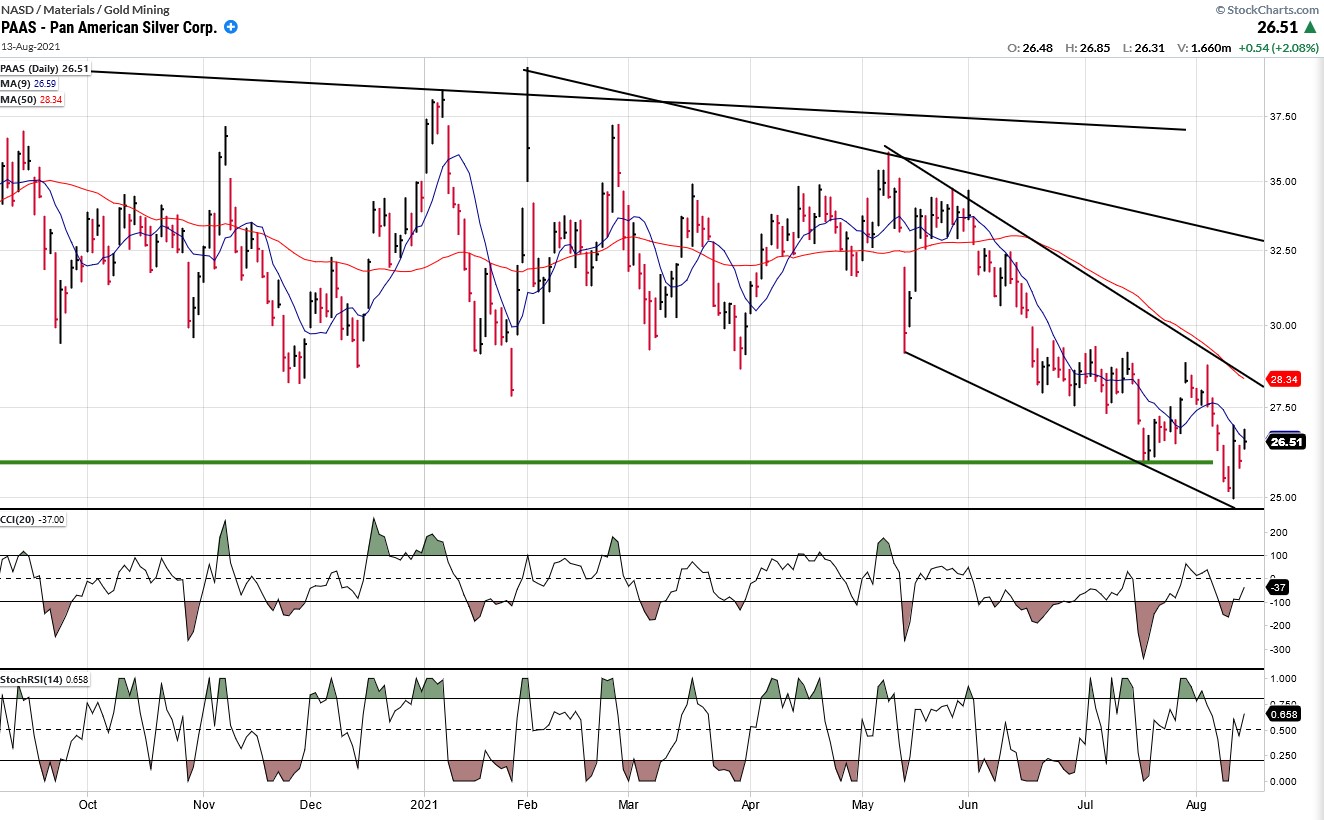
PAAS (dly)
PAAS has moved back to the low of its corrective pattern and also needs more time to determine whether it is capable of establishing a base at this level.
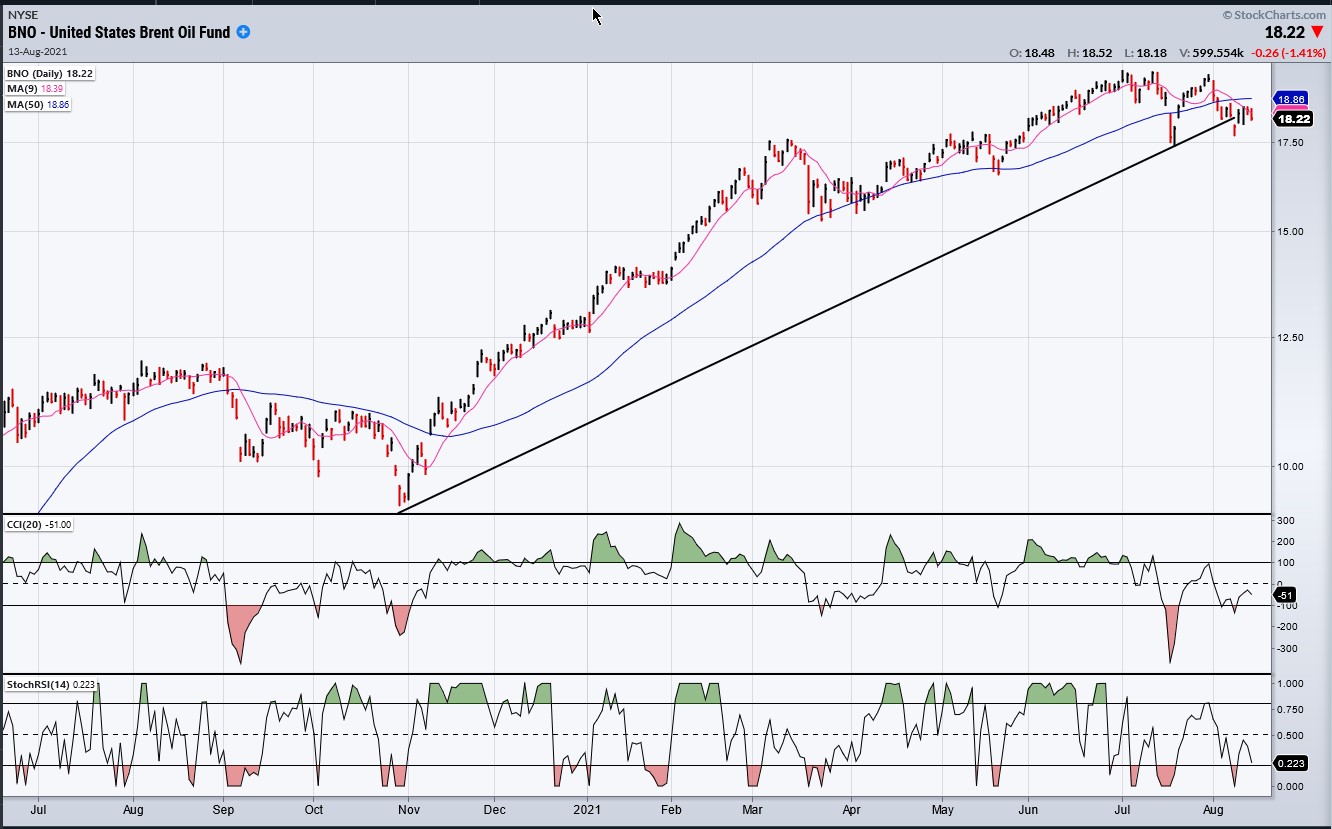
BNO (Brent oil fund) dly
BNO is looking increasingly toppy and will start to correct when it breaks its trend line. This process may already be underway.
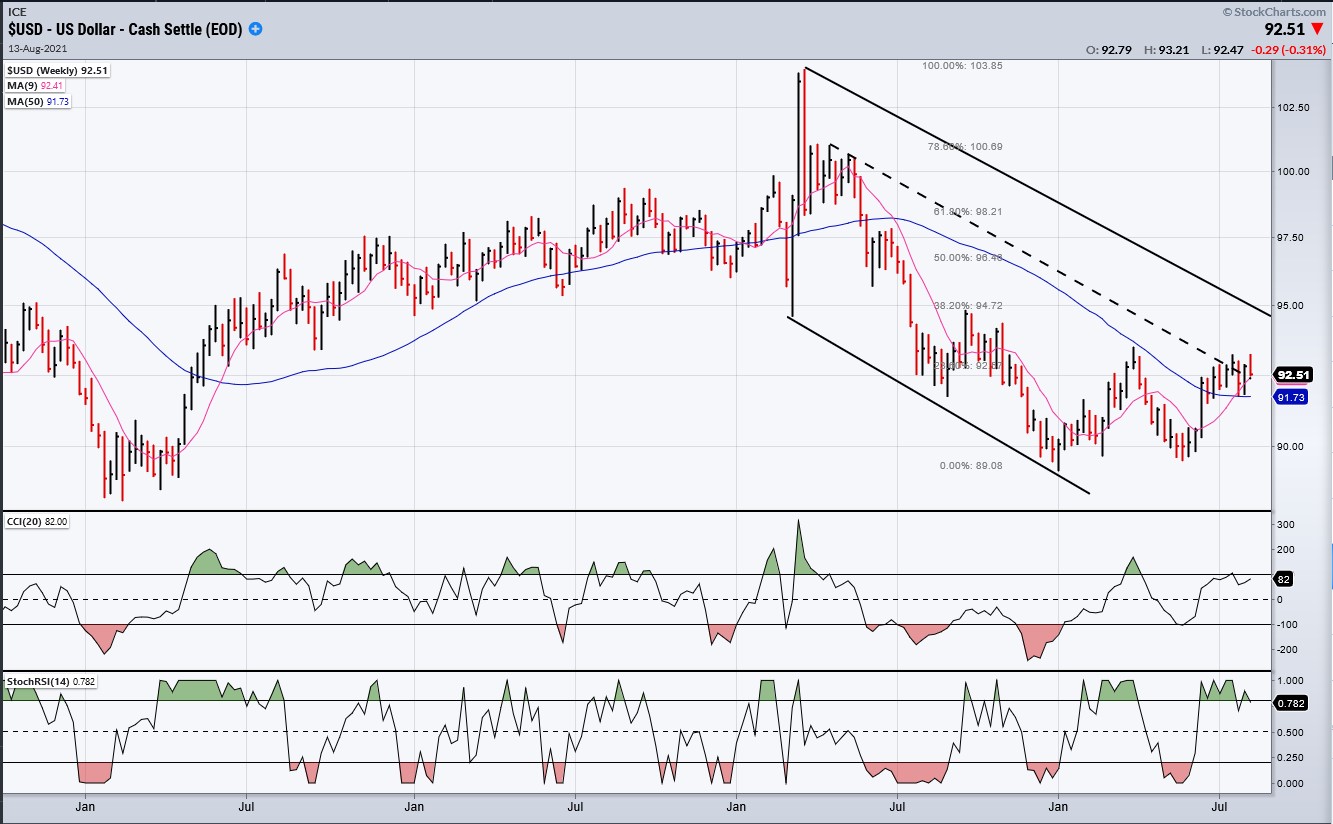
USD (dollar) dly
To move back to its top channel line, USD would have to retrace .382 of its intermediate decline to 95. That could be a challenge…but feasible, so long as it remains above 90!
SUMMARY
This is the strongest warning yet issued by IWM since the beginning of the March 2009 bull market. It should be heeded!
Free trial subscription
With a trial subscription, you will have access to the same information that is given to paid subscribers, but for a limited time-period. Over the years, I have developed an expertise in P&F charting (price projection), cycles (timing), EWT (structure), and general technical analysis which enables me to warn subscribers of pending reversals in market trends, and how far that trend can potentially carry. For a FREE 2-week trial, subscription options, and payment plans I encourage you to visit my website at www.marketurningpoints.com.
The above comments and those made in the daily updates and the Market Summary about the financial markets are based purely on what I consider to be sound technical analysis principles. They represent my own opinion and are not meant to be construed as trading or investment advice but are offered as an analytical point of view which might be of interest to those who follow stock market cycles and technical analysis.
*********
share
share
share
share
share

When Andre Gratian was a stock broker years ago, a friend introduced him to technical analysis of the market. Consequently, it is not an exaggeration to say that Andre fell in love with this approach! Ever since then, it has become an increasingly important part of his professional life. Gratian has studied the works of Wyckoff, Edwards & Magee, Edward J. Dewey (cycles) and many others. However, one of my most profitable undertaking has probably been to study Point & Figure charting, which he finds invaluable in analyzing stocks and indices. If he were restricted to one methodology, this is the one that he would choose. This well-rounded background has given him what he feels to be a special insight into the stock market, facilitating the recognition of meaningful patterns and the ‘turning points’ in all trends, whether they be short or long term. Andre feels very comfortable discussing the stock market and passing on meaningful information to others. His subscribers include individuals and money managers throughout the world. Moreover, his Newsletters are currently published on several financial sites, here and abroad.


