Technical Analysis Of The Markets


Current Position of the Market
SPX Long-term trend: There is some evidence that we are still in the bull market which started in 2009 and which could continue into 2021 until major cycles take over, and it ends. A move up to ~4500 is possible before the current bull market makes a final top and SPX corrects into its next major cycle low due in 2023.
SPX Intermediate trend: SPX correction underway.
Analysis of the short-term trend is done daily with the help of hourly charts. They are important adjuncts to the analysis of daily and weekly charts which determine longer market trends.
Drawing Ever Closer to Final Target?
Cycles: Looking ahead!
7-yr cycle – Last lows: 2009-2016. Next low: ~2023
Market Analysis (Charts, courtesy of StockCharts)
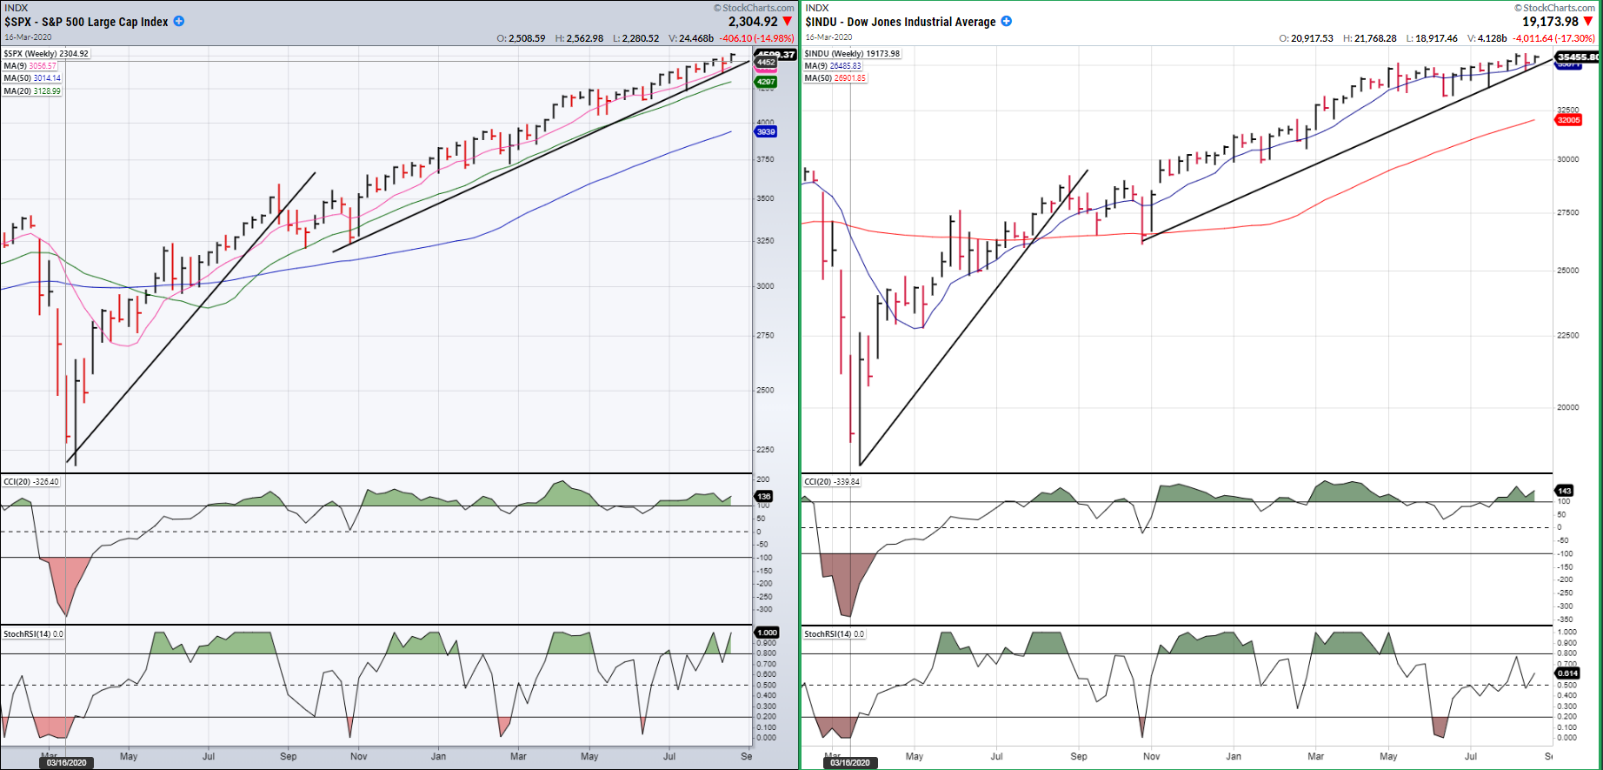
SPX- DJIA Weekly
Viewing the long-term (weekly) charts of SPX and DJIA, both reflect a lot of buying after the March 2020 low, leading to nearly vertical moves in both indexes. After the first intermediate correction, both indices continued upward at a more moderate, but still very bullish uptrend. Over the past ~3 months, SPX continued unabated, but DJIA proceeded at a much more subdued pace -- behavior which tends to suggest a shift in supply/ demand forces preceding a price correction. The continued strength in SPX was primarily due to the latter being affected by continued aggressive buying in the big tech stocks.
Switching our focus to the P&F chart (not shown here), the congestion produced at the March 2020 low gave a projection to 4550. I had expected some intermediate consolidation first at 4310, and then 4440; but if the projection is valid, it looks as if we are going for the full count directly.
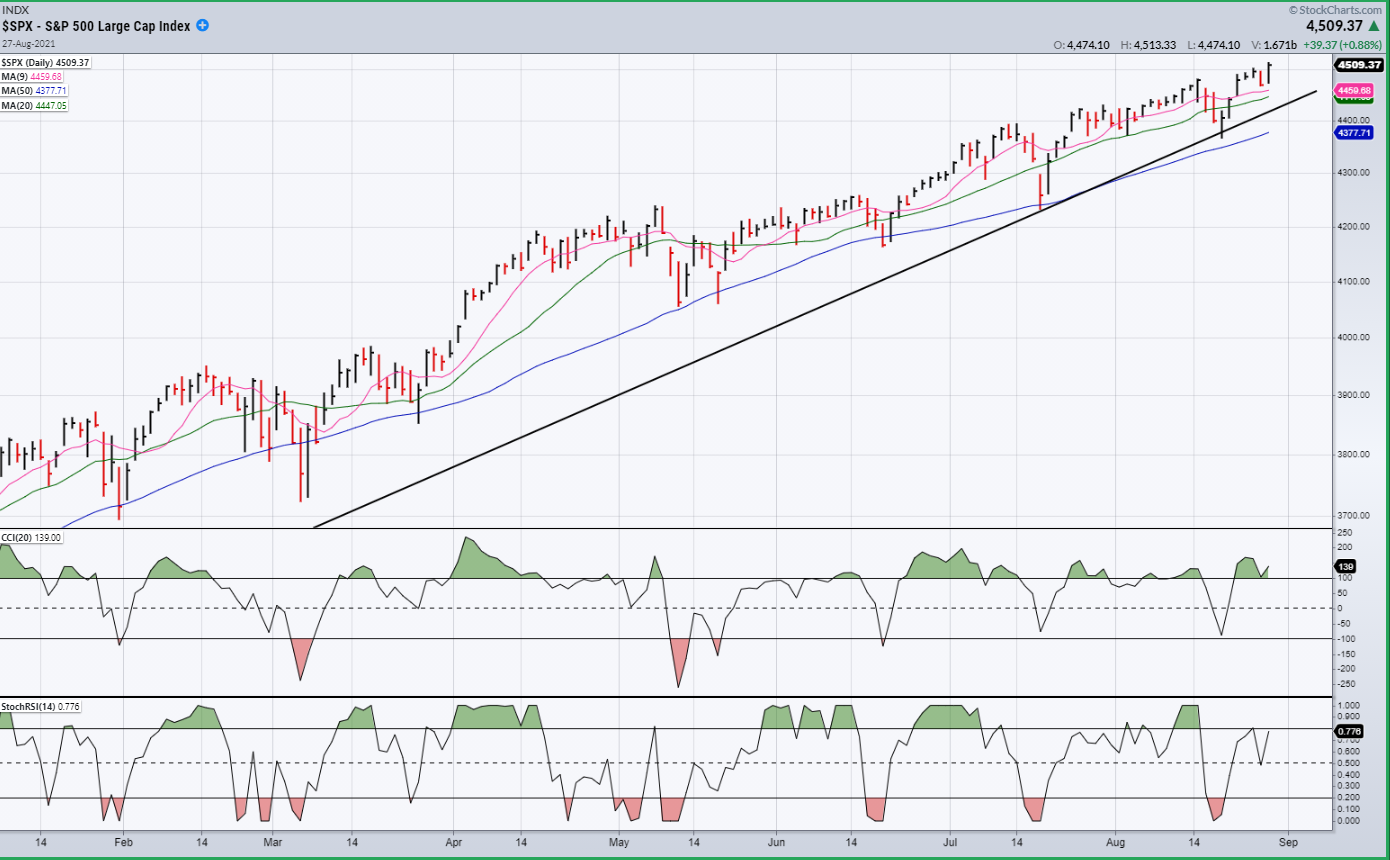
SPX daily chart
A close-up of SPX on the daily chart shows that deceleration occurred at the 4440-4480 level ( most noticeably in the CCI) but the subsequent pullback found support on the trendline and, in conjunction with the bottoming of the short-term cycle, new life was breathed into the index and it was propelled to a new high of 4513.33 on Friday -- probably in a reaction to the speech delivered at the Jackson Hold symposium by Fed chairman Jerome Powell. The anticipation of that speech and what it might contain may also have caused the index to hold the primary trend line. Even the resurgence of covid-19 and its likely consequences for the economy, and the collapse of Afghanistan punctuated by an ISIS-generated suicide attack last week which took the lives of scores of people, were completely ignored!
This continues to be a tough market for analysts to divine, as even speculation of what it might do based on good analytical guestimates over the intermediate term has failed to produce tangible results. But can it logically continue to move higher and higher without a solid correction taking place? Or will the correction come suddenly once the last projection has been met, the last short-term cycle has topped, and the final structure has been completed? I suspect that this is what may take place -- and we may not have much longer to wait!
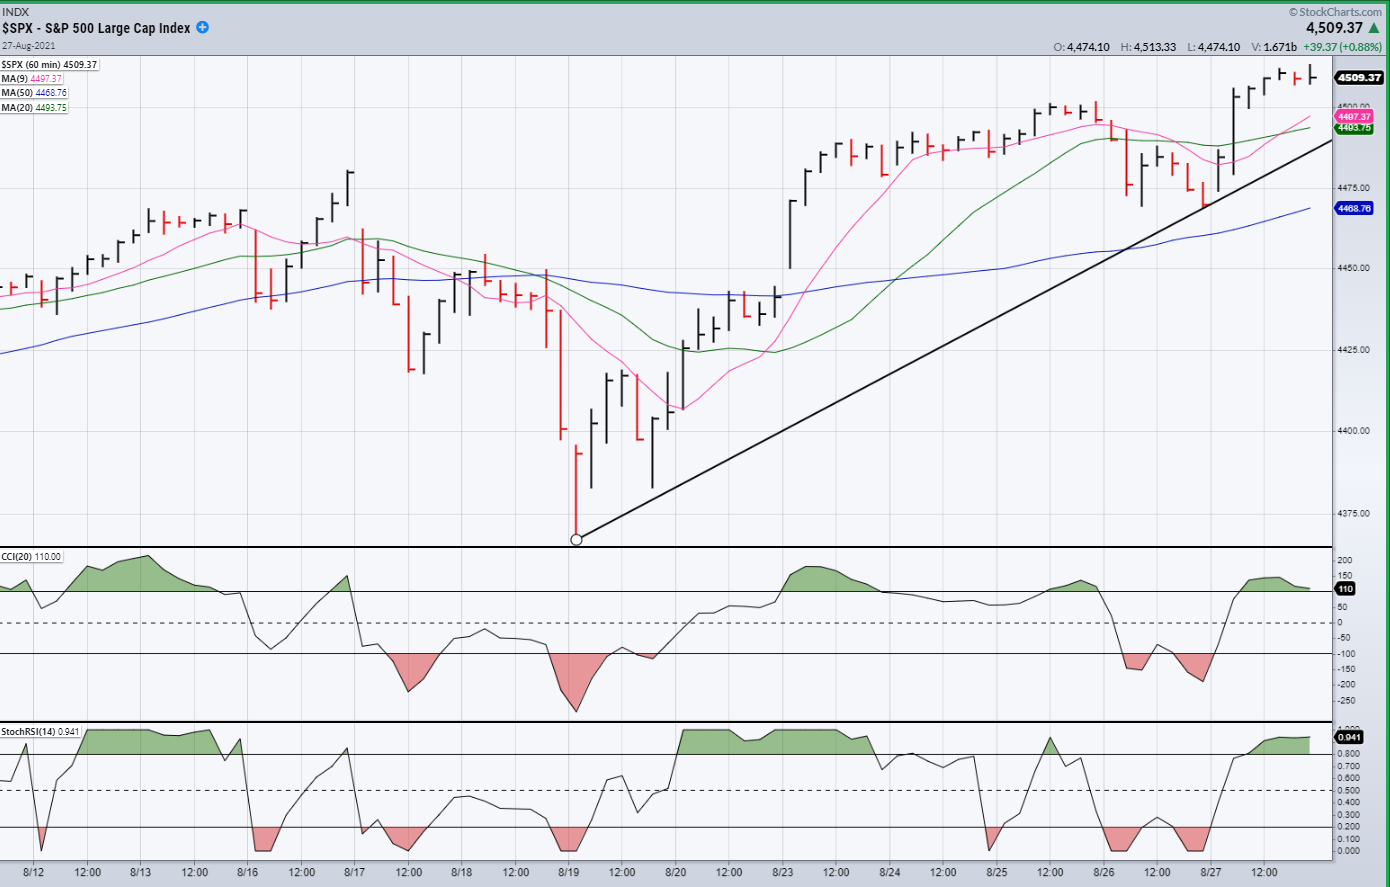
SPX hourly chart
The hourly chart shows the pattern described by the current short-term cycle since it last made its low on 8/19. Sunday will be day 10 of an approximate 26-day pattern for the current short-term cycle. Friday’s strong extension of the uptrend was in response to Jerome Powell’s speech who, as customary, did his best to choose words that would not offend the stock market in describing his view on inflation and current monetary policy. The market obliged with a new high in NDX and SPX -- but not in DJIA! Also, as you can see on the chart, most of the upside momentum occurred early in the session immediately after the speech, followed by a notable deceleration during the rest of the day. This, combined with a frequent dip into the mid-cycle phase, suggests that we could have a couple of downside days…and then what? A final reach for the 4550-target? Let’s just see how it plays out!
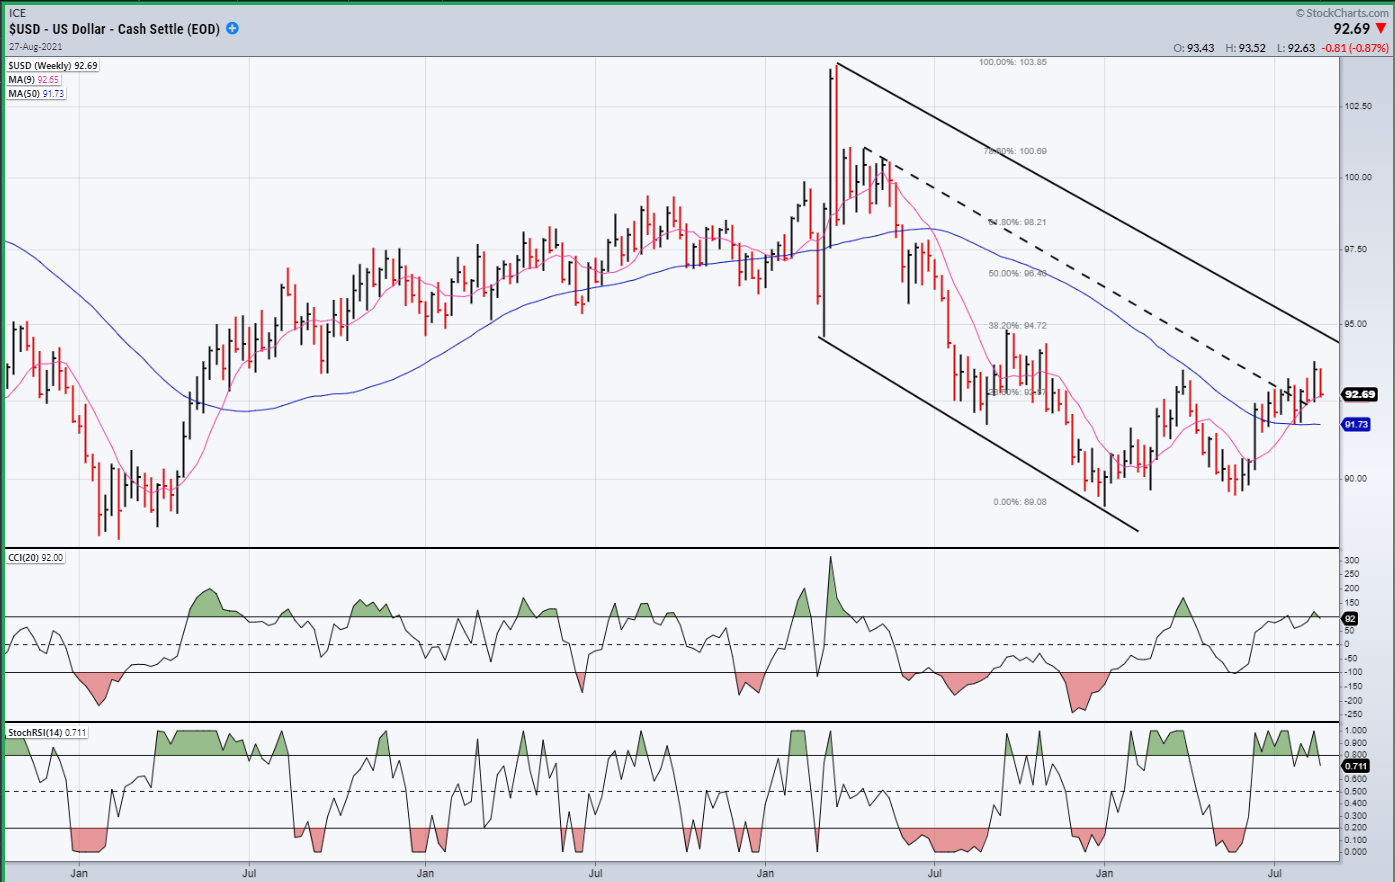
USD (dollar) dly
The dollar appeared to be on its way to the top of its correction channel, but reversed suddenly on Friday, which leads one to wonder if the rally is over. Nothing serious technically is likely to happen until the index closes below its 50-dma.
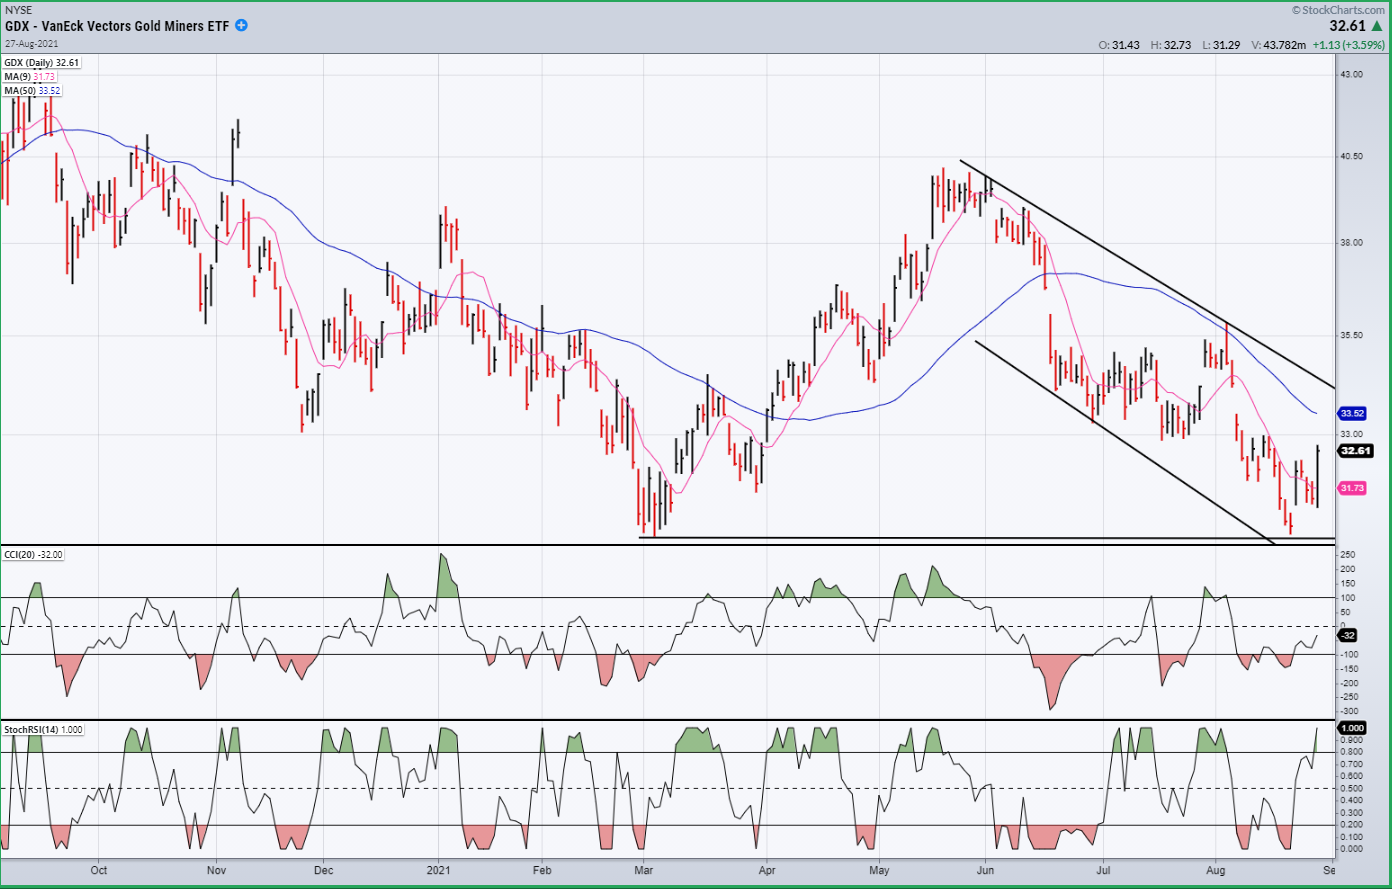
GDX (gold miners) (dly)
GDX is trying to establish a short-term uptrend. Its success will depend on being able to overcome 33.50+.
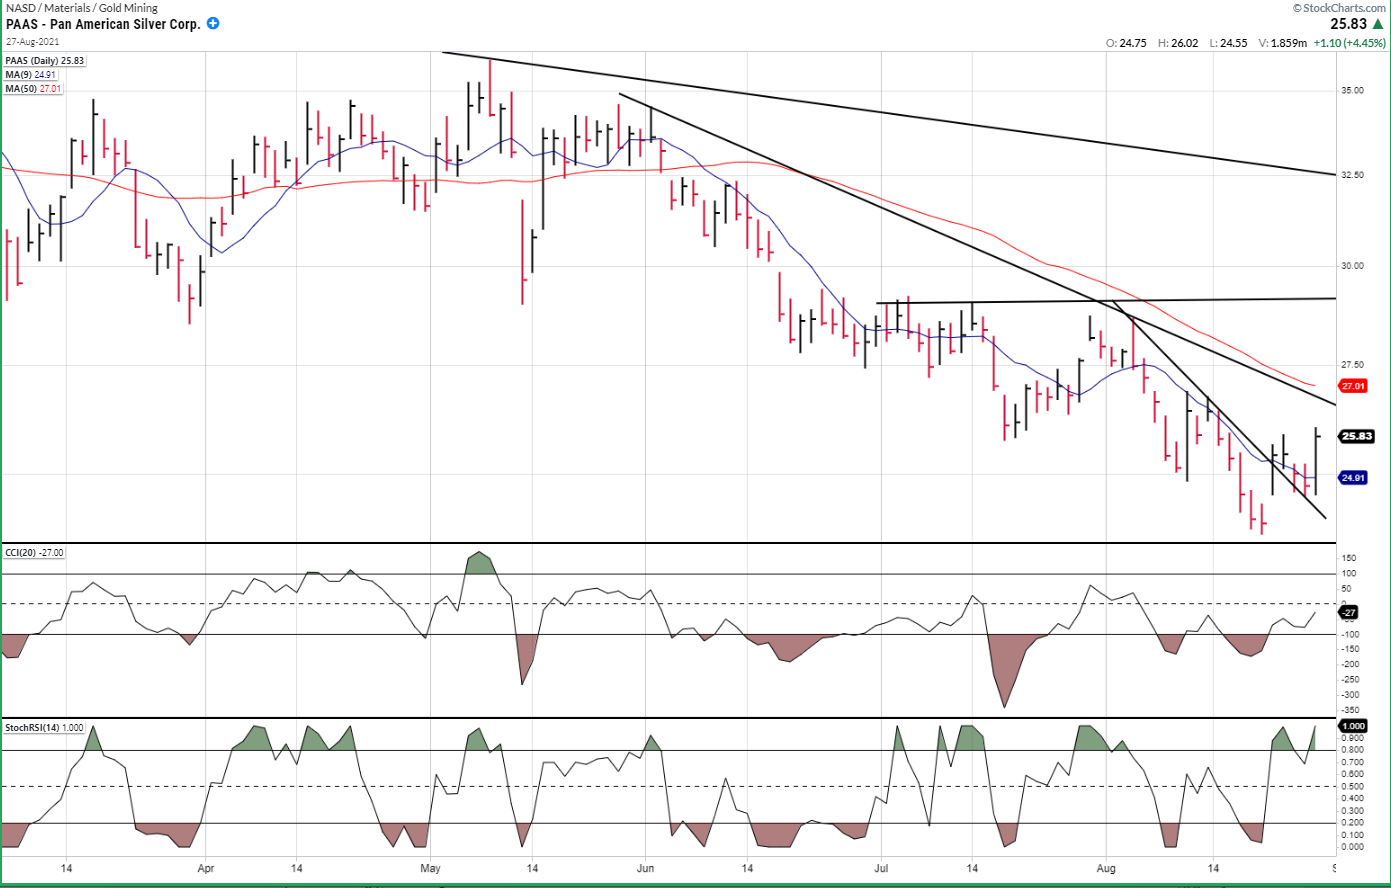
PAAS (dly)
As in GDX, buying in PAAS may have been motivated by the pullback in USD. For the latter, in order to keep going, it’s important that it gets above 27.00
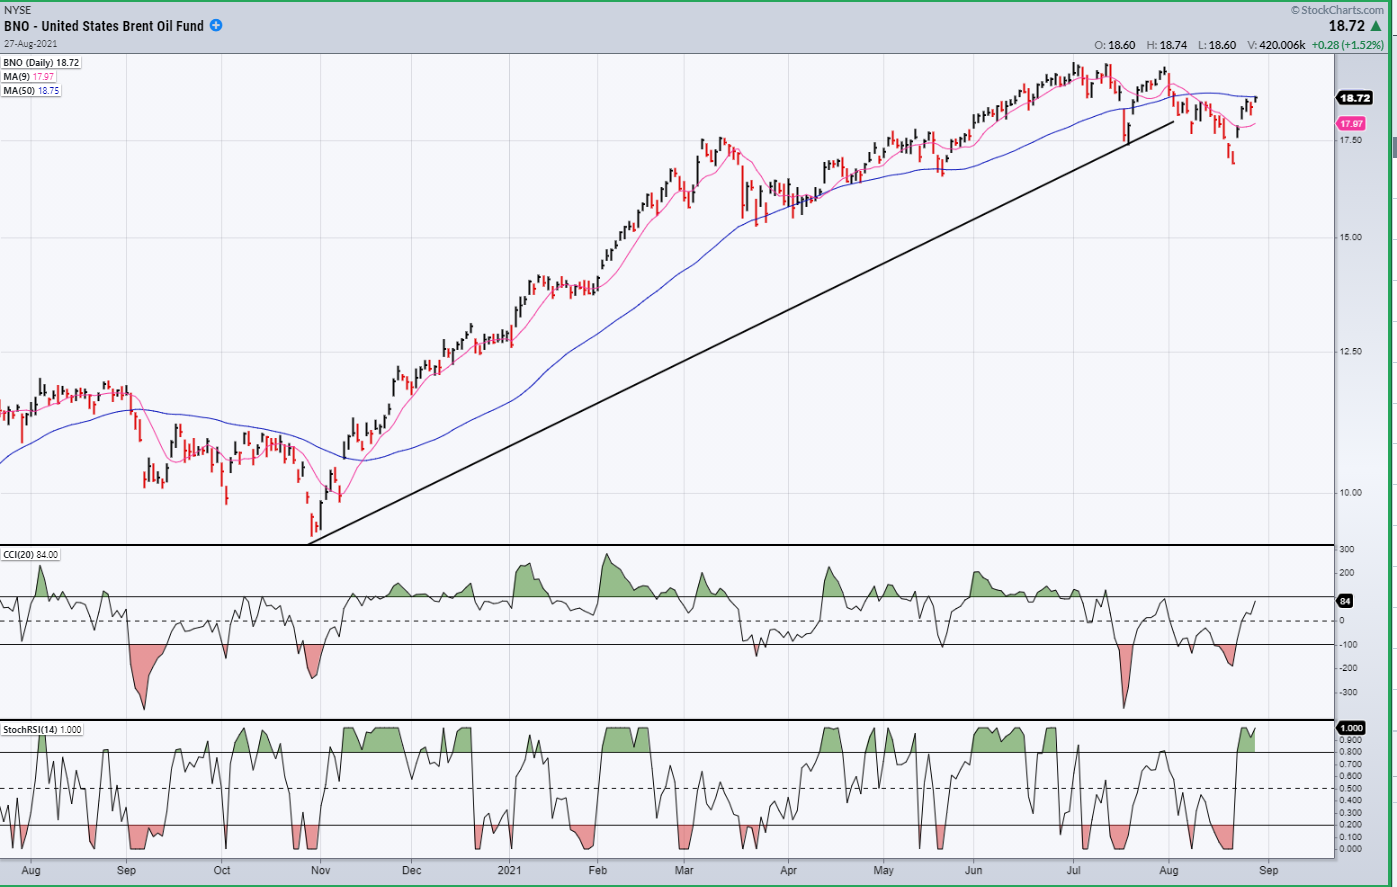
BNO (Brent oil fund) dly
BNO corrected and rallied to its 50-dma. If it cannot get back above it quicky, it should continue to decline to at least 15.00.
SUMMARY
SPX is drawing ever closer to its long-term projection of 4550.
The comments made in the daily updates and the Market Summary about the financial markets are based purely on what I consider to be sound technical analysis principles. They represent my own opinion and are not meant to be construed as trading or investment advice, but are offered as an analytical point of view which might be of interest to those who follow stock market cycles and technical analysis.
********

When Andre Gratian was a stock broker years ago, a friend introduced him to technical analysis of the market. Consequently, it is not an exaggeration to say that Andre fell in love with this approach! Ever since then, it has become an increasingly important part of his professional life. Gratian has studied the works of Wyckoff, Edwards & Magee, Edward J. Dewey (cycles) and many others. However, one of my most profitable undertaking has probably been to study Point & Figure charting, which he finds invaluable in analyzing stocks and indices. If he were restricted to one methodology, this is the one that he would choose. This well-rounded background has given him what he feels to be a special insight into the stock market, facilitating the recognition of meaningful patterns and the ‘turning points’ in all trends, whether they be short or long term. Andre feels very comfortable discussing the stock market and passing on meaningful information to others. His subscribers include individuals and money managers throughout the world. Moreover, his Newsletters are currently published on several financial sites, here and abroad.


