Technical Analysis Of The Markets


Short-Term Update
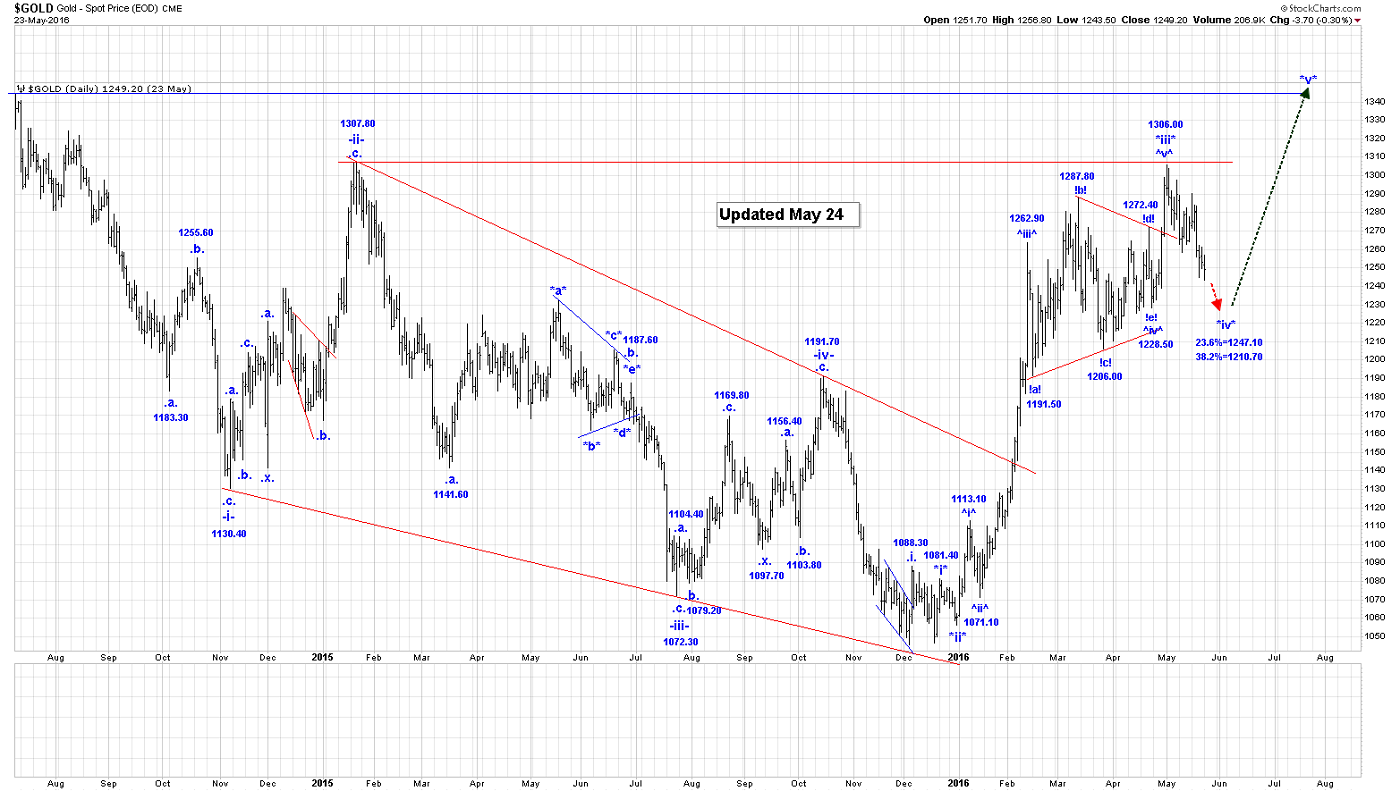
Gold continued to fall in the overnight session as we reached a low of 1240.50, at the time that this Post was being written. Our current analysis:
On the Intraday Chart the drop from the wave *iii* high of 1306 to the current low of 1240.50 is corrective looking and likely still not complete.
It is starting to look like wave *iv* is becoming a double 3 wave corrective pattern.
The first 3 wave pattern ran from 1306.00 to 1258.00. We had a wave !x! rally to 1290.40 and we are now falling in our second 3 wave pattern, which appears incomplete at the current lows. This current drop from the wave !x! high is likely all or most of our second wave !a!.
We suspect that our second wave !b! rally is about to start soon. Upon completion of our second wave !b! we should expect another drop in our second wave !c! to likely complete all of wave *iv*. Of course we can still not rule out the possibility that wave *iv* is going to also become a multi-month bullish triangle.
When wave *iv* is complete we expect another impulsive rally in wave *v* to complete all of wave .iii. Our minimum target for wave *v* is the wave *iii* high of 1306.00, but we should expect a challenge of the 1346ish high, as the likely ending point.
Our retracements for the end of wave *iv* are;
23.6% = 1247.10;
38.2% = 1210.70.
Longer-Term Update
Based on the current count, gold is still working on its first impulsive sequence out of its wave (2) of 3 low, and we still have a little way to before this sequence is complete.
We should now be falling in wave *iv*. We are thinking that all of wave .iii. in our current gold count is going to end at the red trend line shown in the attached Long Term Gold Chart.
The location of that intersection is looking like it could be in the $1340/$1360 area, depending on long it takes for gold to get there.
Active Trading Positions: Long 20 positions, with puts at 1085.00.
Crude
Short-Term Update
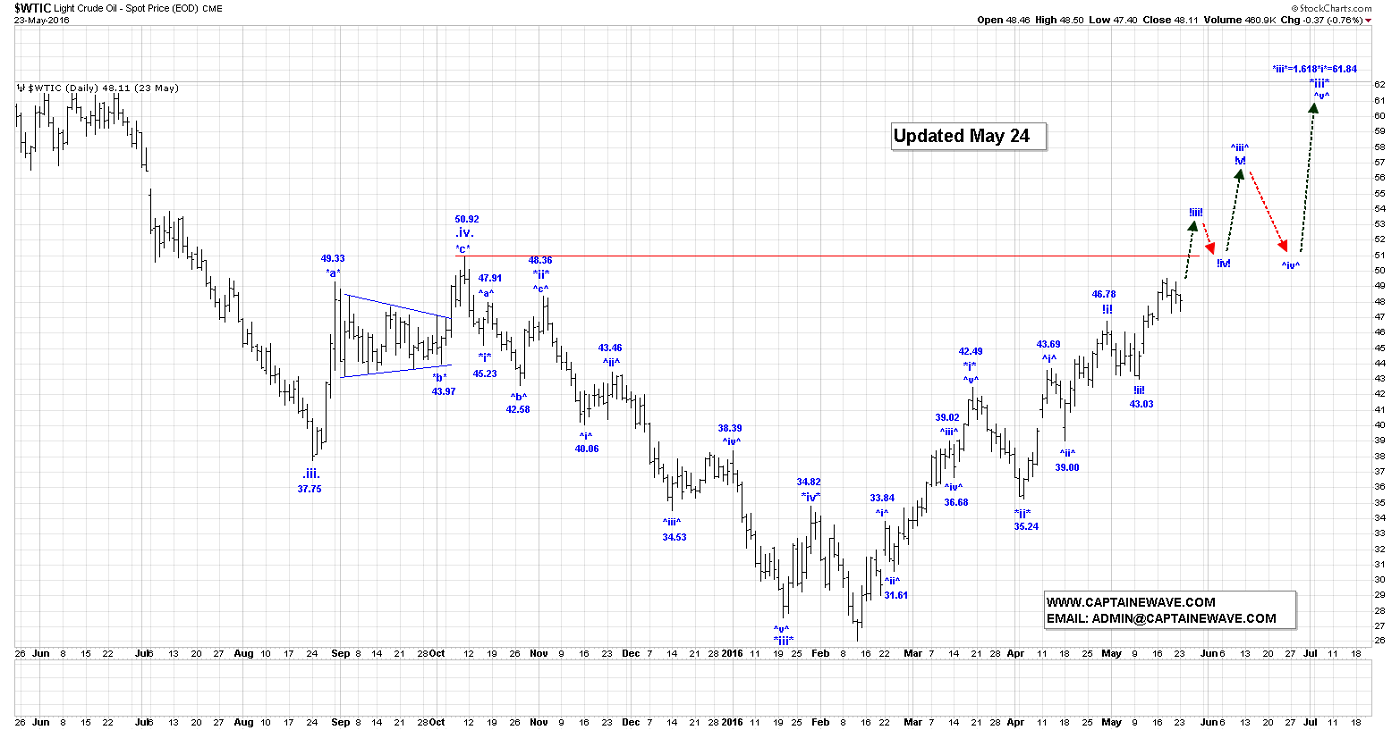
Crude did not accomplish very much in the overnight session as yesterday’s day session low of 47.41 was not challenged. In the overnight session crude reached a high of 48.27, at the time that this Post was being written. No real change to our current analysis.
We still expect further upside in wave !iii! of ^iii^ and see a run to the $52.00 area as being very achievable, although we have a higher projected target at 55.62.
Our current count is:
^i^ = 43.69;
^ii^ = 39.00;
^iii^:
!i! = 46.78;
!ii! = 43.04;
!iii! rally is now underway. Our first projection for the end of wave !iii! is: !iii! = 1.618!i! = 55.62
Projections for the end of all of wave ^iii^ are:
^iii^ = 1.618^i^ = 52.67;
^iii^ = 2.618^i^ = 61.11.
Our first projection for the end of wave *iii* is:
*iii* = 1.618*i* = 61.84.
No change to our Suncor analysis as we expect all or most of wave .b. is complete at the 27.50 high, and that we should see one more drop in wave .c. to at least the wave .a. low of 25.31, but more likely to our retracement levels, before all of wave -ii- ends. Retracement levels for all of wave -ii are:
50% =24.31;
61.8% = 22.98
We will go long Suncor at 23.75.
Long-Term Update
We are now working on the assumption that a major low in wave b of B was reached at the 26.05 low. If this assumption is correct, then crude is now heading sharply higher, at least back to the all-time high of 147.27.
Active Trading Positions: We are long 42.50, risking to 38.99, and also will buy Suncor at 23.75.
S&P500
Short-Term Update
The S&P Futures are up about 9 points in the overnight session, at the time that this Post was being written.
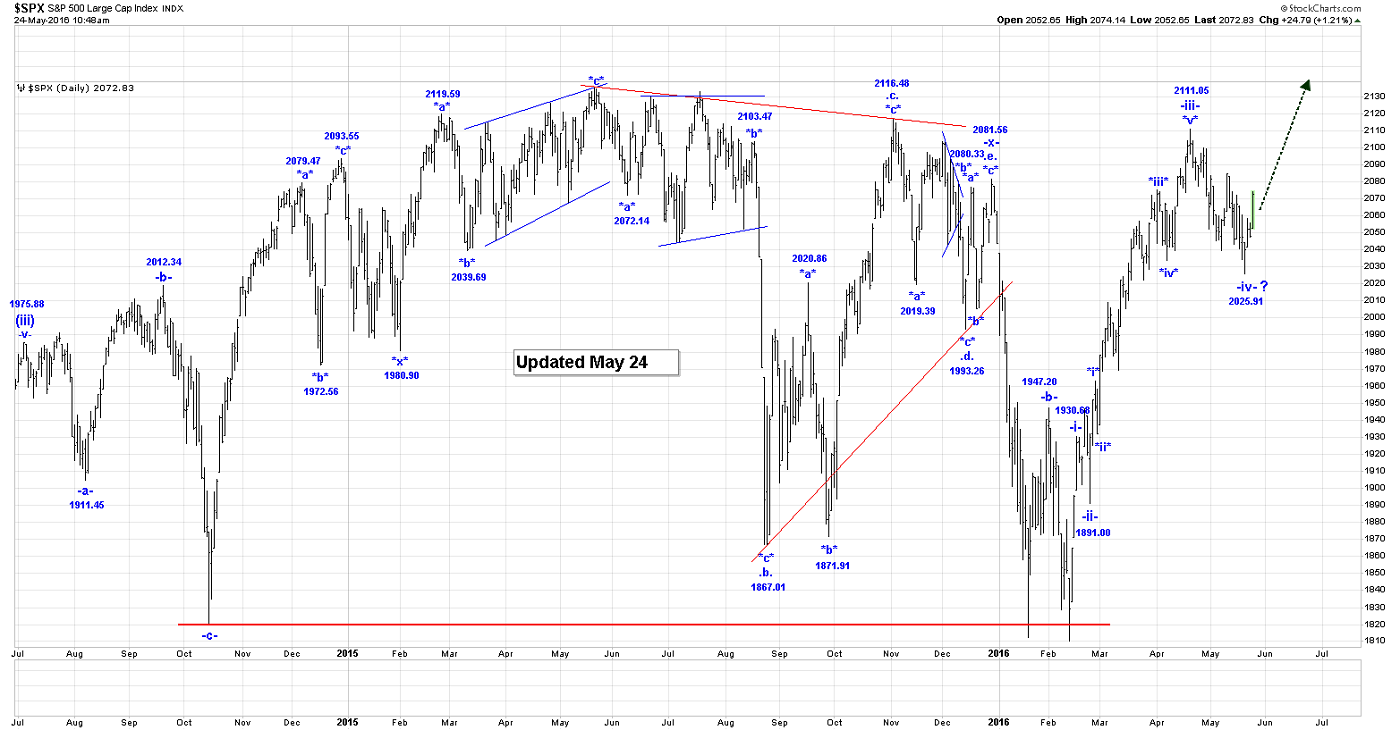
We are starting to like the idea that all of wave -iv- is now complete at the 2025.91 low and that we are now starting wave -v- higher to all time new highs. We will give this market a couple more days to confirm that thinking.
We cannot fully rule out the idea that wave -iv- is going to take much longer to develop and could become a bullish triangle that will take all summer to unfold.
Our expected retracements levels for all of wave -iv- are as follows:
23.6% = 2057.41;
38.2% = 2025.61.
Long-Term Update
Wave -i- of (v) is complete at the 1946.70 high; wave -ii- at 1891.00, and wave -iii- at 2111.05. Wave -iv- could now be complete at the 2039.45 low, but we need to be on guard for something more complex happening in this corrective wave, before we are ready to confirm its completion.
Our minimum target for the end of wave (v) is the all-time high of 2134.72.
Upon completion of wave -iv, we expect a wave -v- rally to complete all of wave (v) and a major top in the S&P.
Active Trading Positions: Flat.
USDX
Short-Term Update
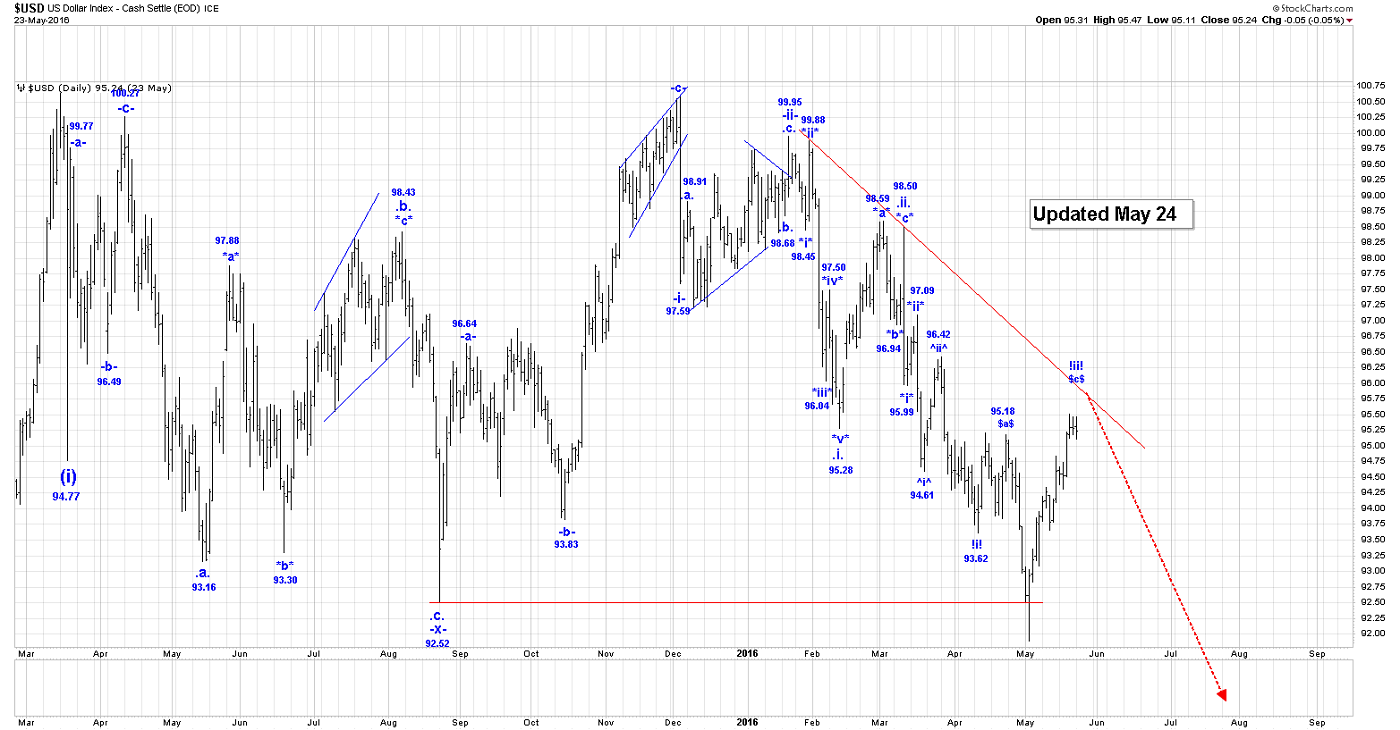
The USDX made a marginal new high for the rally, reaching 94.54, at the time that this Post was being written. No change to our current analysis as we are looking to short this market at higher levels.
As you can see on the Daily USDX Chart, we have updated our count to show a complex wave !ii! correction, that appears to be nearly complete. We suspect that we have some further gains which should take us to the red downtrend line shown on that Chart.
This top should be all of wave !ii!. For this count to remain valid we cannot trade above the wave ^ii^ high of 96.42. Also, a break and close above the red downtrend line would be disturbing development.
Upon completion of wave !ii! we expect a very sharp drop in wave !iii!, as the next big event in this market.
We will short this market at 96.00, risking to 96.43.
Long-Term Trading Update
We have struggling with our longer term count on the USDX, but continue to believe that gold has made major bottom and that it is now rallying to new all-time highs in the years ahead. If this is assumed to be correct, then we do not see how the USDX can rally back to its highs around the 101 level.
Active Trading Positions: Will short at 96.00 risking to 96.43.
HUI/GDX and Selected Gold Stocks:
Short-Term Update
With gold being weaker we expect more weakness in the GDX and our selected gold stocks today, and likely for the remainder of this week.
We expect that the corrections in the GDX and our selected gold stocks should reach our targets before their respective corrections end.
GDX
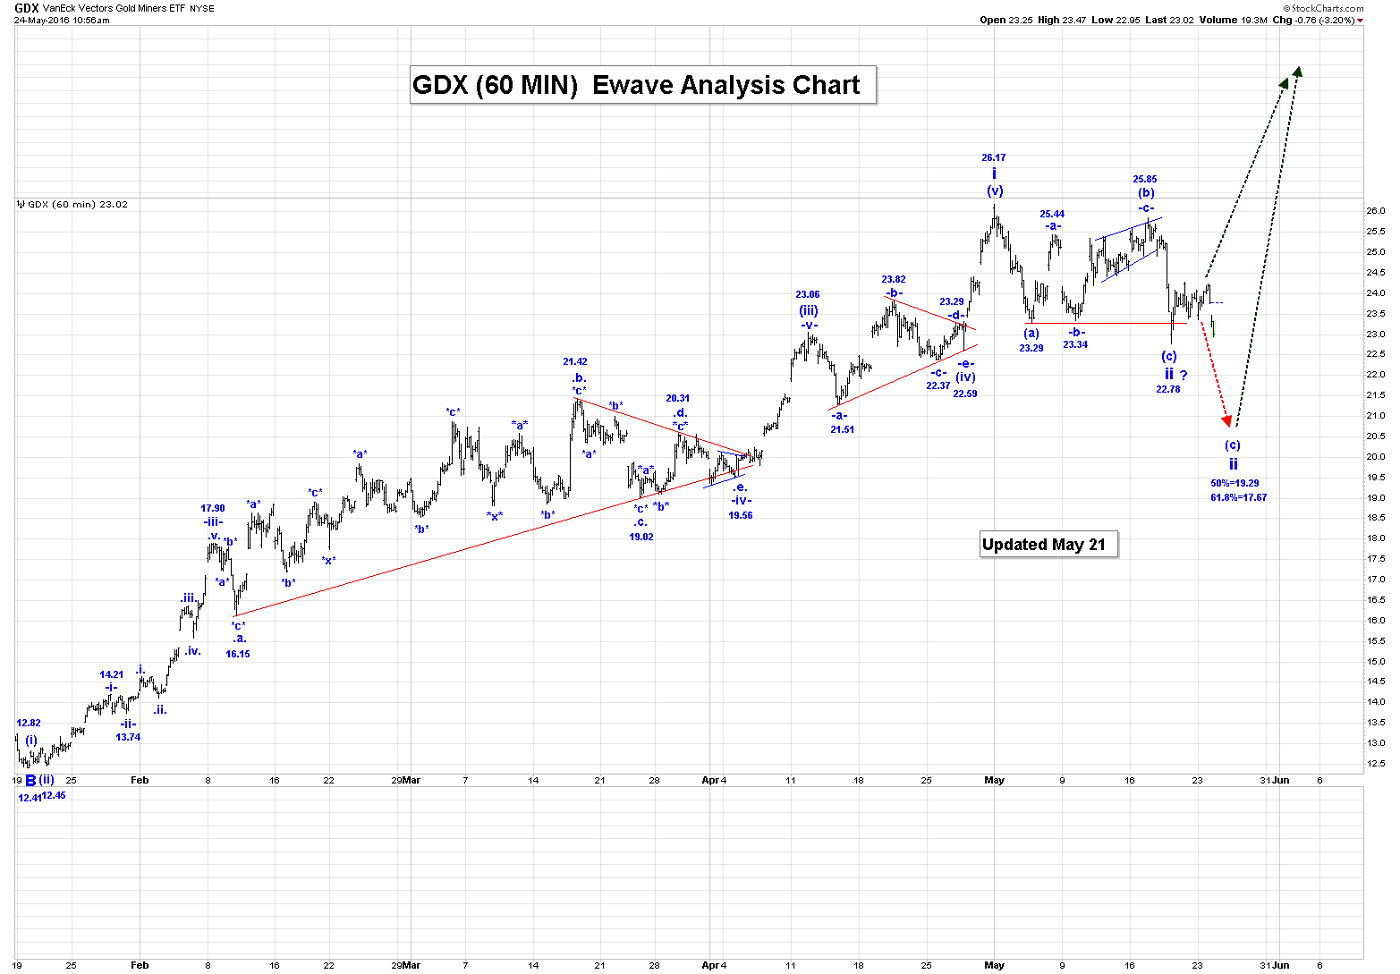
As you can see on the 60 Min GDX Chart, we have now satisfied the minimum requirements, from an EWaves point of view, that all of wave ii is now complete at the 22.78 low. This is because wave (c) traded below wave (a).
What is still outstanding is that wave ii is still above our 50% retracement level which is 19.29. We will work on the assumption that wave *iv* in gold is still not complete, so we expect further downside in wave (c). Our current count for all of wave ii is:
(a) = 23.29;
(b) = 25.85;
(c) = 22.78, if complete, to complete all of wave ii.
ABX
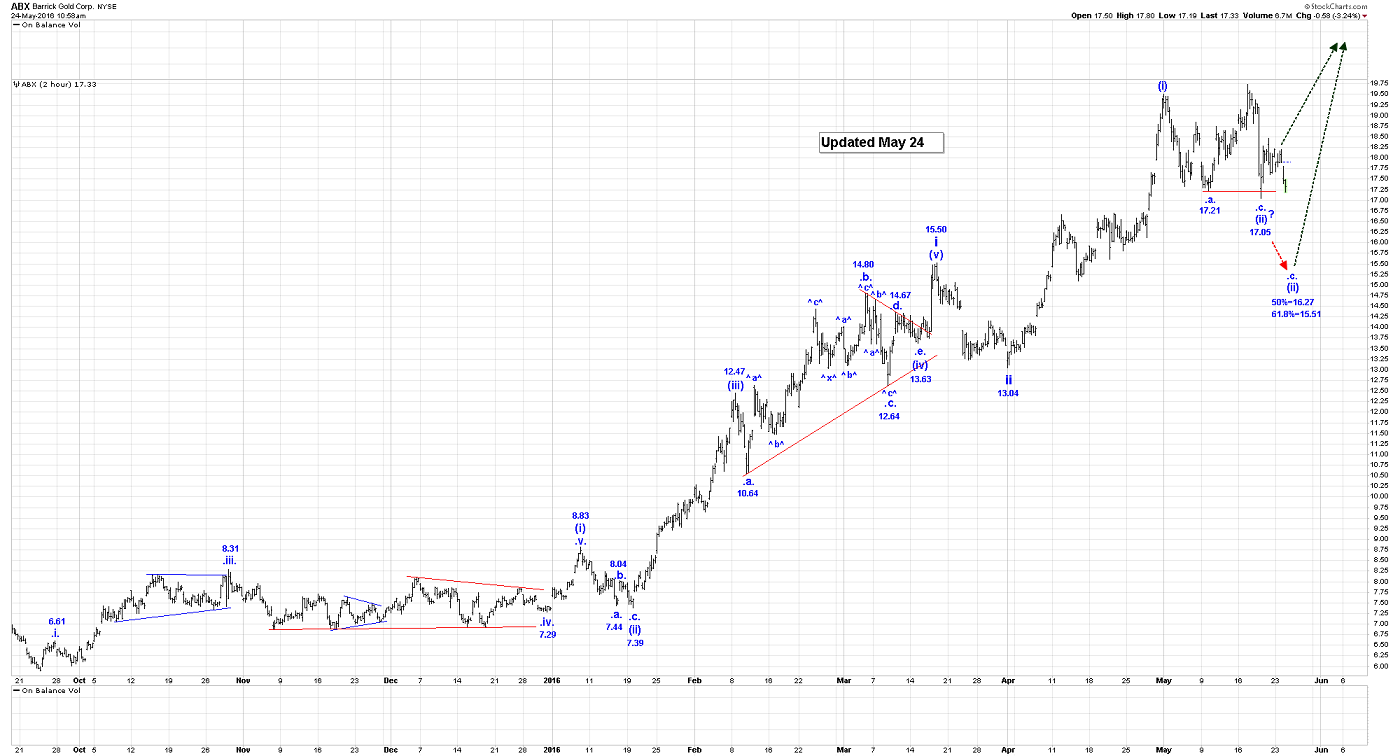
As you can see on the 120 Min ABX Chart, we have now satisfied the minimum requirements from an EWaves point of view that all of wave (ii) is now complete at the 17.05 low. This is because wave .c. traded below wave .a..
What is still outstanding is that wave (ii) is still above our 50% retracement level which is 16.27. Using the same logic as we did for the GDX, we are assuming that wave .c. and wave (ii) are NOT complete at the current low of 17.05, and expect a drop into our retracement zone. Our count for all of wave (ii) is:
.a. = 17.21;
.b. = 19.73,;
.c. = 17.05, if complete, to complete all of wave (ii) of iii.
KGC
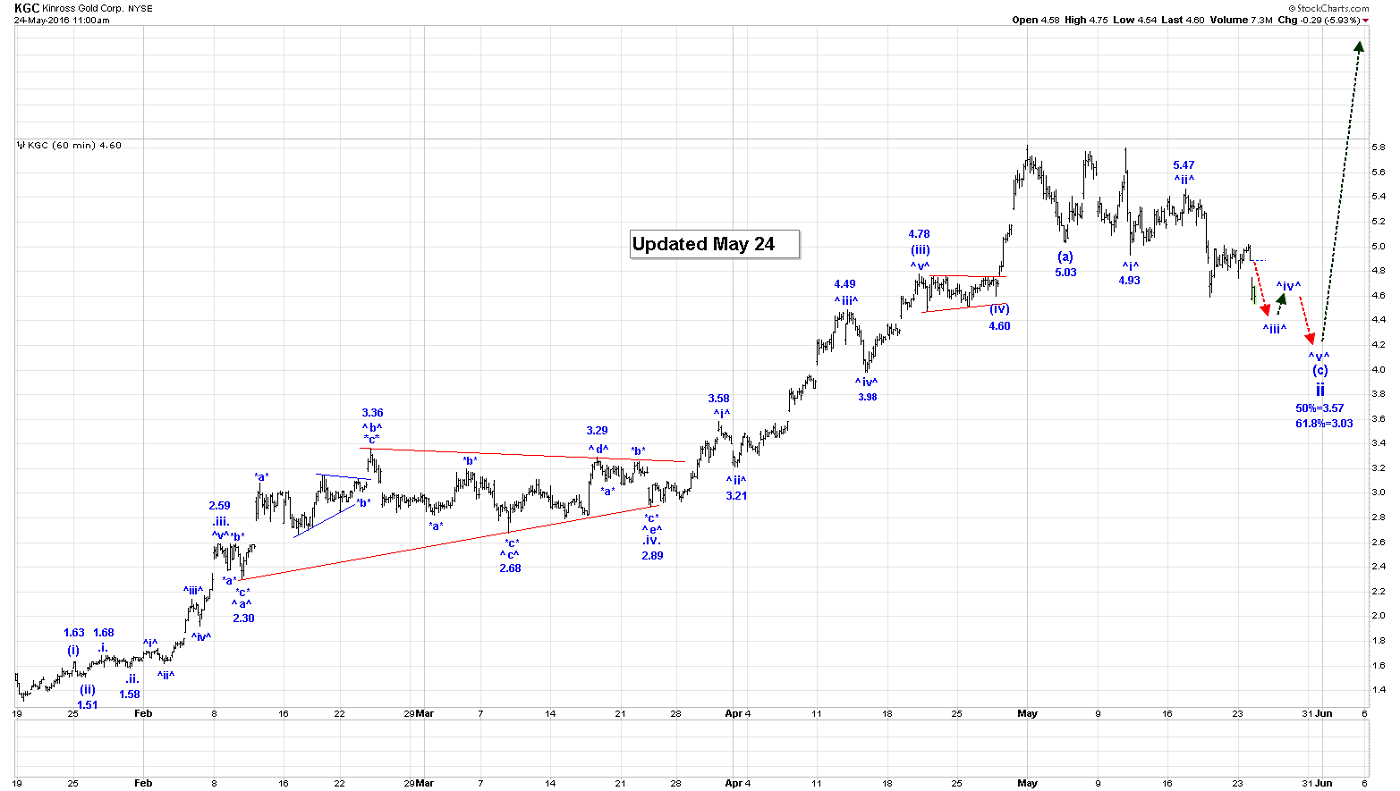
As you can see on the 60 Min KGC Chart, it looks like wave ^ii^ of (c) is complete at the 5.47 high and that we are now falling in wave ^iii^ of (c). Our current count for all of wave ii is:
(a) = 5.03;
(b) = 5.80;
(c):
^i^ = 4.93
^ii^ = 5.47;
^iii^ drop is now underway, and not complete.
^iv^ rally is next after wave ^iii^ ends.
Long-Term Update
Our first impulsive sequence out of wave B lows of the GDX and our selected gold stocks, is likely now complete at the current highs and we are correcting in wave ii, except in ABX, which will be correcting in wave (ii) of iii.
Active Trading Positions: We are long the GDX, ABX, KGC, NEM, CRJ, and TSX:XGD with no stops!
********
Free Trades Offer For Gold-Eagle Readers Send me an email to [email protected] and I’ll send you my next couple short term ewave trades for free!
Email: [email protected]
Website: www.captainewave.com
Risk: CAPTAINEWAVE.COM IS AN IMPERSONAL ADVISORY SERVICE. AND THEREFORE, NO CONSIDERATION CAN OR IS MADE TOWARD YOUR FINANCIAL CIRCUMSTANCES. ALL MATERIAL PRESENTED WITHIN CAPTAINEWAVE.COM IS NOT TO BE REGARDED AS INVESTMENT ADVICE, BUT FOR GENERAL INFORMATIONAL PURPOSES ONLY. TRADING STOCKS DOES INVOLVE RISK, SO CAUTION MUST ALWAYS BE UTILIZED. WE CANNOT GUARANTEE PROFITS OR FREEDOM FROM LOSS. YOU ASSUME THE ENTIRE COST AND RISK OF ANY TRADING YOU CHOOSE TO UNDERTAKE. YOU ALSO AGREE TO BEAR COMPLETE RESPONSIBILITY FOR YOUR INVESTMENT RESEARCH AND DECISIONS AND ACKNOWLEDGE THAT CAPTAINEWAVE.COM HAS NOT AND WILL NOT MAKE ANY SPECIFIC RECOMMENDATIONS OR GIVE ADVICE TO YOU OR ANY OF ITS CLIENTS UPON WHICH THEY SHOULD RELY. CAPTAINEWAVE.COM SUGGESTS THAT THE CLIENT/MEMBER TEST ALL INFORMATION AND TRADING METHODOLOGIES PROVIDED AT OUR SITE THROUGH PAPER TRADING OR SOME OTHER FORM OF TESTING. CAPTAINEWAVE.COM, ITS OWNERS, OR ITS REPRESENTATIVES ARE NOT REGISTERED AS SECURITIES BROKER-DEALERS OR INVESTMENT ADVISORS EITHER WITH THE U.S. SECURITIES AND EXCHANGE COMMISSION OR WITH ANY STATE SECURITIES REGULATORY AUTHORITY. WE RECOMMEND CONSULTING WITH A REGISTERED INVESTMENT ADVISOR, BROKER-DEALER, AND/OR FINANCIAL ADVISOR. IF YOU CHOOSE TO INVEST WITH OR WITHOUT SEEKING ADVICE FROM SUCH AN ADVISOR OR ENTITY, THEN ANY CONSEQUENCES RESULTING FROM YOUR INVESTMENTS ARE YOUR SOLE RESPONSIBILITY.
ALL INFORMATION POSTED IS BELIEVED TO COME FROM RELIABLE SOURCES. CAPTAINEWAVE.COM DOES NOT WARRANT THE ACCURACY, CORRECTNESS, OR COMPLETENESS OF INFORMATION AVAILABLE FROM ITS SERVICE AND THEREFORE WILL NOT BE LIABLE FOR ANY LOSS INCURRED. DUE TO THE ELECTRONIC NATURE OF THE INTERNET, THE CAPTAINEWAVE.COM WEBSITE, ITS E-MAIL & DISTRIBUTION SERVICES AND ANY OTHER SUCH "ALERTS" COULD FAIL AT ANY GIVEN TIME. CAPTAINEWAVE.COM WILL NOT BE RESPONSIBLE FOR UNAVAILABILITY OF USE OF ITS WEBSITE, NOR UNDELIVERED E-MAILS, OR "ALERTS" DUE TO INTERNET BANDWIDTH PROBLEMS, EQUIPMENT FAILURE, OR ACTS OF GOD. CAPTAINEWAVE.COM DOES NOT WARRANT THAT THE TRANSMISSION OF E-MAILS, OR ANY "ALERT" WILL BE UNINTERRUPTED OR ERROR-FREE. CAPTAINEWAVE.COM WILL NOT BE LIABLE FOR THE ACTS OR OMISSIONS OF ANY THIRD PARTY WITH REGARDS TO CAPTAINEWAVE.COM DELAY OR NON-DELIVERY OF THE CAPTAINEWAVE.COM NIGHTLY EMAILS OR "ALERTS". FURTHER, WE DO NOT RECEIVE ANY FORM OF PAYMENT OR OTHER COMPENSATION FOR PUBLISHING INFORMATION, NEWS, RESEARCH OR ANY OTHER MATERIAL CONCERNING ANY SECURITIES ON OUR SITE OR PUBLISH ANY INFORMATION ON OUR SITE THAT IS INTENDED TO AFFECT OR INFLUENCE THE VALUE OF SECURITIES.
THERE IS NO GUARANTEE PAST PERFORMANCE WILL BE INDICATIVE OF FUTURE RESULTS. NO ASSURANCE CAN BE GIVEN THAT THE RECOMMENDATIONS OF CAPTAINEWAVE.COM WILL BE PROFITABLE OR WILL NOT BE SUBJECT TO LOSSES. ALL CLIENTS SHOULD UNDERSTAND THAT THE RESULTS OF A PARTICULAR PERIOD WILL NOT NECESSARILY BE INDICATIVE OF RESULTS IN FUTURE PERIODS. THE RESULTS LISTED AT THIS WEBSITE ARE BASED ON HYPOTHETICAL TRADES. PLAINLY SPEAKING, THESE TRADES WERE NOT ACTUALLY EXECUTED. HYPOTHETICAL OR SIMULATED PERFORMANCE RESULTS HAVE CERTAIN INHERENT LIMITATIONS. UNLIKE AN ACTUAL PERFORMANCE RECORD, SIMULATED TRADES DO NOT REPRESENT ACTUAL TRADING. ALSO, SINCE THE TRADES HAVE NOT ACTUALLY BEEN EXECUTED, THE RESULTS MAY HAVE OVER OR UNDER COMPENSATED FOR THE IMPACT, IF ANY, OF CERTAIN MARKET FACTORS SUCH AS LACK OF LIQUIDITY. YOU MAY HAVE DONE BETTER OR WORSE THAN THE RESULTS PORTRAYED. NO REPRESENTATION IS BEING MADE THAT ANY ACCOUNT WILL OR IS LIKELY TO ACHIEVE PROFITS OR LOSSES SIMILAR TO THOSE SHOWN. NO INDEPENDENT PARTY HAS AUDITED THE HYPOTHETICAL PERFORMANCE CONTAINED AT THIS WEBSITE, NOR HAS ANY INDEPENDENT PARTY UNDERTAKEN TO CONFIRM THAT THEY REFLECT THE TRADING METHOD UNDER THE ASSUMPTIONS OR CONDITIONS SPECIFIED HEREAFTER. WHILE THE RESULTS PRESENTED AT THIS WEBSITE ARE BASED UPON CERTAIN ASSUMPTIONS BELIEVED TO REFLECT ACTUAL TRADING CONDITIONS, THESE ASSUMPTIONS MAY NOT INCLUDE ALL VARIABLES THAT WILL AFFECT, OR HAVE IN THE PAST AFFECTED, THE EXECUTION OF TRADES INDICATED BY CAPTAINEWAVE.COM. THE HYPOTHETICAL RESULTS ON THIS WEBSITE ARE BASED ON THE ASSUMPTION THAT THE CLIENT BUY AND SELLS THE POSITIONS AT THE OPEN PRICE OF THE STOCK. THE SIMULATION ASSUMES PURCHASE AND SALE PRICES BELIEVED TO BE ATTAINABLE. IN ACTUAL TRADING, PRICES RECEIVED MAY OR MAY NOT BE THE SAME AS THE ASSUMED ORDER PRICES.
More from Gold-Eagle


