Technical Analysis Of The Markets


SPX Long-term trend: A lengthy correction is most likely underway!
SPX Intermediate trend: The H&S pattern has been invalidated and the index is re-testing the upper portion of its trading range.
Analysis of the short-term trend is done on a daily basis with the help of hourly charts. It is an important adjunct to the analysis of daily and weekly charts which discuss longer market trends.
RE-TESTING OVERHEAD RESISTANCE
Market Overview
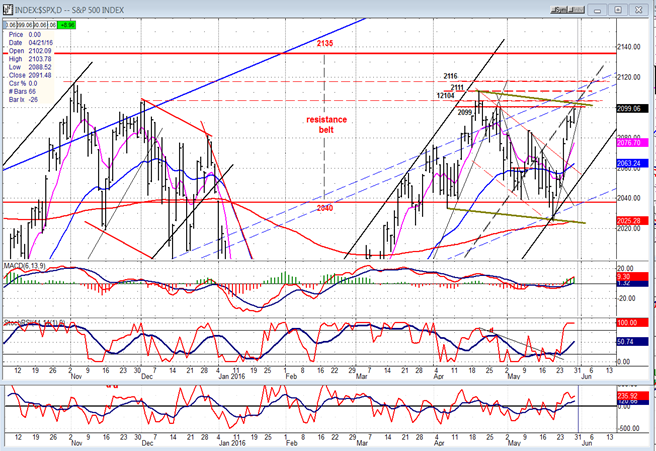
SPX has been trading within a resistance belt which extends from 2040 to 2135 for about a year and a half, except for a couple of severe forays below it. Two serious breaks below it occurred in August 2015 and in January 2016 which reached down to about 1810, followed by a less severe penetration to the 2026 level, recently. All these gave birth to a rally which rose to challenge the top of the band unsuccessfully. Are we repeating the pattern once again, or will we go through and make a new high this time?
Since October 2014, we have traded within an even wider range extending to the lower 1800s. Consequently, it is inappropriate to say that the SPX is in a bear market. It is more correct to say that the bull market which started in 2009 has been undergoing a massive correction which will not be over until we surpass the 5/15 high of 2135. Is this what we are attempting to do currently, or is it still months away with much lower prices in store first? We should soon find out!
Nadeem Walayat, founder of The Market Oracle financial site, is one of the market bulls which expects oil prices to continue to increase for a while and take the SPX to a new high! (You can read his recent article on www.marketoracle.co.uk ). He could be right, but my overview of various market leaders, which appears a little later on, suggests otherwise although I suppose that SPX could make a marginal new high and then retrace immediately. It would put an end to the long-standing debate between EW followers about whether or not the bull market has already evolved in 5 waves, or if the 5th wave is currently underway.
My argument against a new high is that the level of distribution which occurred at the market top produced a count on the P&F chart which has not been filled in its entirety. Moreover, the rally in oil is, most likely, nearly over (see USO below) and will be followed by a base-building process which could take some time to complete. Of course, when analyzing the market, we can only arrive at probable outcomes, not certainties. Eventually, the market itself will have to prove whether or not the analysis is correct.
SPX Chart Analysis
Daily Chart (This chart, and others below, are courtesy of QCharts.com.)
The daily chart of SPX shows why the index could have a tough slog trying to move much higher. But first, let’s see why it made a short-term low where it did. First of all, although it dipped below 2040 on a daily basis, it could not close below but rallied to close right on it at the end of that day and pushed higher on the following day. Next, at the low, it touched the lower channel line of the uptrend from 1810. This created support that was reinforced by a parallel trend line to the intermediate blue channel (going back to 10/11) which was drawn across the October 2015 low, and which happened to cross precisely at the same level. Finally, there was a short-term projection to 2025. All these conspired to create a good support level around which the bulls rallied.
Now for the resistance! On Friday, after two days of moving sideways, the index finally crawled out of a small consolidation level and closed at 2098.63. There are several former short-term peaks just above which could put an end to the rallyce, the first one being at 2089.89, and the others at 2104.27, 2011.05, 2116.46. Finally, there are the three higher peaks which formed the highest points reached thus far by the bull market. In addition, there are a couple of short-term projections which stand at 2109 and 2122, that should also be instrumental in capping the move over the short-term. As you can see on the chart, there are also green and blue parallels which intersect in the area.
The indicators are mixed with the SRSI overbought, and the MACD and the A/D oscillator showing significant divergence -- but still in an uptrend. We will not get a sell signal until they turn down and the minor trend line from 2026 has been broken. A longer term sell signal would have to see a close outside of the black channel line, and eventually below 2026.
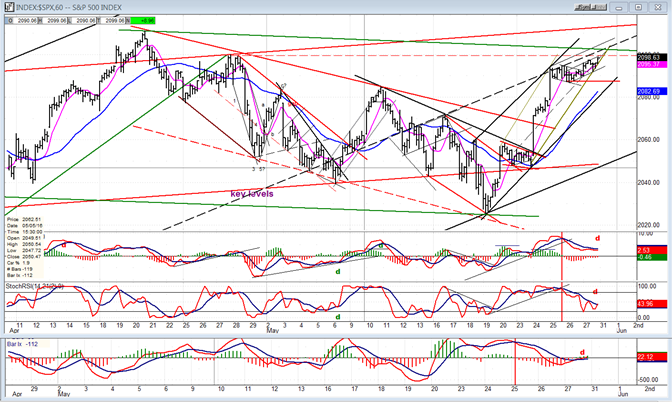
Hourly Chart
Buyers were not very aggressive for the past couple of days, barely turning prices out of the small congestion area by Friday’s close. But the trend remains up until we start to break the trend lines that are defining it. The first critical one will be the bottom one of the steeper black channel. That could quickly bring us close to challenging the larger black channel line which connects with 1810.
The heavy dashed line was not discussed in the daily chart analysis. It is a parallel of the larger channel line which runs at about one third of the channel width. Such a trend line often provides support to prices declining within the channel, and resistance to rising prices. This one appears to be doing just that along its course from the bottom and could be a factor in stopping the rally around this level. On the other hand, if prices move through it smartly, it would signify a resurgence of buying.
And it would take some good buying to turn the indicators more positive. Right now, they are in various states of divergence, but also may be turning up.
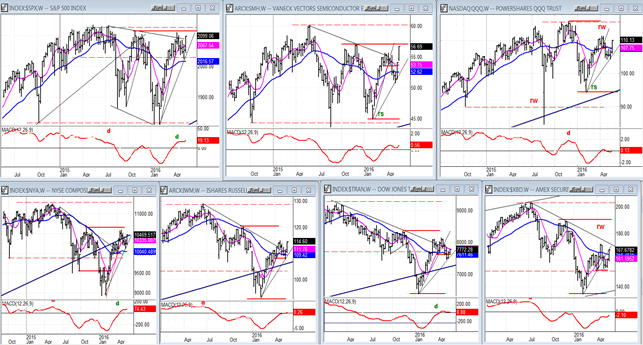
SPX et al… (weekly)
“… and SMH showed some good strength. What happens over the next week will undoubtedly be meaningful.”
It’s not the first time that the semis have led the market up or down, and that’s exactly what SMH did last Friday. It started the whole rally but, since the others looked lethargic, I did not take the cue seriously! If it keeps going – as well as the rest – we should take notice, but SMH is the only one which showed some good buying last week. The others have pretty much underperformed SPX, especially those in the lower tier which are among the weakest on a longer term basis. True to form, the TRAN had the worst rally for the week. Let’s see how they shape up next week!
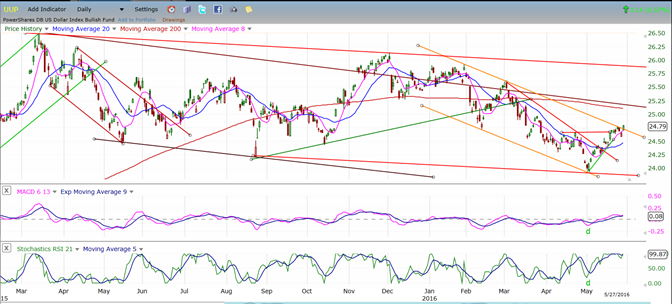
UUP (Dollar ETF)
UUP appears to have made a significant low. It has not only broken its short-term downtrend line, but it has risen above the previous short-term low, and now is attempting to move out of the corrective channel entirely. A move completely out of the channel would suggest that the index is in the process of resuming its primary trend to the upside, but this will include consolidations along the way.
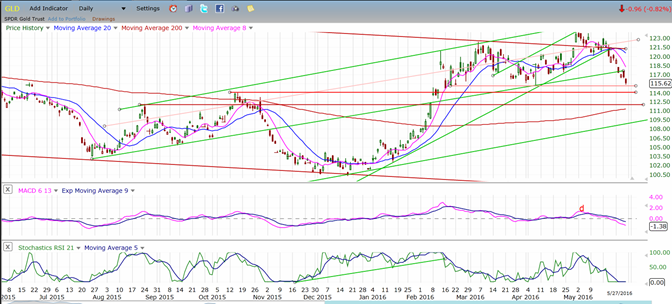
GLD (Gold ETF)
After breaking its daily trend line, GLD has continued to decline and will probably find some support a little lower at 115, but it is making an ominous pattern above that level which, if it is broken, could lead to a re-test of the December lows.
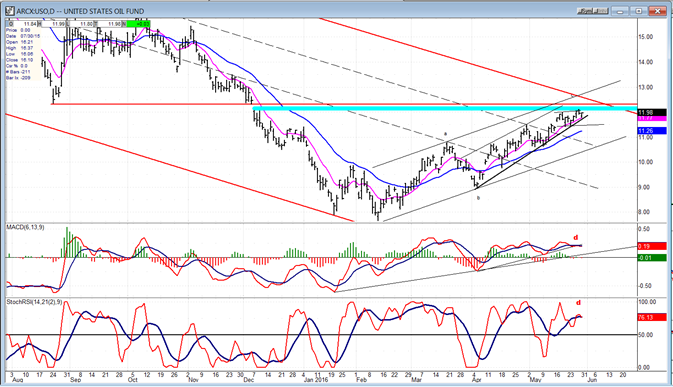
USO (US Oil Trust)
USO looks intent on closing the gap which was created when it broke support at 12.50, on its way to its 8 projection. Whether this gap is filled completely or only partially is moot since the index is nearing very important overhead resistance which is most likely going to end its oversold rally and start a retracement into the base. At the same time, the indicators are showing strong negative divergence, adding to the probability that a short-term reversal is about to occur.
Summary
There is (very) important support for the SPX between 2040 and 2043. It will have to be broken decisively in order for the index to resume its long-term downtrend.
After finding support at the bottom of a major trading range, SPX is again approaching the top of the resistance band where all rallies have failed and reversed course for the past one and a half years. Already some deceleration is taking place in the uptrend from 1226, but will it lead to another important reversal, or simply a consolidation followed by another challenge of the highs? This is what the market will tell us over the next couple of weeks.
********
FREE TRIAL SUBSCRIPTON
Market Turning Points is an uncommonly dependable, reasonably priced service providing intra-day market updates, a daily Market Summary, and detailed weekend reports. It is ideally suited to traders, but it can also be valuable to investors since highly accurate longer-term price projections are provided using Point & Figure analysis and Fibonacci projections. Best-time reversal estimates are obtained from cycle analysis.
For a FREE 4-week trial, send an email toFor further subscription options, payment plans, weekly newsletters, and for general information, I encourage you to visit my website at www.marketurningpoints.com. By clicking on "Free Newsletter" you can get a preview of the latest newsletter which is normally posted on Sunday afternoon (unless it happens to be a 3-day weekend in which case it could be posted on Monday).
The above comments and those made in the daily updates and the Market Summary about the financial markets are based purely on what I consider to be sound technical analysis principles. They represent my own opinion and are not meant to be construed as trading or investment advice, but are offered as an analytical point f view which might be of interest to those who follow stock market cycles and technical analysis.

When Andre Gratian was a stock broker years ago, a friend introduced him to technical analysis of the market. Consequently, it is not an exaggeration to say that Andre fell in love with this approach! Ever since then, it has become an increasingly important part of his professional life. Gratian has studied the works of Wyckoff, Edwards & Magee, Edward J. Dewey (cycles) and many others. However, one of my most profitable undertaking has probably been to study Point & Figure charting, which he finds invaluable in analyzing stocks and indices. If he were restricted to one methodology, this is the one that he would choose. This well-rounded background has given him what he feels to be a special insight into the stock market, facilitating the recognition of meaningful patterns and the ‘turning points’ in all trends, whether they be short or long term. Andre feels very comfortable discussing the stock market and passing on meaningful information to others. His subscribers include individuals and money managers throughout the world. Moreover, his Newsletters are currently published on several financial sites, here and abroad.


