Technical Analysis Of The Markets


Current Position of the Market
SPX Long-term trend: A lengthy correction is most likely underway!
SPX Intermediate trend: The H&S pattern has been invalidated and the index is re-testing the upper portion of its trading range.
Analysis of the short-term trend is done on a daily basis with the help of hourly charts. It is an important adjunct to the analysis of daily and weekly charts which discuss longer market trends.
CONSOLIDATION OR DISTRIBUTION?
Market Overview
On a long-term and intermediate-term basis, the SPX is the strongest of all the major indexes. The Dow Industrials, which had been keeping pace with it, has recently begun to fall behind. On a short-term basis, SPX is close to reaching some projections which should bring a reversal when they are met. Because of this, and because of resistance directly above its current level, last week I mentioned that moving much higher could be a difficult task. For the past week, it has been trading in a 20-point range, again re-testing the 2085 level on Friday after the release of a weak jobs report, but re-bounding once more toward the top of the range by the close.
If, as cycles appear to imply, this is short-term distribution, there is probably enough of a count already accumulated to send it back down to the 2050-55 support, at least – providing that it can break decisively below 2085 with sufficiently negative breadth. On Friday, the weak jobs numbers initially brought about some good selling, but then it probably dawned on traders that such weakness might delay even more any interest rate increase by the Fed, and the selling turned to buying. Will this bullish thinking prevail as we start another week of trading?
Benefiting from the weak report, the precious metals group had its best performance in six weeks, while the USD slumped on the news. But that did not help oil, which was disappointed that OPEC did nothing to curb production at its Thursday meeting.
SPX Chart Analysis
Daily chart (This chart, and others below, are courtesy of QCharts.com.)
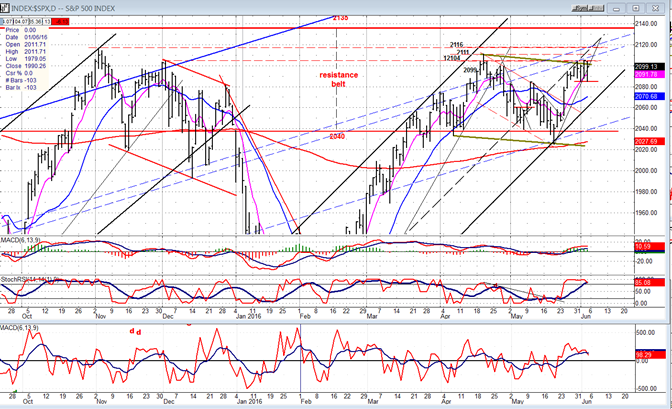
The same trend lines and former peaks which were discussed in detail last week remain intact and should continue to provide overhead resistance if the index makes an attempt at moving higher. On Friday, there was a slight breach of the minor uptrend line, but prices rallied to close on it, so no real harm was done. For a decline to get underway, the 2085 level (marked by a red horizontal line) will have to give way, but even that would not create too much of a pull-back unless there is enough follow-through to break the black channel line with a close well outside of it. Should that happen, the 2040 level could be re-tested. Because we should be at the top of short-term cycle which could cause the index to decline into the third week of the month, the odds favor a correction but, since short-term upside projections have not yet been reached, prices could extend a little higher first.
If we fail to develop very much weakness over the next couple of weeks, the odds of making a new high will increase, especially if we cannot break outside of the black channel. Even if we do, holding above the 2040 level may still bring another challenge to the current bull market high. For now, the indicators seem to favor the downside. They have started to roll over with the A/D oscillator already being in a minor downtrend, which amounts to negative divergence with price. For real weakness to develop, however, we will need to see this indicator, as well as the MACD, go negative right away.
Hourly Chart
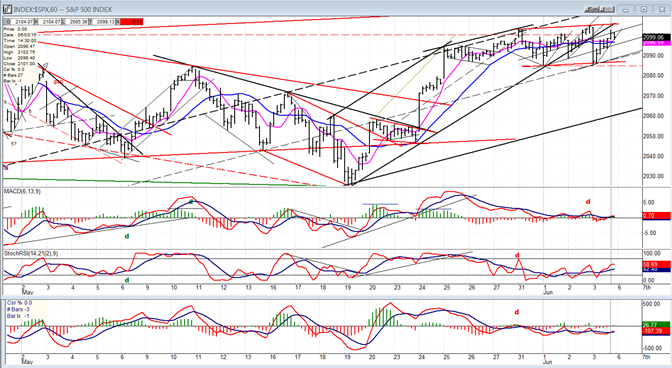
Prices have moved outside of the smaller black channel, but without bringing much weakness. On Friday, the index found enough support at the 2085 former low and on the dashed trend line to re-bound in what could be a back-test of the broken channel line. If so, we could move a little higher on Monday to complete that test, or start down and break the lower red support line right away.
Both the 8hr and 21hr MAs have flattened out and will need to be penetrated on the downside once again, with a follow-through break below 2085 to give a short-term sell signal. Support at this level comes from the two short-term peaks at the left of the chart.
The indicators are also moving sideways, following the price trend. They will have to turn down sharply to signal the beginning of a correction.
SPX et al… (daily)
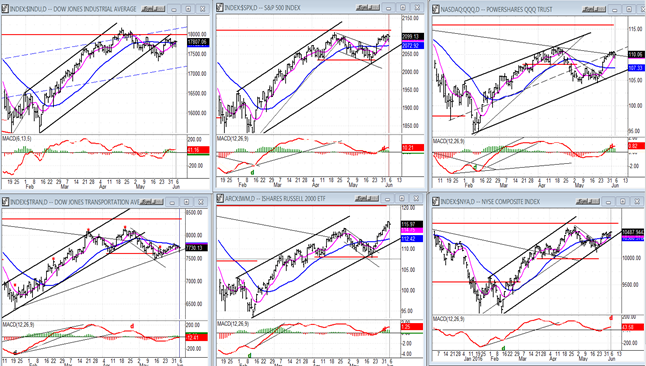
In the group of charts below, I have moved the SPX in the middle of the top row, and placed the DJIA above the TRAN for better comparison. Last week’s action did nothing to unify the trends of the various indexes. The DJIA and TRAN got a little weaker relative to SPX, while IWM became stronger – although it is only catching up a little after lagging behind considerably. The DJIA and TRAN are also the only two who are already trading outside of their larger channels. XBD is right on it and should be the next one to break it.
With the two DOWs coming out of their channels, especially if XBD and the others follow, it will become a picture which suggests slowly rolling to the downside. But it will require some sustained weakness for this to take place and, for now, all we can do is wait to see what comes next.
UUP (Dollar ETF)
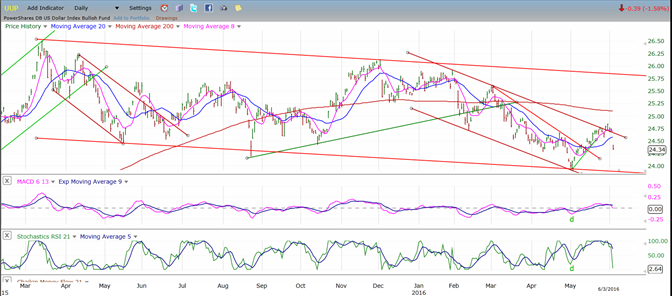
As the dollar was trying to move out of its correction channel, a poor jobs report sent it back inside and it will have to try again. This may or may not be a serious set-back. We’ll have to see.
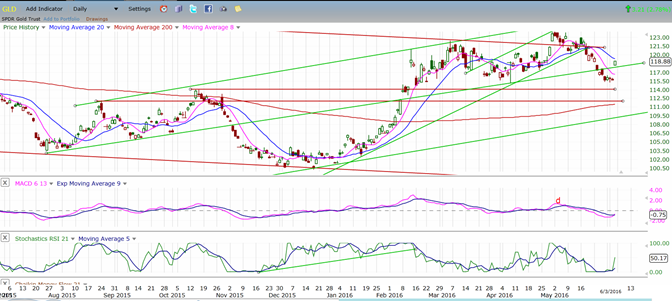
GLD (Gold ETF)
The dollar’s demise sent shorts in gold running for cover. If you remember, commercial COTs had a huge short position. Are they wrong? GLD is a long way from resuming its uptrend, and this could be only a consolidation in a downtrend, but the miners fared a lot better. Now it’s a question of whether or not they can muster follow-through strength.
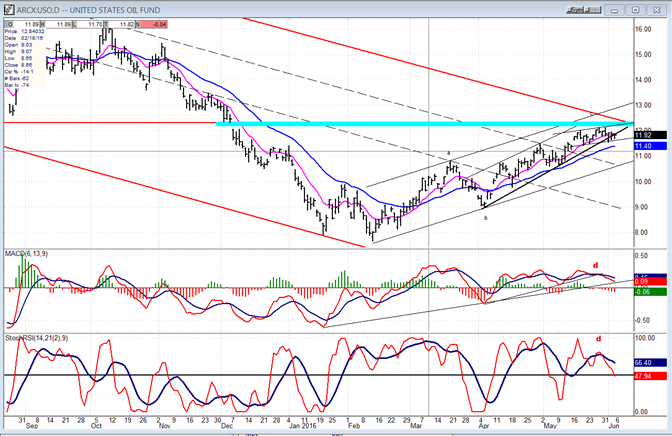
USO (US Oil Trust)
USO ran into resistance where expected, but the set-back of the dollar prevented it from being affected negatively by the OPEC decision not to curb oil production. A greater pull-back is likely in the next few days.
Summary
The extension of the SPX rally has run into resistance and stalled. At the same time, it has essentially reached an area of short-term projections. If it cannot break out to a new short-term high and regain its upside momentum, it will attract sellers and reverse its trend -- especially if it moves and closes below 2085.
********
FREE TRIAL SUBSCRIPTON
Market Turning Points is an uncommonly dependable, reasonably priced service providing intra-day market updates, a daily Market Summary, and detailed weekend reports. It is ideally suited to traders, but it can also be valuable to investors since highly accurate longer-term price projections are provided using Point & Figure analysis and Fibonacci projections. Best-time reversal estimates are obtained from cycle analysis.
For a FREE 4-week trial, send an email toFor further subscription options, payment plans, weekly newsletters, and for general information, I encourage you to visit my website at www.marketurningpoints.com. By clicking on "Free Newsletter" you can get a preview of the latest newsletter which is normally posted on Sunday afternoon (unless it happens to be a 3-day weekend in which case it could be posted on Monday).
The above comments and those made in the daily updates and the Market Summary about the financial markets are based purely on what I consider to be sound technical analysis principles. They represent my own opinion and are not meant to be construed as trading or investment advice, but are offered as an analytical point f view which might be of interest to those who follow stock market cycles and technical analysis.

When Andre Gratian was a stock broker years ago, a friend introduced him to technical analysis of the market. Consequently, it is not an exaggeration to say that Andre fell in love with this approach! Ever since then, it has become an increasingly important part of his professional life. Gratian has studied the works of Wyckoff, Edwards & Magee, Edward J. Dewey (cycles) and many others. However, one of my most profitable undertaking has probably been to study Point & Figure charting, which he finds invaluable in analyzing stocks and indices. If he were restricted to one methodology, this is the one that he would choose. This well-rounded background has given him what he feels to be a special insight into the stock market, facilitating the recognition of meaningful patterns and the ‘turning points’ in all trends, whether they be short or long term. Andre feels very comfortable discussing the stock market and passing on meaningful information to others. His subscribers include individuals and money managers throughout the world. Moreover, his Newsletters are currently published on several financial sites, here and abroad.
More from Gold-Eagle


