Technical Analysis Of The Markets
 share
share
 share
share
 share
share
 share
share
 share
share
Current Position of the Market
SPX Long-Term Trend: The long-term trend is near its all-time high.
SPX Intermediate trend: The uptrend from 1810 is now challenging the 2135 high.
Analysis of the short-term trend is done on a daily basis with the help of hourly charts. It is an important adjunct to the analysis of daily and weekly charts which discuss longer market trends.
A MINOR TOP?
Market Overview
Last week SPX broke out to a new high and continued to 2169, 34 points above the former high.
The current uptrend started at 1992 on 6/27, progressed to its first projection of 2109, consolidated for three days and moved to 2169, which is the next short-term projection level (2165-2175). The filling of a P&F projection and other technical considerations, including the appearance of some minor distribution at the 1269 level, points to a minor top which should allow the market another short-term consolidation period before moving on to its intermediate projection in the mid-2200s. This target is derived from the base which formed at the 1810 low…and which carries a count to this level.
Point&Figure projections are measuring tools which estimate how far a trend will carry. These estimates are fairly reliable but must be confirmed by other indicators and the market action itself. They do not come with a guarantee! If the short-term and intermediate projections hold up, we should enter a short period of consolidation…and then resume the uptrend from 1810. We can decide later if the mid-2200 will turn out to be the real bull market top.
In spite of the strength shown by some of the major averages, the uptrend is not collective. For instance, the Wilshire5000 Index still has not made a new high - and for that matter, neither has the NYA Index. Also, the DJIA has made a new all-time high. However, the Transports Index is still badly lagging. To be sure, DOW Theorists will tell us that this constitutes a big negative for the market.
Since we started to post the chart of the BPSPX to compare its progress with that of the SPX, let’s show the updated version (courtesy of StockCharts.com):
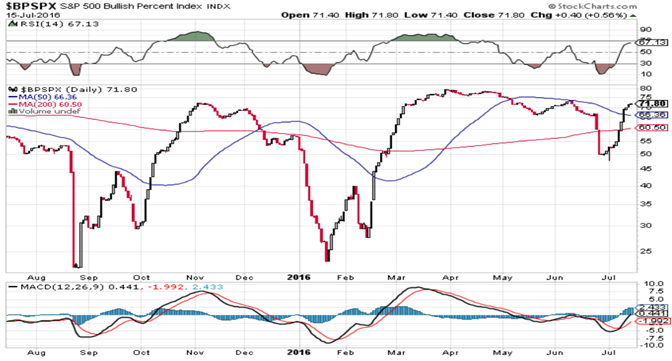
The index has made a lot of improvement since its low, but it is still lagging the SPX in relative strength and is still trading below its recent highs.
SPX Chart Analysis (This chart and others below are courtesy of QCharts.com.)
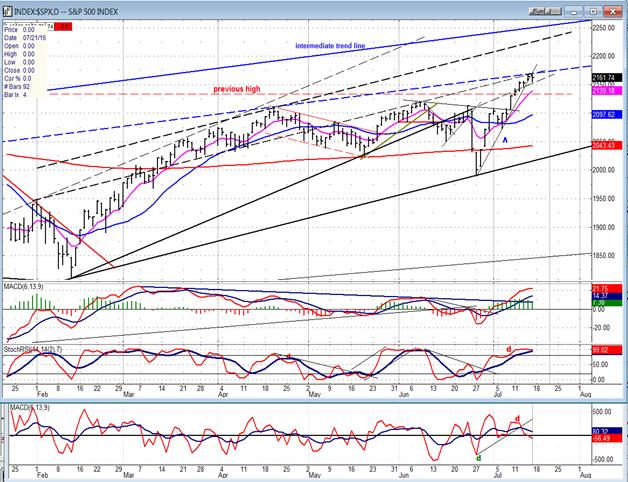
Daily Chart
SPX has managed to rise above the extension to the original trend line from 1810, but it immediately ran into resistance from a couple of parallel trend lines which are converging in the projection zone. This adds to the probability that a short-term top should form at this level. In addition, Friday was an “outside day” (when the index trades both above and below the previous day’s range) which also traded outside of the steep trend line. These conditions should add to the probability of a short-term reversal.
We’ll have to see what Monday brings, but if we start to retrace right away, the logical level of support would be the break-out point and former high of 2135. There are other good reasons for the index to pull back to that level during a short-term correction -- providing that 2169 remains the high of the move.
Of the three oscillators, the A/D oscillator is the closest to giving a sell signal. It has already made a bearish cross and even dipped below the zero line. The other two are simply overbought and losing upside momentum. The height reached by the MACD approximately corresponds to its high of early March. Unless some unexpected event triggers a sharp decline, negative divergence will have to show in this index before a top is reached. This practically ensures that any retracement form here will only be minor and will be followed by a new high before the entire move from 1810 is over.
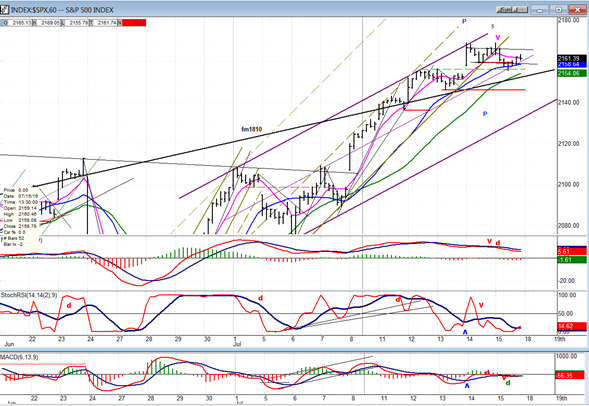
Hourly Chart
The trend from 1992 showed some pronounced deceleration after the consolidation which took place above the 2075 low. In the last few days, it had angled all the way over to the trend line form 1992 and was creeping along, unable to push away from it. This had caused a new price channel to form (purple) with three points along the top line. On Friday, after making a double top at 1969, prices moved through the trend line and found initial support on the previous near-term top, as well as on the mid-channel trend line of the new channel where they held for the second half of the trading session.
Deceleration was also evident in the momentum oscillators which had rolled over with strong positive divergence showing at the final high. This deceleration does not guarantee that we have seen the short-term high, but there are ample other signs that it should be the case. If so, a retracement to the lower purple channel line, and even outside of it would be a good bet.
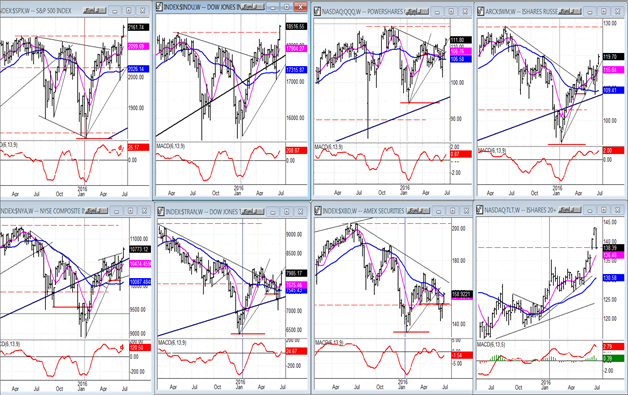
Some leading And Confirming Indexes (weekly)
All of the following indexes participated in the rally, but to a different extent. Only the SPX and DJIA were able to make all-time highs. While the Transportation Index had a good rally, it remains far below its November 2015 high. Obviously, this will certainly draw the attention of the Dow Theorists. The QQQ is the next strongest index but also remains well below its former high. XBD continues to be the weakest of the bunch.
TLT, which broke to a new all-time high three weeks ago, has corrected back down to its break-out point.
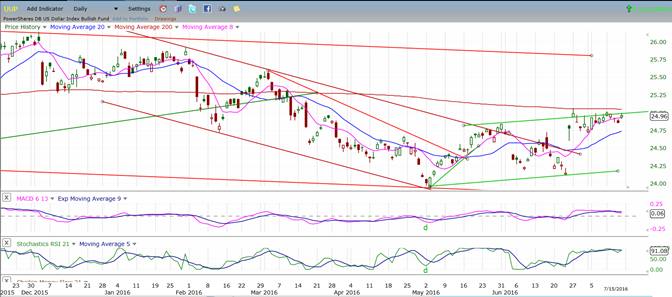
UUP (Dollar ETF)
UUP has met with resistance where expected at the top of its green channel and at its 200-DMA. It has not been pushed back very far by this resistance. Consequently, could indicate that a break-out above that level is near.
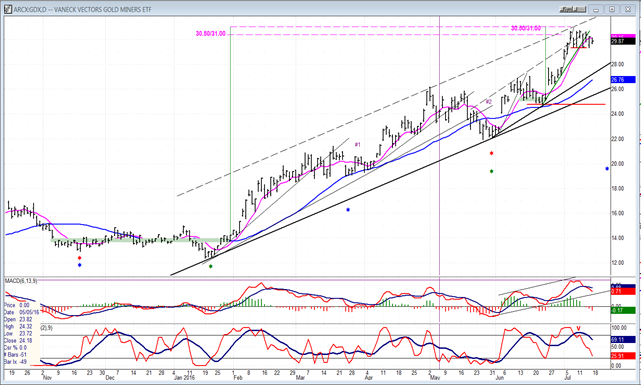
GDX (Gold Miners ETF)
GDX is consolidating in the area of its confirmed projection, but could pull back into the end of the month. There is a minor cycle low due around that time. However, this cycle can vary slightly in time and a good deal in intensity, depending on the technical condition of the index, so it remains to be seen how much of an effect it will have on GDX. It has also occasionally inverted! While the index may have a short-term correction, the overall trend remains strongly to the upside until the bottom trend line is seriously challenged.
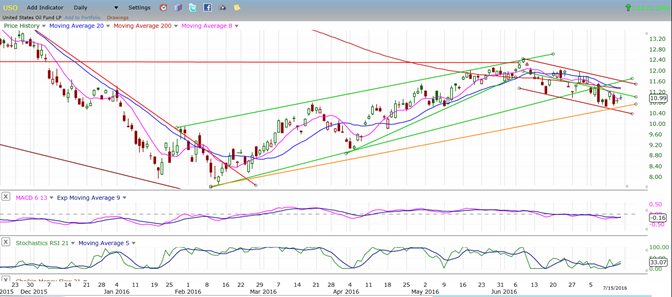
USO (US Oil Trust)
USO is resisting declining further as it finds support at the intersection of two lower channel lines. It is not clear if it is getting ready to challenge its former high, or if it will require further consolidation first. More time is needed to assess.
Summary
Last week, SPX broke out to a new all-time high and extended its move 34 points beyond. Since that level corresponds to a short-term projection, a minor top could develop and bring about the second correction of the uptrend which started at 1992. Unless extensive weakness appears during this correction, the index is expected to move on to its intermediate target of the mid-2200s.
If this is the 5th and last wave of the bull market which started in 2009, it could explain why so many indexes other than SPX and DJIA are lagging behind
********
FREE TRIAL SUBSCRIPTON
Market Turning Points is an uncommonly dependable, reasonably priced service providing intra-day market updates, a daily Market Summary, and detailed weekend reports. It is ideally suited to traders, but it can also be valuable to investors since highly accurate longer-term price projections are provided using Point & Figure analysis and Fibonacci projections. Best-time reversal estimates are obtained from cycle analysis.
For a FREE 4-week trial, send an email toFor further subscription options, payment plans, weekly newsletters, and for general information, I encourage you to visit my website at www.marketurningpoints.com. By clicking on "Free Newsletter" you can get a preview of the latest newsletter which is normally posted on Sunday afternoon (unless it happens to be a 3-day weekend in which case it could be posted on Monday).
The above comments and those made in the daily updates and the Market Summary about the financial markets are based purely on what I consider to be sound technical analysis principles. They represent my own opinion and are not meant to be construed as trading or investment advice, but are offered as an analytical point f view which might be of interest to those who follow stock market cycles and technical analysis.
share
share
share
share
share

When Andre Gratian was a stock broker years ago, a friend introduced him to technical analysis of the market. Consequently, it is not an exaggeration to say that Andre fell in love with this approach! Ever since then, it has become an increasingly important part of his professional life. Gratian has studied the works of Wyckoff, Edwards & Magee, Edward J. Dewey (cycles) and many others. However, one of my most profitable undertaking has probably been to study Point & Figure charting, which he finds invaluable in analyzing stocks and indices. If he were restricted to one methodology, this is the one that he would choose. This well-rounded background has given him what he feels to be a special insight into the stock market, facilitating the recognition of meaningful patterns and the ‘turning points’ in all trends, whether they be short or long term. Andre feels very comfortable discussing the stock market and passing on meaningful information to others. His subscribers include individuals and money managers throughout the world. Moreover, his Newsletters are currently published on several financial sites, here and abroad.


