Technical Analysis Of The Markets


Current Position of the Market
SPX Long-Term Trend: The long-term trend is up but weakening. Potential final phase of bull market.
SPX Intermediate-Trend: The uptrend from 1810 continues, but it has entered a corrective phase which could extend into November.
Analysis of the short-term trend is done on a daily basis with the help of hourly charts. It is an important adjunct to the analysis of daily and weekly charts which discuss longer market trends.
Another Month To Go?
Market Overview
The correction started after SPX reached 2193.81 on August 15, which makes it about 10 weeks old, with an estimated four more weeks to go. So far, it has been relatively mild, only giving up about 80 points while trading in a well-defined channel that has a gentle slope. If it remains within that channel during the remaining four weeks, the final low will come between 2090 and 2100.
Last week, I posted a chart showing the strong support which had been created by the price activity from February to August 2015 which ranged from 2040 to 2135. While it may be too old to still be valid, another band of support with similar parameters (2030-2120) was created more recently between March and July 2016. It has already been tested twice, confining declines to the top of its range. Last Friday, the six-week cycle started the final descent into its low scheduled for this time frame but, after only reaching its minimum projection target of 2130, it was arrested by the upward lift created by options expiration which proved to be more than a match for the cycle’s downward pressure, causing the index to close essentially unchanged for the day. But that may not be the end of it! The cycle low may not come until early next week, giving it time to resume its downward path and possibly test the top of the support zone once again.
As for the final price low in November, I suspect that the downward channel will steepen and reach a target well below the level of the current lower channel line.
Analysis (This chart and others below, are courtesy of QCharts.com.)
Daily Chart
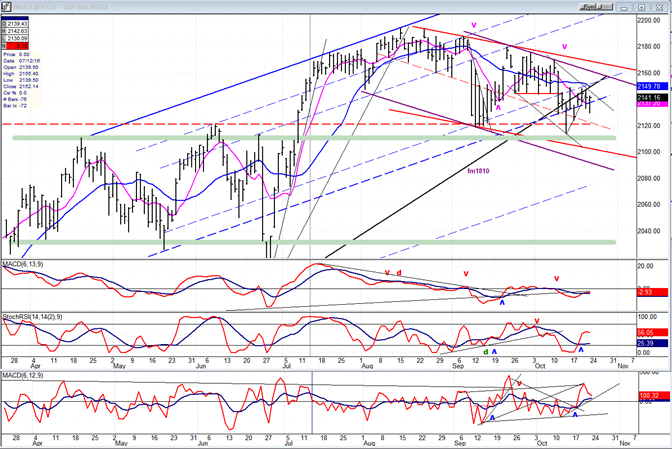
In the introduction, I spoke of a well-defined channel that had been created by declining prices. That is the red channel whose top trend line connects several tops. But the overall trend may already be steepening as is represented by the purple channel. There is also an even steeper (black) channel which may only represent one of the phases within the larger channel. If the six-week cycle makes its low on Tuesday, a subsequent rally could take the index outside of that channel, but if it fails to reach all the way to the top of the purple channel and it starts another phase down, we might be able to draw an even steeper primary channel whose bottom line could reach the lower level of support which is marked in green.
In fact, a steepening of the downtrend should be expected since the entire formation looks like a rounding top and, as we get closer and closer to its low point, the price decline should become steeper and steeper, often ending with a selling climax. The current formation does not have to end this way, but it is a possibility that should be kept in mind. This is also suggested by a top projection (confirmed by the secondary top) which calls for prices to reach the low of the support zone.
Note that the trend line from 1810 has been penetrated and a back test has already occurred. All that remains is for the decline to start in earnest.
The oscillators have rallied along with prices from the 2115 low, but they are beginning to roll over in anticipation of the next spell of weakness.
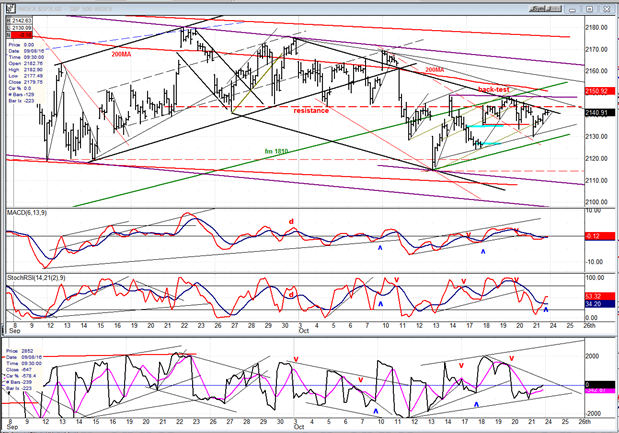
Hourly Chart
The various channels which comprise the hourly structure can be seen clearly, including a new one which may already be forming (thin black line under the purple line). The increasing steepness of the top trend lines, strongly suggest that we are dealing with a rounding structure, and this should warn us about a potential climactic low in November. But for now, we need to decide if the six-week cycle bottomed on Friday, or if it will do so early next week. Odds favor the latter, but if we get some strength on Monday, it will be an indication that we are already back in a short-term uptrend.
To keep the rounding-over pattern intact, the subsequent rally should be limited to a maximum of 2150-55. Much beyond that would cause me to alter the short-term scenario.
Friday’s 12-point rally started to turn the oscillators, but not enough to create a buy signal.
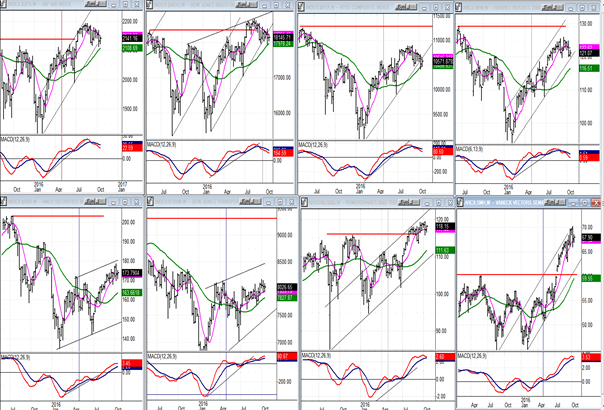
Some Leading And Confirming Indexes (Weekly Charts)
So far, the correction has been progressing at a snail’s pace for the major indexes, with the others barely acknowledging that one is underway. It is obvious that the market, as a whole, does not show any sign of major distribution taking place which would indicate that the seven-year bull market is coming to an end.
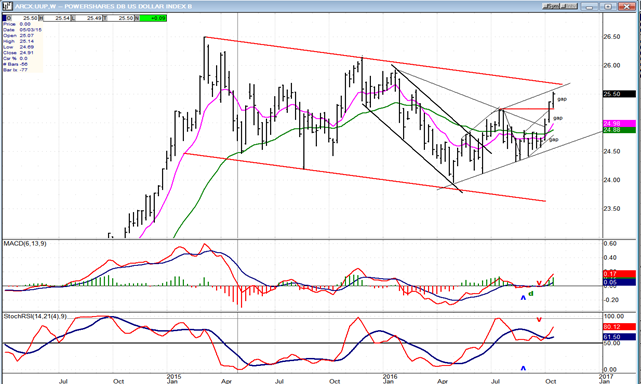
UUP (Dollar ETF)
The weekly chart gives us a good perspective of UUP’s position. The surge of the past three weeks has brought it near the top of its intermediate consolidation channel. Although it may challenge it over the near-term, it’s likely that some consolidation should take place before it can make much more upside progress.
GDX (Gold Miners ETF)
GDX failed to reach its 21.50-22.00 target before rebounding. For the moment, this minor rally is likely to be just that, a minor up-phase within the larger correction. It should stop at the declining trend line, or even before it reaches it. After that, a resumption of the downtrend is likely, along with a new low.
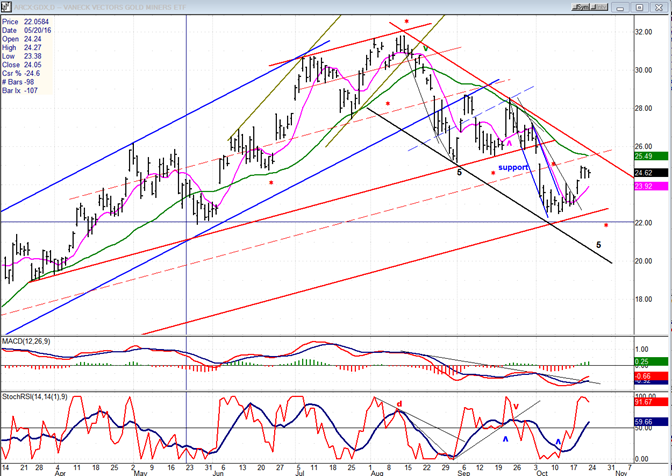
Note: GDX is now updated for subscribers several times throughout the day (along with SPX) on Marketurningpoints.com.
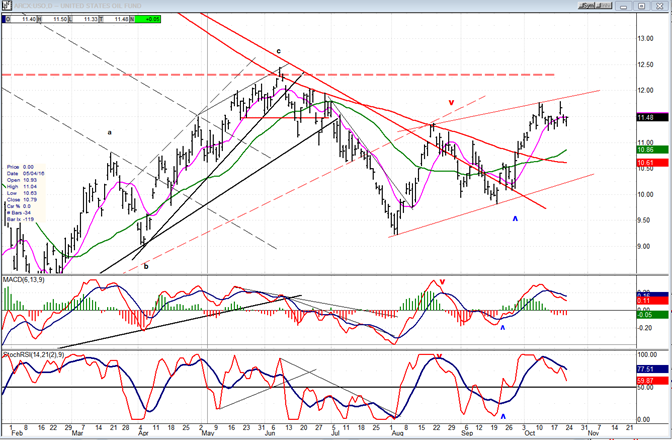
USO (US Oil Fund)
USO has made a couple of attempts at moving higher. Even if it does, the upside should be limited and more consolidation will be required until an adequate base has been built.
Summary
SPX appears to be making a rounding top and should see the correction steepen into its mid-to-late November low, perhaps ending with a small climactic move before the start of a new uptrend.
********
FREE TRIAL SUBSCRIPTON
Market Turning Points is an uncommonly dependable, reasonably priced service providing intra-day market updates, a daily Market Summary, and detailed weekend reports. It is ideally suited to traders, but it can also be valuable to investors since highly accurate longer-term price projections are provided using Point & Figure analysis and Fibonacci projections. Best-time reversal estimates are obtained from cycle analysis.
For a FREE 4-week trial, send an email to [email protected], or go to www.marketurningpoints.com and click on “subscribe”. There, you will also find subscription options, payment plans, weekly newsletters, and general information. By clicking on "Free Newsletter" you can get a preview of the latest newsletter which is normally posted on Sunday afternoon (unless it happens to be a 3-day weekend, in which case it could be posted on Monday).
The above comments and those made in the daily updates and the Market Summary about the financial markets are based purely on what I consider to be sound technical analysis principles. They represent my own opinion and are not meant to be construed as trading or investment advice, but are offered as an analytical point f view which might be of interest to those who follow stock market cycles and technical analysis.

When Andre Gratian was a stock broker years ago, a friend introduced him to technical analysis of the market. Consequently, it is not an exaggeration to say that Andre fell in love with this approach! Ever since then, it has become an increasingly important part of his professional life. Gratian has studied the works of Wyckoff, Edwards & Magee, Edward J. Dewey (cycles) and many others. However, one of my most profitable undertaking has probably been to study Point & Figure charting, which he finds invaluable in analyzing stocks and indices. If he were restricted to one methodology, this is the one that he would choose. This well-rounded background has given him what he feels to be a special insight into the stock market, facilitating the recognition of meaningful patterns and the ‘turning points’ in all trends, whether they be short or long term. Andre feels very comfortable discussing the stock market and passing on meaningful information to others. His subscribers include individuals and money managers throughout the world. Moreover, his Newsletters are currently published on several financial sites, here and abroad.


