Time To Light The Fire?


Readers who have read ‘Can lightning strike twice?’ will be aware that the Friday PM gold fix was right at major long term support for the gold price. When on June 30 of 2013, also a Friday, gold fixed at $1192, it was also right on similar support – and that saw a reversal in the steep down trend. Now this has happened again. The heading, unfortunately, given recent and not so recent history, compulsively has to end with the question mark; not to do so would place me in a dream world where technicals always work and where no interventionist forces exist. Nevertheless, this does not deter me from optimism and the hope, if not full belief, that it has in fact become time to light the fire in the PM markets, question marks notwithstanding.
Friday’s gold fixing is right on the lower boundary of a large pennant that has been the focus of the analysis for some time. Silver is also in a similar pennant, but was on Friday still a short distance away from support – yet the low for the day as Kitco has it, is only two cents short of that support, rising to end the day 30 cents higher. Could it be that silver has jumped the gun into recovery a little? Even gold closed the day $20 above the PM fix as if to follow the silver metal.
It would be absurd to think that a simple trend line could bring about major change in the markets, were it not that it has often happened in the past – not because the trend line is all-powerful, but because so much of what we do is accurately mapped out in patterns and cycles. Without our habits technical analysis cannot work.
Yet major changes in markets rarely happen in isolation; as it is often said, the tide affects all boats and when the tide turns its effect is felt all over. The shape of these patterns today is much different from June 2013, while this time the PM prices have no room left for the sideways and bearish trends that followed June 2013 – the new patterns are true bear market reversal patterns, should they hold true.
This week will be most interesting; will the PMs reverse to finally resume their long term bull markets and if so, how will the other markets react to whatever happened behind the scenes to bring that reversal about despite the concentrated forces that have been acting on the metals. Many other markets also experience a hidden hand that does not originate in normal supply and demand; will these markets also react to whatever is changing?
The DJIA has had a few bad days despite regular obvious attempts to orchestrate a recovery above 18000. The yield on the US 10-yearsT-note is stagnant sideways at a point of balance as if being maintained there despite selling pressure, while the dollar index, having already, I believe, made its top, have again failed to challenge the psychological 100 level, so far.
If this can really all be happening in July, what is waiting for us all in October?
Euro-Dollar Chart
If the charts are speaking the truth with respect to precious metals, then one may assume that the euro will also benefit from whatever could cause such a change in the market trends. It has held resolutely just above support from the long term bull channel, XYZ ($1.0794) and has recovered a little from the recent Greek-inflamed sell-off; enough to again break just above the steep bear channel VW ($1.0901).
The euro situation is still fragile; it will not require a major shift in the market for it to break below the key support and thus to extend the break below the bull channel ABCM $(1.1036). On the other hand, it will not require much of an improvement to recover into that bull channel leaving a bifurcated bottom below line M, a frequent sign that a significant trend reversal has taken place.
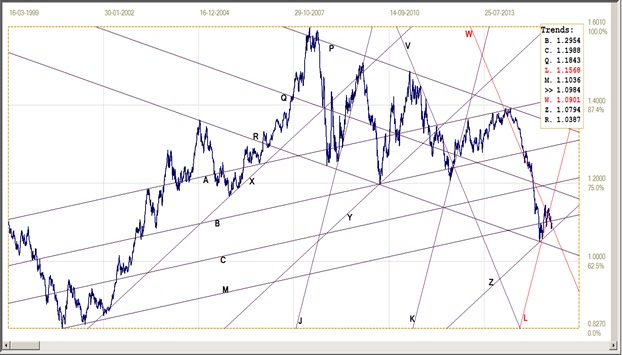
Euro-dollar, last = $1.0984 (www.investing.com)
Dow Jones Industrial Average (DJIA)
After making its double top, the DJIA reversed lower to move away from the rising wedge MZ (18996). Channel RS (18063) has been repositioned again, adjusted so that the ratio of RS to RQ fits the Fibonacci ratio – often a characteristic of a strong channel. While still early, the move lower out of the top is developing a megaphone between lines S and L – an unstable chart formation, megaphones can become very volatile and continue so after a break from the pattern.
A break clear below support at line L (17398) would require a new intermediate low - but then the DJIA has to extend below support at lines R (16533) and B (16463) to turn really bear.
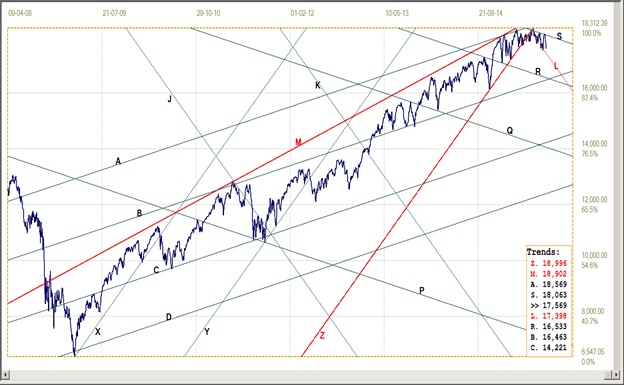
Dow Jones Industrial Index, last = 17569 (money.cnn.com)
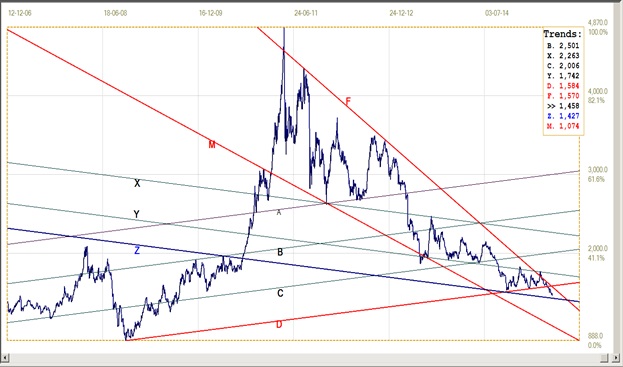
Gold PM fix - Dollars
Gold price – London PM fix, last = $1080.80 (www.kitco.com)
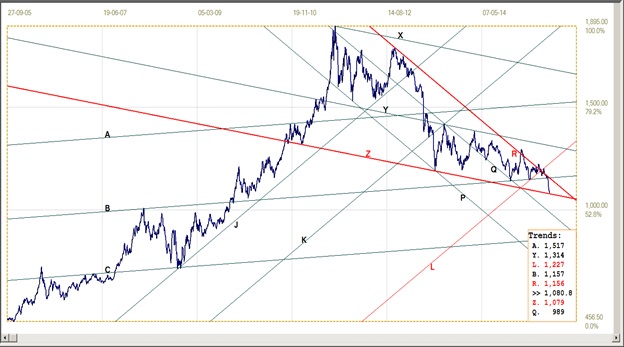
While there is still room to move sideways and lower in the pennant RZ (R: 1156, Z: 1079), the fact that gold has just completed leg 4 within that pattern is reason for optimism. The clear break below the support along line B ($1157) that has held firm on two recent occasions, was a major disappointment, but, as the chart shows, this was necessary for the pennant to proceed through the normal development for such a pattern.
Line Z is now key support so that, while it holds, as sideways move between line Z and line R to remain in the pennant while on leg 5, will still be reason for optimism. There is ample room to move more sideways, at least until October!
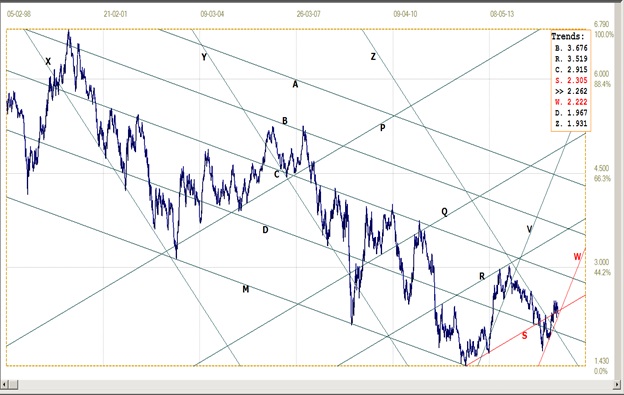
Gold PM fix - Euro
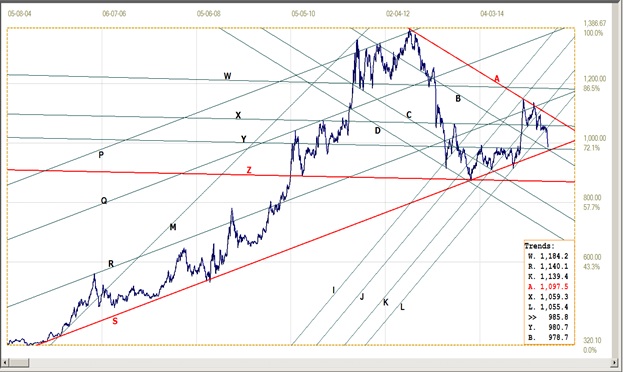
Euro gold price – PM fix in Euro, last = €985.8 (www.kitco.com)
The euro price of gold has finally broken the stranglehold of the tightly range bound sideways trend of recent weeks – breaking clear below bull channel KL (€1055) in a fell swoop. The steep decline ended a little above support at line Y (€980.7) and the bottom of the large triangle, AS (€978.7). Initially, the reversals off line A to signal the start of leg 4 of the triangle held at or around line X (€1059) as if that leg might not extend lower at all, until last week. Now it is a question whether the price could decline further to meet line S.
Failure to do so would not matter too much – however, if a reversal higher were to break above the triangle in due course, doing so while technically still on leg 4, that would be very bullish - which would mean gold is really outperforming the euro.
Silver Daily Fix Chart
The silver price had been edging further and lower into the apex of the triangle FD (F: $15.70 – D: 15.84) then broke lower just before the lines crossed. This trend is continuing in pennant FZ ($14.27). On Friday, the daily fix at $ 14.58 was still well short of the bottom of the pennant, but the low for the day at $14.29) almost made it. The silver fix is in the morning and so silver can still make it to line Z, while the gold PM fix shows it holding level at or reversing higher from its Friday fix.
However, should the low on Friday be sustained, a move higher for silver – joining gold and perhaps the euro – to later break above pennant FZ, doing so while still on leg 4 would point to a strong rally to follow, as experience has shown.
Silver daily fix, last = $14.58 (www.kitco.com)
US 10-year Treasury Note
The yield on the 10-year Treasury note is still in its quite volatile mostly sideways trend, holding just within bear channel VW (2.222%) In the same way the 18000 level appears to be considered of strategic importance for the DJIA, a weaker trend in the yield on the US 10-year Treasury note appears capped at 2.40%. Any bullish move lower that approaches the 2.0% level on the other hand seems to attract an increase in supply that pushes the yield higher again.
The yield is sitting close to the steep channel VW and has to resume its rising trend quite soon if the channel is to hold. However, channel RS is also a bear possibility.
U.S. 10-year Treasury note, last = 2.262% (www.investing.com)
West Texas Intermediate crude. Daily close
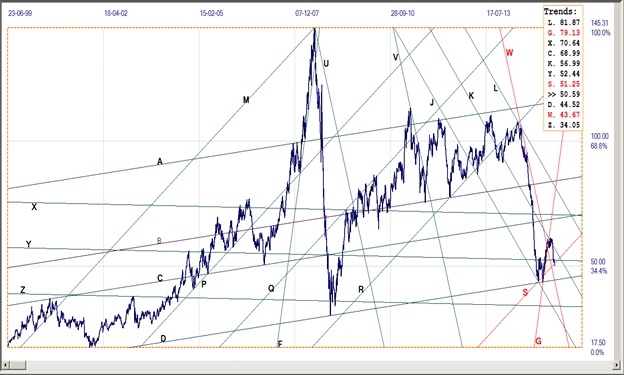
West Texas Intermediate – Daily close, last = $50.59 (21 July)
The latest official EIA price is for 21 July, which is still before the slump all across the resources board that happened later last week. The recovery off support at line D ($44.52) has failed to hold above the steep initial support of line G ($79.13) and then fell steeply to also break clear below support at line Y ($52.44) and marginally below support from bull channel RS ($51.25).
If the price can recover back into channel RS, it would fit my previous opinion that channel RS seemed a likely, more gradual path of recovery for the price of crude. If no recovery happens, the outlook for oil and the oil industry becomes more bleak. A full return of Iran to the global oil market could be the trigger for such an event…and might also be a spark that has wider effects across a number of major markets
©2015 daan joubert, Rights Reserved chartsym (at) gmail(dot)com
More from Gold-Eagle


