TLT Update…The Odd Couple Of US Bonds And Gold
 share
share
 share
share
 share
share
 share
share
 share
share
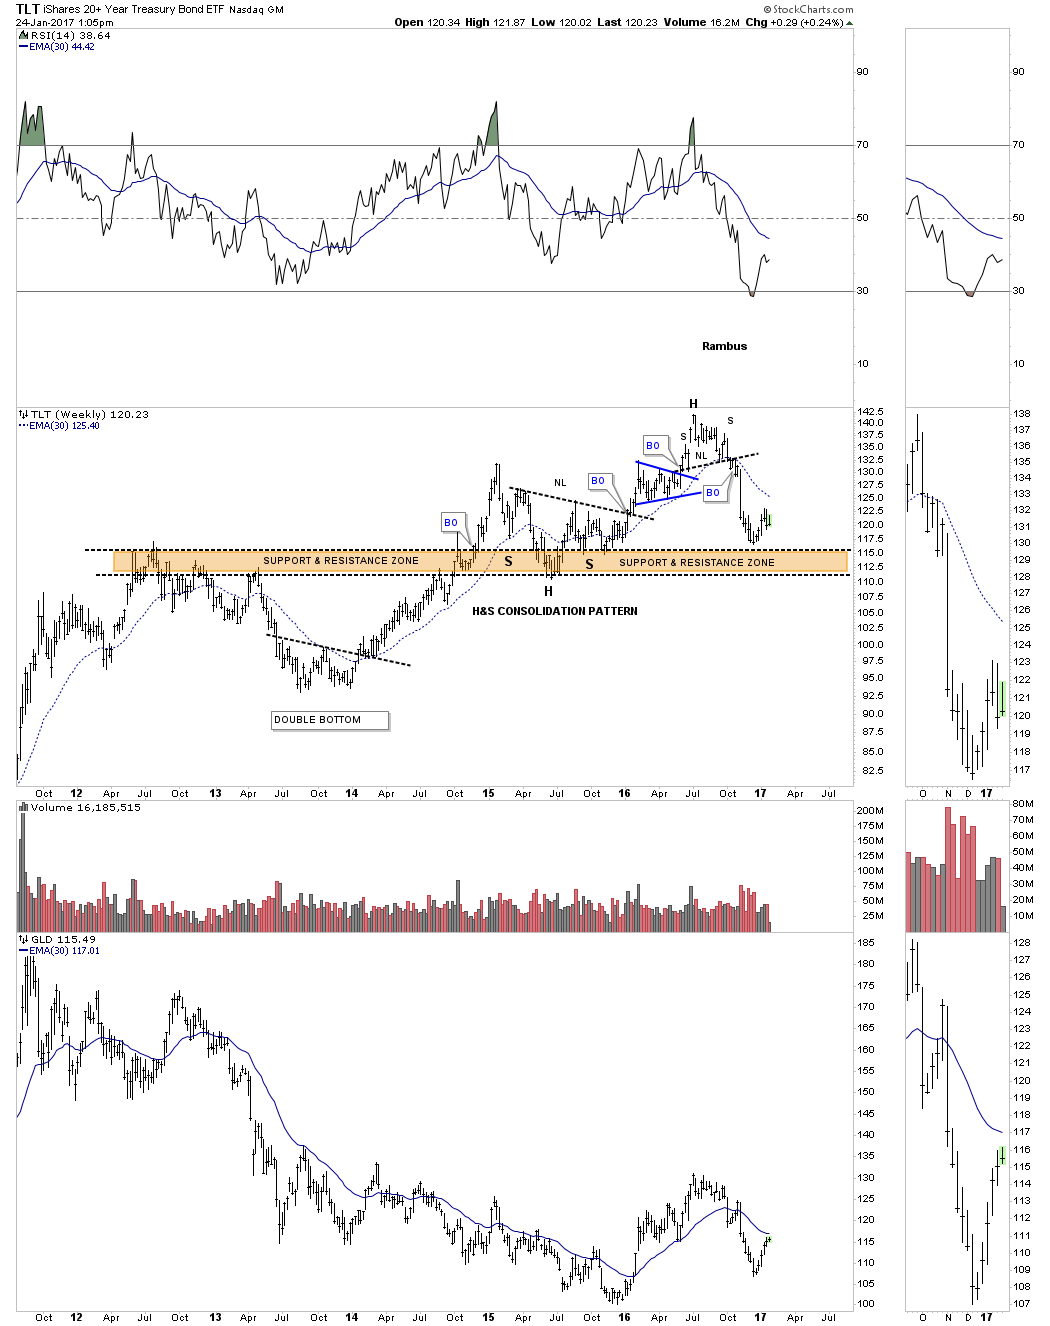
Let’s start by looking at a weekly chart for TLT, 20 year bond ETF, which shows it built out an H&S top last summer. That H&S top is a reversal pattern that showed up at the end of its bull market which has been ongoing for many years. There is a big brown shaded support and resistance zone that has been offering support.
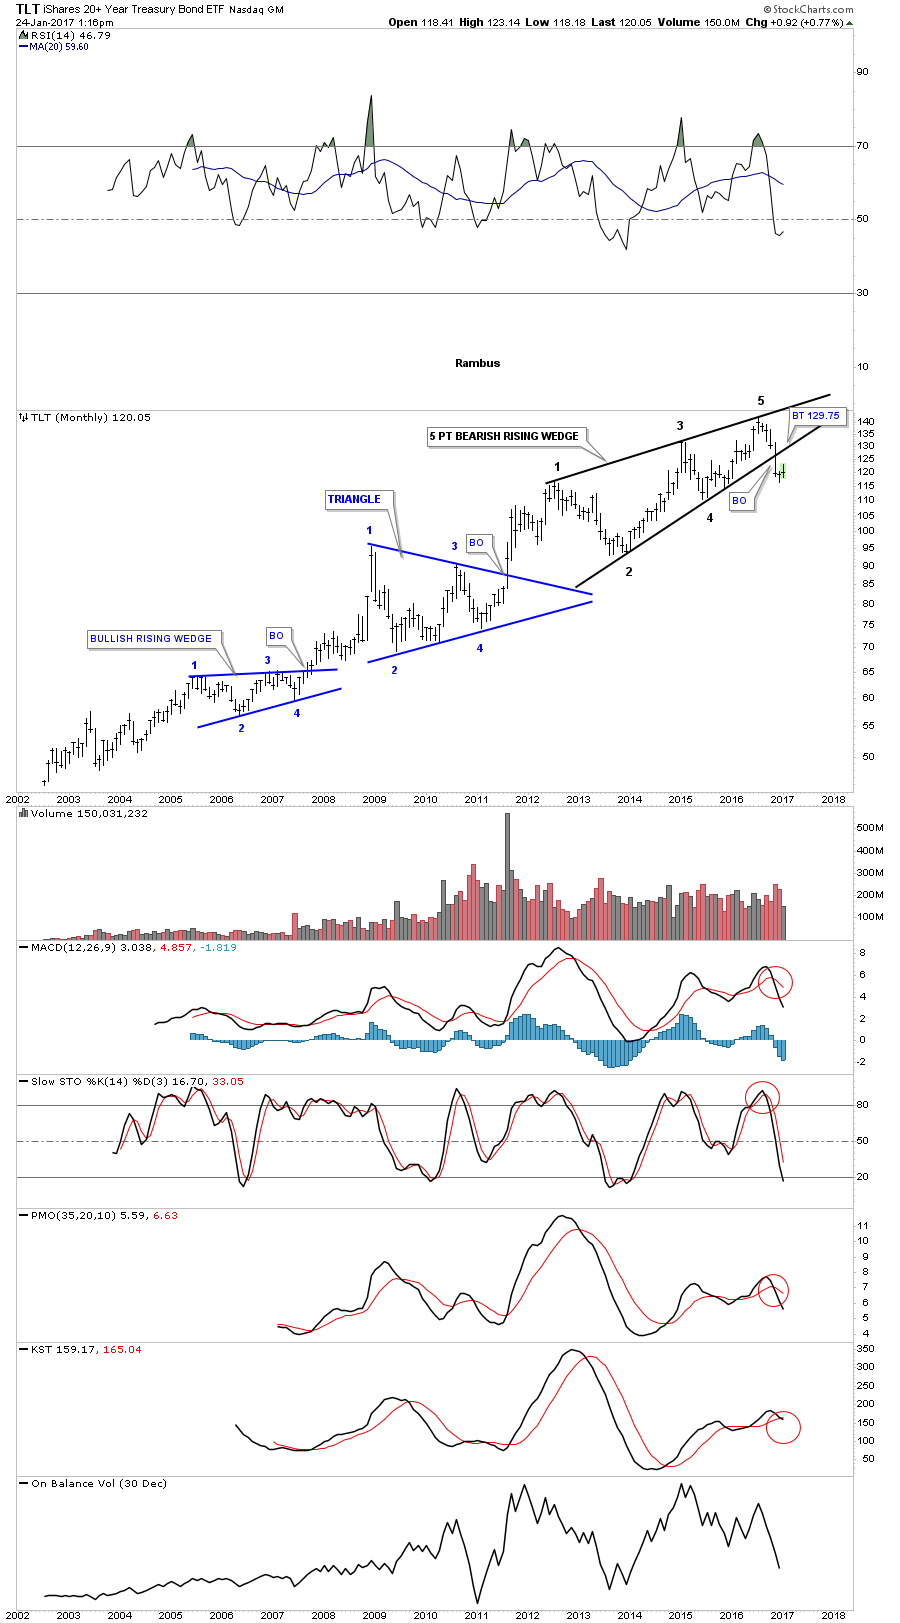
This next chart is a 15 year monthly look at the TLT which shows it has built out a four year 5 point bearish rising wedge which broke to the downside in November of last year. If there is a backtest it would come in around the 129.75 area.
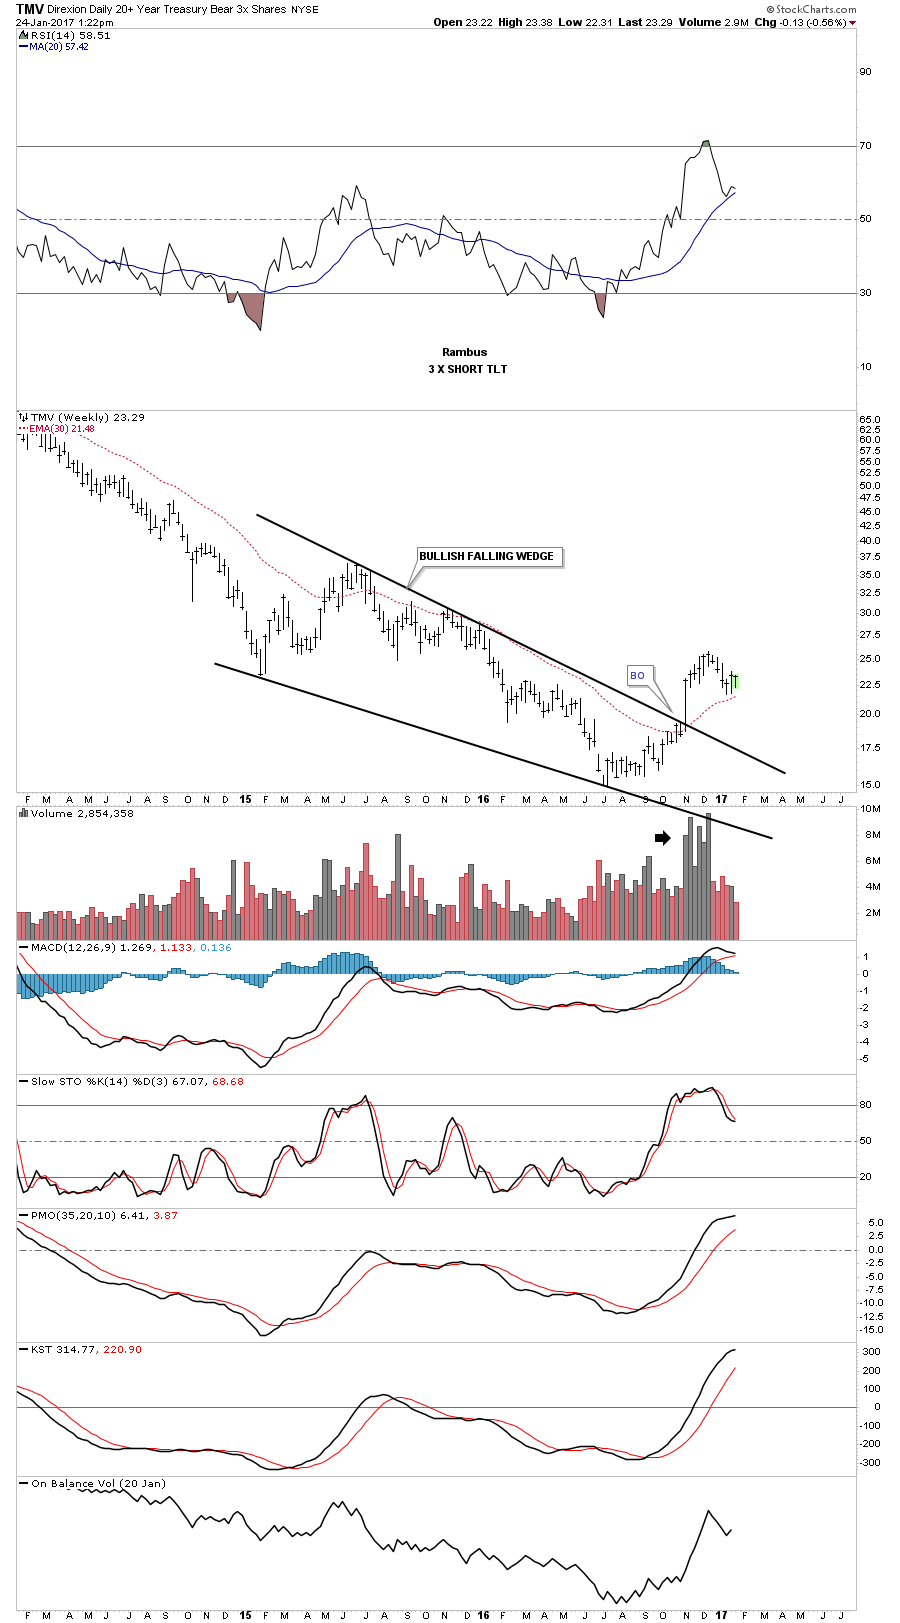
TMV is a 3 X short the TLT.
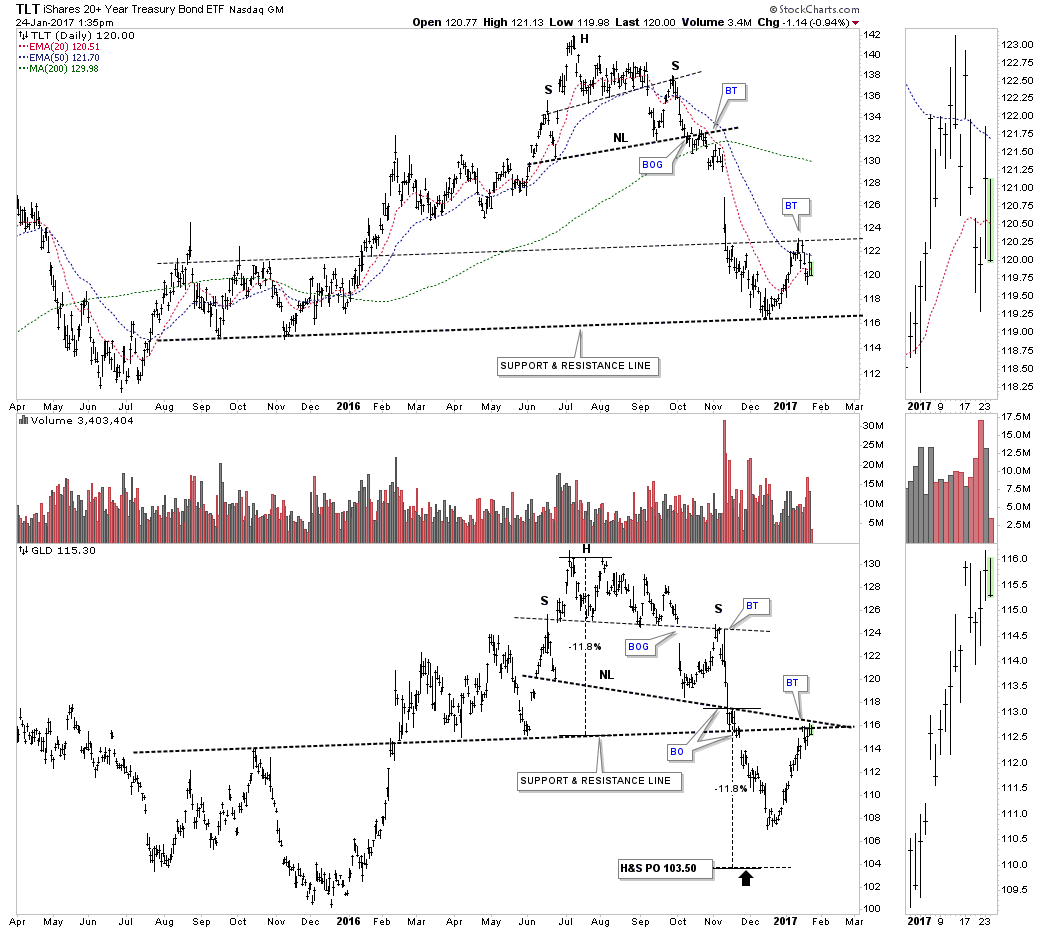
This last chart is a combo chart which has the TLT on top and GLD on the bottom. It’s not a perfect correlation by any means but these two have been moving together pretty consistently over the last year or so. GLD is currently back-testing its neckline and a support and resistance line going back a year and a half or so. If GLD can trade back above the neckline and the S&R line the bulls will be talking to us. To say this is a critical area for GLD is an understatement. Definitely an area to keep a close eye on.
*******
share
share
share
share
share
 Meet Rambus, a seasoned trader and technical analyst renowned for his unbiased and insightful chart work. Through his website, Rambus Chartology, and Substack newsletter, Rambus shares his expertise with a global community of subscribers, providing daily updates, commentaries, and hands-on training in the art and science of chartology. With his calm, humble, and down-to-earth approach, Rambus demystifies complex market trends, helping his followers navigate the challenges of today's volatile markets. Join the Rambus Chartology community today and discover a unique blend of technical analysis, trading expertise, and time-tested protocols. Subscribe now at www.rambus1.com or https://rambuschartology.substack.com/


